From the daily chart, it’s hard to miss the dramatic descent from the glittering heights of $116,000. The drop has been accompanied by a chorus of expanding red volume bars, a classic sign that sellers are dictating the tempo. Attempts at stabilization? Let’s just say the green candles that followed were more whimper than roar.
The trend remains bearish until the mid-$96,000 range is reclaimed on daily closes, which currently looks like wishful thinking in a sea of seller control. For now, the $89,000 to $90,000 band is acting as a makeshift lifeboat, but any rally sailing toward $96,000–$100,000 risks capsizing on prior resistance.

BTC/USD 1-day chart via Bitstamp on Nov. 19, 2025.
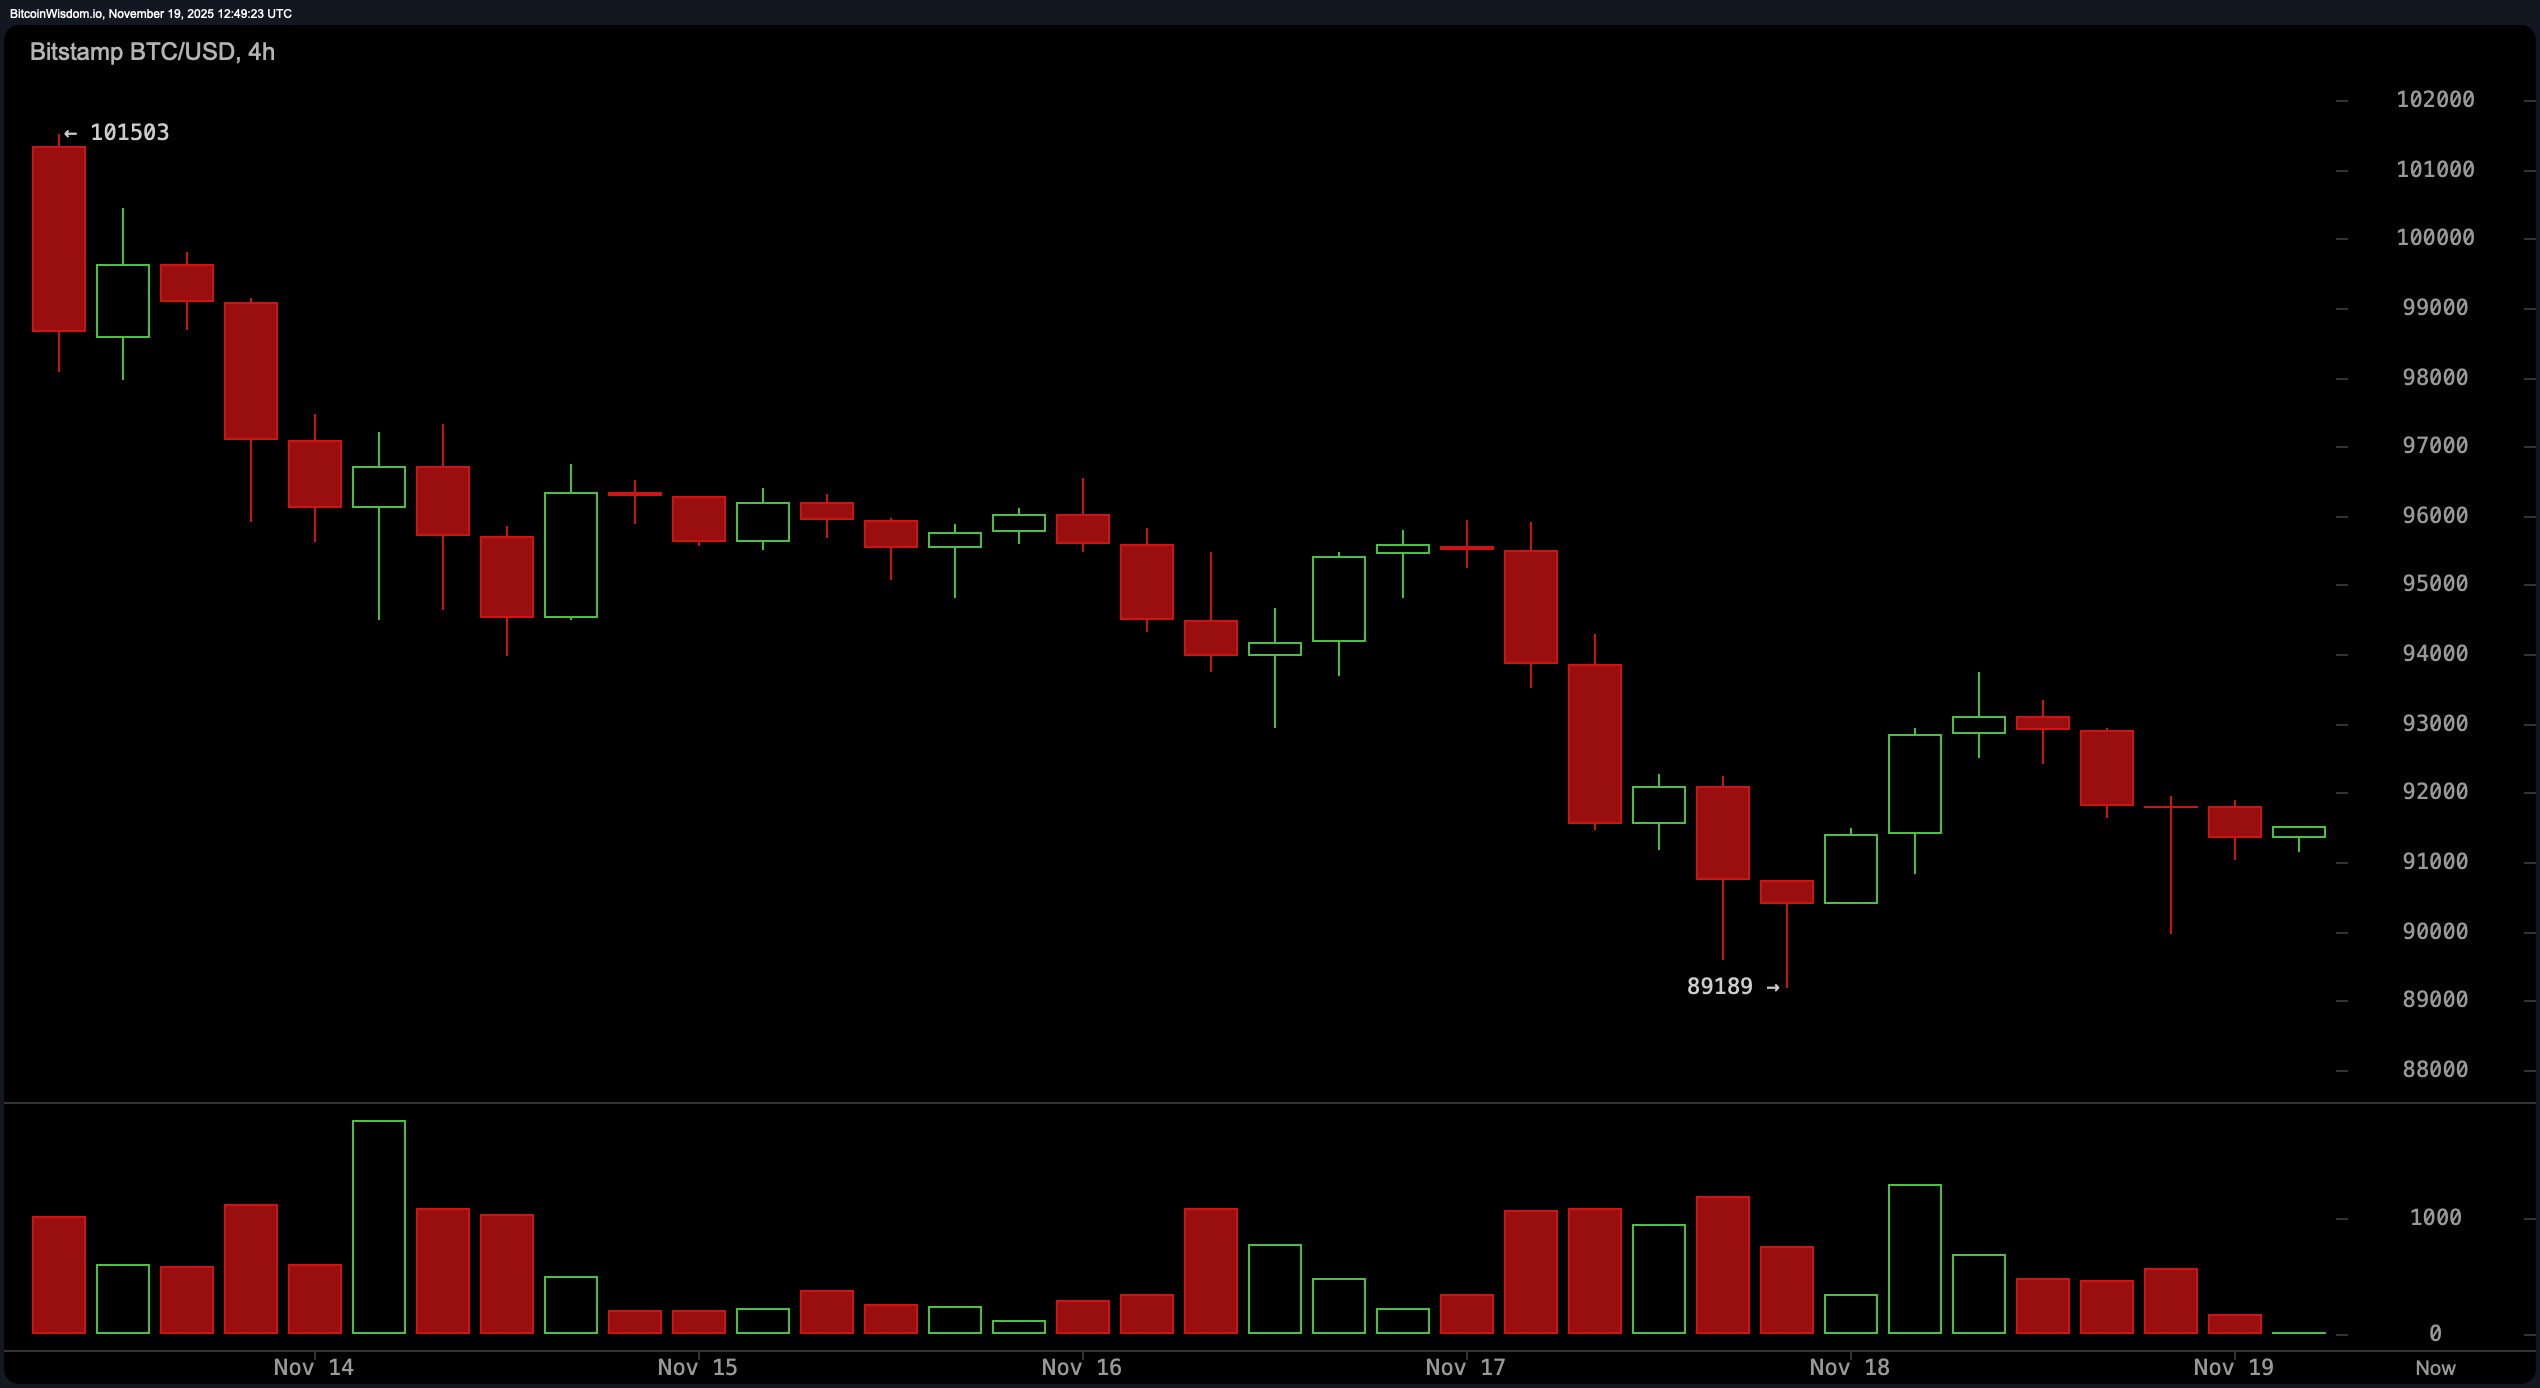
Zooming into the four-hour chart, bitcoin recently dropped from $101,503 with all the grace of a falling anvil. The bounce that followed was tepid at best, repeatedly smacking into resistance in the $93,000 zone like a bird trying to escape through a closed window. Sellers continue to defend this level fiercely. The lack of a clean higher-high post-bounce is telling: momentum is not just flat—it’s snoozing. Until a break and hold above $93,500 occurs on meaningful volume, this timeframe offers little encouragement for the ambitious.

BTC/USD 4-hour chart via Bitstamp on Nov. 19, 2025.
The hourly chart adds a touch more drama, showing a bounce from $89,189 that quickly ran into a ceiling around $93,753 before rolling over again. The price action has since boxed itself into a narrow range between $90,500 and $93,000—picture a toddler stuck in a playpen, eager to break out but lacking the strength to climb. Volume is drying up like a desert creek, and seasoned chart-watchers know that this kind of coil usually precedes a sharp directional burst. Eyes should be glued to $93,700 on the upside and $90,500 on the downside for signs of a breakout.

BTC/USD 1-hour chart via Bitstamp on Nov. 19, 2025.
Oscillator readings don’t exactly sing a tune of enthusiasm either. The relative strength index (RSI) sits at a weak-kneed 29, the stochastic oscillator is barely above water at 13, and the commodity channel index (CCI) has plunged to -142. The average directional index (ADX) holds at 38, suggesting trend strength exists but without a clear directional edge. Meanwhile, the awesome oscillator prints a mildly negative value, and both the momentum indicator and moving average convergence divergence (MACD) level are firmly on the bearish side of the fence, coming in at −13,232 and −4,651, respectively.
As for the moving averages, let’s just say they’re not feeling generous. The exponential moving averages (EMAs) and simple moving averages (SMAs) from 10 to 200 periods are all well above current price levels—effectively forming a ceiling of iron. The 10-period EMA sits at $96,153, while the 200-period simple moving average towers at $110,411. Every one of these averages suggests bitcoin is still very much in correction territory, with no immediate signs of a reversal in sight.
So, where does this leave us? With bitcoin boxed in, volume thinning, and indicators leaning toward fatigue, traders are left watching and waiting. Until price decisively breaks out of this range and proves it can close above key resistance levels, the prevailing vibe remains cautious.
Bull Verdict:
If bitcoin can break and close above $93,700 with conviction and rising volume, the first real glimmer of bullish momentum may emerge. A follow-through above $96,000 would confirm strength, suggesting a possible trend reversal after weeks of downward pressure.
Bear Verdict:
Without a firm reclaim of $93,500 and continued closes below key moving averages, the risk remains tilted downward. Failure to hold the $90,000–$89,000 support could open the trapdoor for another leg lower, confirming the bears are still running the show.
- What is bitcoin’s current price today, November 19, 2025?
Bitcoin is trading at $91,344 as of today. - Is bitcoin trending up or down right now?
Current chart structures across all timeframes show a downward trend. - What’s the key support level for bitcoin this week?
The $89,000–$90,000 zone is acting as short-term support. - What resistance level could stop bitcoin from climbing?
Sellers are firmly defending the $93,500–$96,000 range.
免责声明:本文章仅代表作者个人观点,不代表本平台的立场和观点。本文章仅供信息分享,不构成对任何人的任何投资建议。用户与作者之间的任何争议,与本平台无关。如网页中刊载的文章或图片涉及侵权,请提供相关的权利证明和身份证明发送邮件到support@aicoin.com,本平台相关工作人员将会进行核查。


