The RSI indicator, short for Relative Strength Index, is a widely used tool in technical analysis. It helps investors assess market trends and potential reversal signals by analyzing the magnitude of price changes. When RSI divergence occurs, it typically attracts market attention. So, what is the RSI divergence signal? What are the reasons behind it? What does it mean for technical analysis? Let's explore these questions one by one.

1. Cause Analysis: Why Does RSI Divergence Occur
RSI divergence usually arises from a lack of synchronization between price movements and momentum. Here are a few possible reasons for its occurrence:
1. Deviation Between Trend Strength and Momentum
a. In an uptrend, prices continuously reach new highs, but the RSI fails to reach new highs, resulting in a "top divergence."
b. In a downtrend, prices keep hitting new lows, but the RSI does not reach new lows, forming a "bottom divergence." This suggests that market momentum may be weakening, potentially indicating a trend reversal.
2. Changes in Market Sentiment
a. A shift in market sentiment (e.g., excessive optimism or pessimism) can lead to prices not fully reflecting true value, which may also contribute to RSI divergence.
3. Possibility of Manipulation by Major Players
a. Major funds may create false price trends to mislead investor sentiment, thereby triggering RSI divergence signals.
2. Significance of RSI Divergence in Technical Analysis
RSI divergence serves not only as a warning signal before price reversals but also as an important analytical tool, holding several implications for investment decisions:
1. Insights from Top and Bottom Divergence
Top Divergence: Alerts investors to be cautious of risks in an uptrend and to guard against market downturns.
Bottom Divergence: Reminds investors to pay attention to potential reversal opportunities, aiding in the search for possible buying opportunities.
2. Enhancing the Accuracy of Trading Decisions
Combining RSI divergence with other technical indicators (such as MACD, moving averages, etc.) can help investors establish a multidimensional analysis system, thereby reducing trading risks and improving strategy effectiveness.
3. Assisting in Judging Trend Reversals
Although RSI divergence cannot predict market changes with 100% accuracy, it can provide investors with references and supplement short-term reversal predictions.
3. Comparison Overview of Top Divergence and Bottom Divergence
The following table details the differences between the two types of RSI divergence:

Friendly Reminder: RSI divergence signals are not absolutely precise. Investors should combine various tools (such as technical indicators and fundamental analysis) when analyzing the market to make more informed trading decisions.
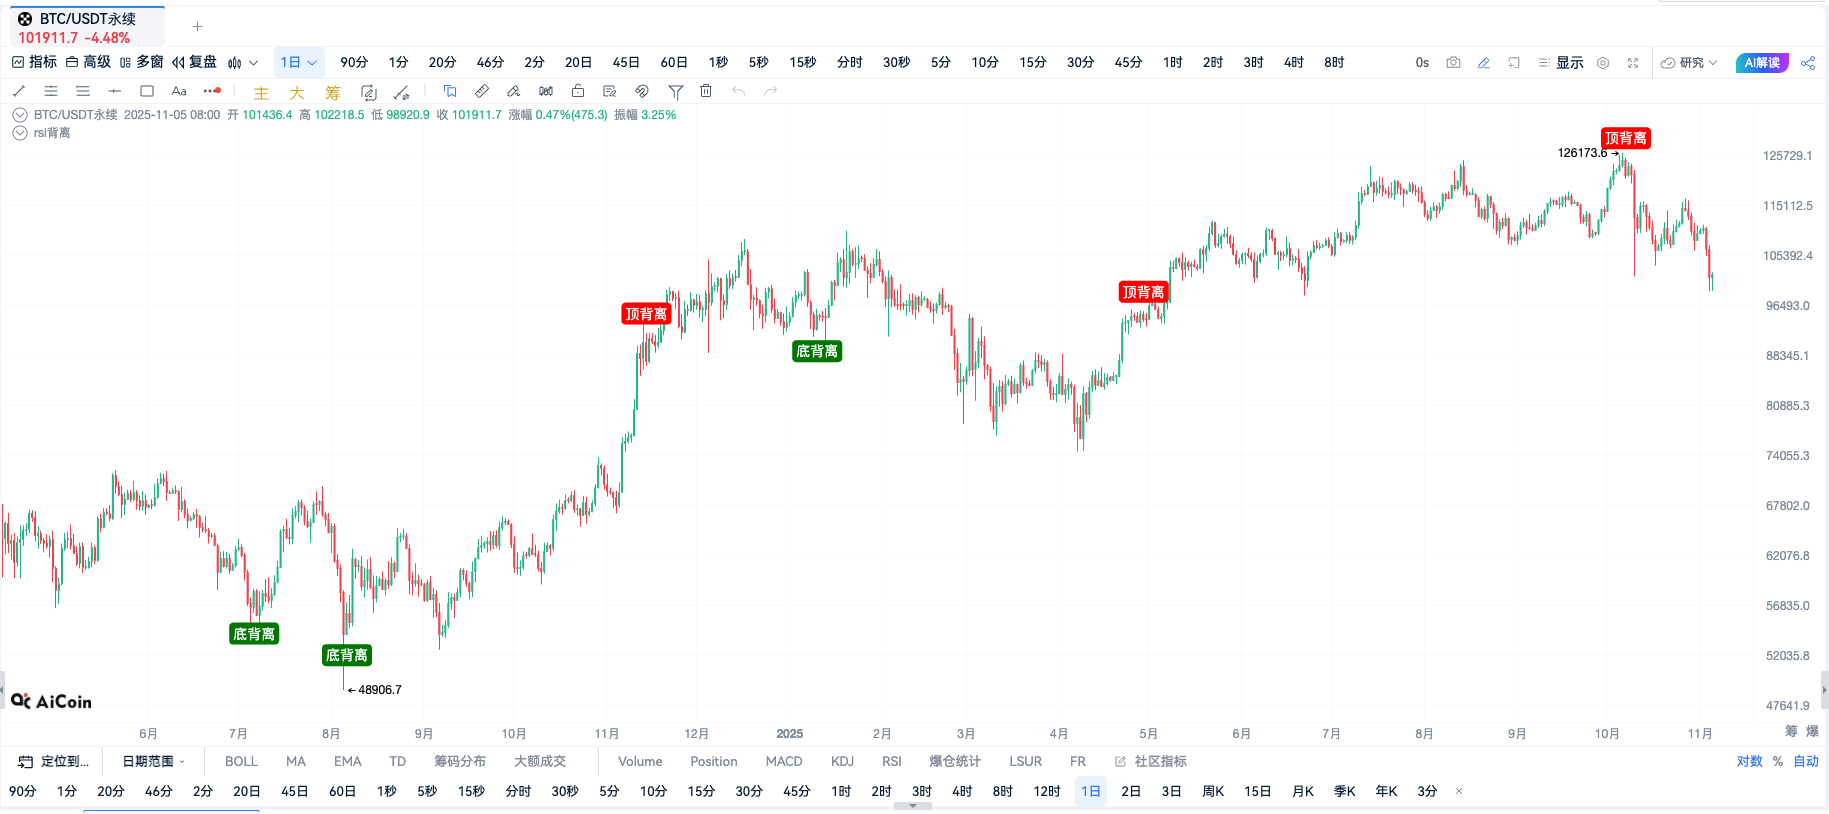
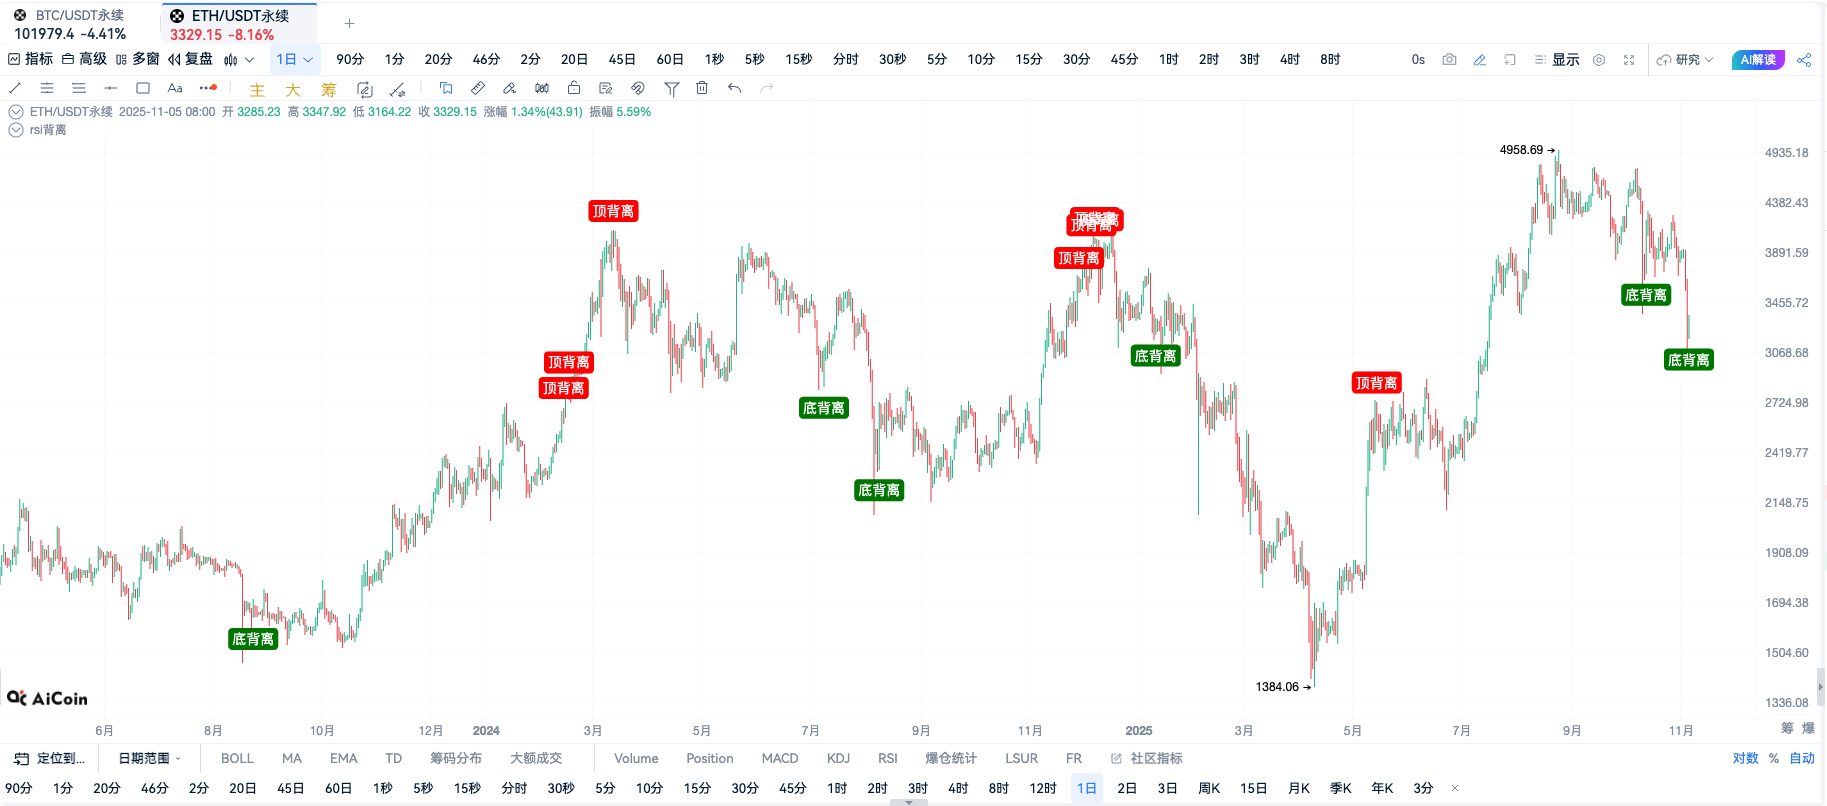
4. Custom Indicator · Effect of RSI Divergence Signal

(Image: OKX-BTCUSDT Perpetual Contract 1-Day Cycle)

(Image: OKX-ETHUSDT Perpetual Contract 1-Day Cycle)
5. Custom Indicator · Script Source Code
// @version=2
// Create your custom script here
// Number of candlesticks used for divergence check
divergence_check_len = 100
// Bearish divergence monitoring
func_bearish_divergence(src, value) {
maybe_second_peak = value < value[1] and value[1] > value[2]
if (not maybe_second_peak) {
rets = [nan, nan, false]
return false
}
var peak1_idx = 0;
var peak2_idx = 0;
for (i=0; i
if (value[i+1] > value[peak2_idx]) {
if (value[i+1] > value[peak1_idx]) {
peak2_idx := peak1_idx
peak1_idx := i+1
} else {
peak2_idx := i+1
}
}
}
}
if peak1_idx == peak2_idx {
rets = [nan, nan, false]
return false
}
src_peak1 = src[peak1_idx]
src_peak2 = src[peak2_idx]
value_peak1 = value[peak1_idx]
value_peak2 = value[peak2_idx]
result = src_peak1 < src_peak2 and value_peak1 > value_peak2 and peak2_idx == 1
// rets = [peak1_idx, peak2_idx, result]
return result
}
// Bullish divergence monitoring
func_bullish_divergence(src, value) {
maybe_second_peak = value > value[1] and value[1] < value[2]
if (not maybe_second_peak) {
rets = [nan, nan, false]
return false
}
var peak1_idx = 0;
var peak2_idx = 0;
for (i=0; i
if (value[i+1] < value[peak2_idx]) {
if (value[i+1] < value[peak1_idx]) {
peak2_idx := peak1_idx
peak1_idx := i+1
} else {
peak2_idx := i+1
}
}
}
}
if peak1_idx == peak2_idx {
rets = [nan, nan, false]
return false
}
src_peak1 = src[peak1_idx]
src_peak2 = src[peak2_idx]
value_peak1 = value[peak1_idx]
value_peak2 = value[peak2_idx]
result = src_peak1 > src_peak2 and value_peak1 < value_peak2 and peak2_idx == 1
// rets = [peak1_idx, peak2_idx, result]
return result
}
rsi12 = rsi(close, 12);
isbearishdivergence = funcbearishdivergence(close, rsi12)
plotText(isbearishdivergence, title='Top Divergence', text='Top Divergence', refSeries=high, bgColor='red', color='white', fontSize=14, placement='top', display=true);
isbullishdivergence = funcbullishdivergence(close, rsi12)
plotText(isbullishdivergence, title='Bottom Divergence', text='Bottom Divergence', refSeries=low, bgColor='green', color='white', fontSize=14, placement='bottom', display=true);
6. Summary and Insights
Recommended Scenarios
The RSI indicator is most suitable for use in trending markets or environments with clear trends, effectively assisting investors in predicting market trend states and potential reversal signals.
For slow-moving or range-bound markets, it is advisable to combine the RSI with other technical indicators (such as MACD, moving averages, or support and resistance levels) for verification and adjustment to enhance accuracy. Especially in short-term trading and trend reversal judgments, RSI divergence signals are highly valuable, but one should avoid making erroneous decisions based solely on a single indicator in a choppy market.
Risk Management Recommendations
It is not advisable to rely solely on RSI divergence signals for frequent trading in range-bound markets without a clear trend; one can differentiate between potential strong and weak signals by observing the time frame of the signals, thereby avoiding chasing small reversals or false moves.
When executing trades, strict stop-loss levels should be set, and the allocation of funds should be appropriate, such as controlling positions at 5%-10%, to minimize potential risks from market volatility on the account.
In Summary
From the perspective of actual trading effectiveness, the RSI indicator possesses a certain level of reliability in predicting trend reversals, especially as bottom divergence can effectively signal potential upward opportunities, while top divergence signals are generally suitable for alerting to market downside risks. However, in choppy markets or when trends are unclear, relying solely on the RSI indicator may lead to decreased withdrawal rates or signal accuracy. Therefore, it is recommended to use it in conjunction with other technical analysis tools, such as MACD, moving averages, or fundamental research, to further improve trading success rates and decision robustness.
Join our community to discuss and become stronger together!
Official Telegram community: t.me/aicoincn
AiCoin Chinese Twitter: https://x.com/AiCoinzh
Group Chat - Wealth Group:
https://www.aicoin.com/link/chat?cid=10013
免责声明:本文章仅代表作者个人观点,不代表本平台的立场和观点。本文章仅供信息分享,不构成对任何人的任何投资建议。用户与作者之间的任何争议,与本平台无关。如网页中刊载的文章或图片涉及侵权,请提供相关的权利证明和身份证明发送邮件到support@aicoin.com,本平台相关工作人员将会进行核查。


