Today is Thursday, November 6th. Yesterday, we laid out several long positions in Ethereum, and we basically profited.
Especially the longs around 3270-3280 were quite profitable. The most precise target we set for everyone was 3450.
Today, I will provide a real-time analysis of the market. First, the reason we went long yesterday was that the 6-hour TD indicator showed a bottoming signal. Simultaneously, Bitcoin's 6-hour and 4-hour charts also showed bottoming signals, and Bitcoin's price just happened to touch the support level at that point. Therefore, I judged that yesterday's market should see a rally, likely reaching around 104,000. Although Ethereum did not show a bottoming signal on the 4-hour level, it did touch the support level during this month’s mid-line pullback, so I judged that it should primarily rebound in the short term.
As expected, yesterday the price surged from around 3000 and 3300 to about 3480 before pulling back. So why did the price retreat at these key levels?
Today, I will summarize for you. First, when judging this wave of bullishness yesterday, we needed to observe the moving average resistance and breakout situation in the 30-minute timeframe.
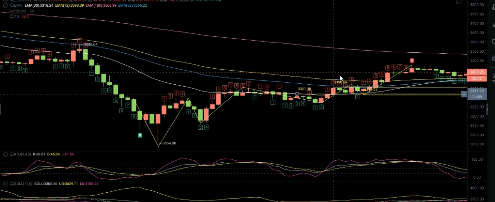
At that time, since I was bullish on the overall direction, I leaned towards an upward breakout in the 30-minute oscillating market. That’s why I laid out long positions at 3270 and 3280.
The stop-loss was set at 3250, and the final result was as expected. After the price firmly stood above the 30-minute moving average, it first touched 3360, while the 30-minute moving average was originally in a resistance state.
Now, it has turned from resistance to support, which is why the price pulled back to 3316 before experiencing this wave of rebound. After the price broke through the 30-minute moving average, it was first resisted by the hourly moving average at 3373, but it did not create a new low.
After reaching a second low, it again created a new high. Therefore, we should lay out short-term long positions around 3340 and 3330, with a stop-loss at 3310.
The area that did not break in the past has now formed an effective support level. After breaking through on the hourly level, it eventually touched the upper 56 moving average resistance, and after the hourly TD indicator showed a top signal, a pullback occurred.
Currently, the price is actually oscillating between the support on the hourly level and the moving average resistance on the two-hour level.
Ultimately, we are still more inclined to observe the breakout situation of the upper two-hour moving average. If it breaks through, the next step should be a pullback to the 3-hour and 4-hour moving average levels. Therefore, if we short, we should prepare to short around 3550-3570, while for long positions below, our layout is relatively dense, focusing on low longs. The current price of Ethereum is around 3424, and the price is constrained in the 15-minute range between 3380-3430, with the upper stop-loss at 3450 and the lower stop-loss at 3360. The trend is bullish, so today we are looking at positions around 3380 and 3390. If the price breaks below 3360, it will continue a small-level bearish trend down to around 3330, which aligns with what we just mentioned about the support on the 30-minute and hourly levels. We are primarily focusing on low longs, so I have set up some small-level long positions below, with the final target today being around 3550. If we short between 3530-3550, we should lay out at around 3550, with a stop-loss at 3590. If the price breaks through 3590, it means that the 6-hour level has stabilized above its mid-line. If it stabilizes after 12 o'clock, this 6-hour mid-line will continue the bullish trend. Ultimately, it may break through 3590 to reach around 3650-3660. This is our real-time layout for Ethereum today.
For more strategies, follow BTC-ETH crypto.

免责声明:本文章仅代表作者个人观点,不代表本平台的立场和观点。本文章仅供信息分享,不构成对任何人的任何投资建议。用户与作者之间的任何争议,与本平台无关。如网页中刊载的文章或图片涉及侵权,请提供相关的权利证明和身份证明发送邮件到support@aicoin.com,本平台相关工作人员将会进行核查。


