Today is November 4th, let's take a look at today's market.
First, let's focus on Bitcoin. From the daily chart perspective, it is clear that the bears are very strong. Yesterday, there was a drop of nearly 5 points, and many altcoins also suffered significant declines. Therefore, when Bitcoin drops by 5 points, altcoins typically drop by at least 10 to 20 points.
So, we must pay attention to the risks. Now, looking at today's market, Bitcoin reached a low of 105,300 yesterday, and it has found effective support, showing a temporary small rebound. Combining this with the 4-hour chart, it appears to be a small bottom, indicating a halt in the decline, so this is what we need to focus on.
The first level to watch is 108,100. Can it break this level? If it can break through, where will the continuous bullish trend go? The upper levels are 109,700 and 110,700.
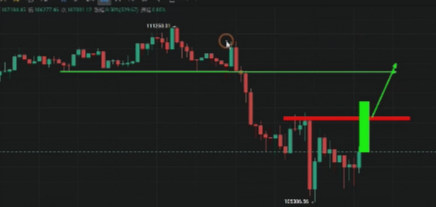
These two levels are where the market could go if it breaks through 108,100 and continues to trend upwards.
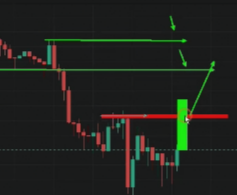
If 108,100 and 108,400 cannot be broken, then the bearish trend will continue, and new lows will be created.
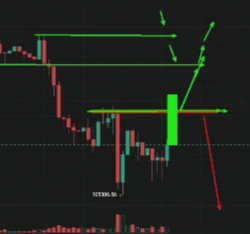
After all, the daily chart shows that the bears are very strong, and this is just a small cycle of rebound. So, when we face these important resistance levels, if they break, we should consider going long on a pullback.
Go long until the next resistance level, and then try to short again. If the next resistance level breaks again, continue to go long. Keep going long until it faces the top level, which indicates a V-shaped reversal.
The way it came down is the way it will go back up, so the visible resistance levels are just a few: the first is 108,100-108,400.
This is the first resistance range, the second is 109,700, and the third is 110,700. So, if these resistance levels break one by one, it clearly indicates a V-shaped reversal structure. The way it went down is the way it will come back up.
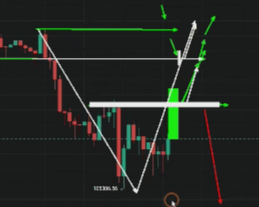
If none of the resistance levels can be broken, there is no doubt that the bearish trend will continue. Therefore, during such times, one must have a certain level of flexibility in trading. For a qualified trader, this flexibility is the most basic common sense.
As long as we encounter resistance, if it can break through, there is clearly more room above. If the resistance cannot be broken, the bearish trend can continue. This is the direction for Bitcoin, so the entry points are very clear and obvious.
If 105,300 breaks down again, the first level we will face below, looking at the 4-hour chart, is 103,500. This means that the way it went up is the way it will come down, and the overall pattern is very clear.
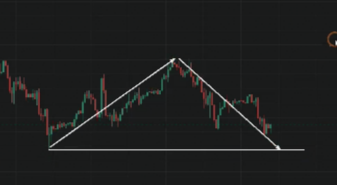
Since the resistance cannot be broken, we must pull back and continue to seek the bottom. For Ethereum, the situation is similar. On the hourly chart, there are four pins testing the bottom, clearly indicating that this wave is currently a bullish trend. The visible resistance levels are 3670 and 3680, which are the first resistance levels we need to watch for a potential breakout to continue the bullish trend.
If this resistance level continues to break, where will the bullish trend extend to? The key level is still at 3,740 from last night. As long as 3,740 cannot be broken, we will have to turn back and continue the bearish trend.
So, this level can be tested for a short position with a stop loss at 3,770. If 3,740 breaks again, we will have to go long, targeting the upper level of 3,837. The place where it broke yesterday at 3,837 is clearly not a short position. Once 3,740 breaks, we cannot short anymore.
We can only wait for the position to go long because after the first small cycle of V-shaped reversal bottom forms, we will continue to go long on the pullbacks. 3,837 is at most just a small resistance, but it is not a short position. If it pulls back slightly, it may break 3,915, which means if the first resistance levels of 3670 and 3680 break, and the second level of 3,740-3,760 also breaks, it clearly indicates that the bullish trend is back.
Yesterday's high of 3,915 dropped back to 3,556, and the next trend is from 3,556 back up to 3,915, indicating that the V-shaped reversal structure has emerged. The overall pattern is very clear and obvious.
The operable points are just a few: the first is 3670, 3,670-3,680 as the first resistance level, the second is 3,740 as the short position, strictly speaking, the 3,740-3,760 range is the short position. 3,770 serves as the stop loss. Once this level breaks, we will continue to go long, targeting 3,910, which indicates a V reversal.
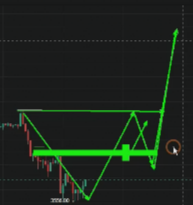
After the V reversal, once the bottom forms, it will definitely continue to pull back and go long, making the direction even clearer. Pullbacks will lead to further buying opportunities.
For more trend points, follow the public account BTC-ETH Crypto.

免责声明:本文章仅代表作者个人观点,不代表本平台的立场和观点。本文章仅供信息分享,不构成对任何人的任何投资建议。用户与作者之间的任何争议,与本平台无关。如网页中刊载的文章或图片涉及侵权,请提供相关的权利证明和身份证明发送邮件到support@aicoin.com,本平台相关工作人员将会进行核查。


