Intense selling pressure has been applied to Bitcoin as the market responds to a sharp 400% increase in trading volume, which is usually a sign of structural weakness and a prelude to volatility. Bitcoin had developed a strong bullish structure over the previous few weeks, emerging from a protracted consolidation zone and rising in the direction of $122,000.
However, that rally was abruptly rejected close to local highs, and then there was a steep sell-off. Bitcoin is currently trading at about $115,700, down more than 5% from its most recent peak. It has cut below the rising support trendline and is in danger of a more significant decline. The sharp increase in volume during this decline strongly suggests distribution rather than robust market activity, even though the price is still above the 50-day EMA ($114,945).
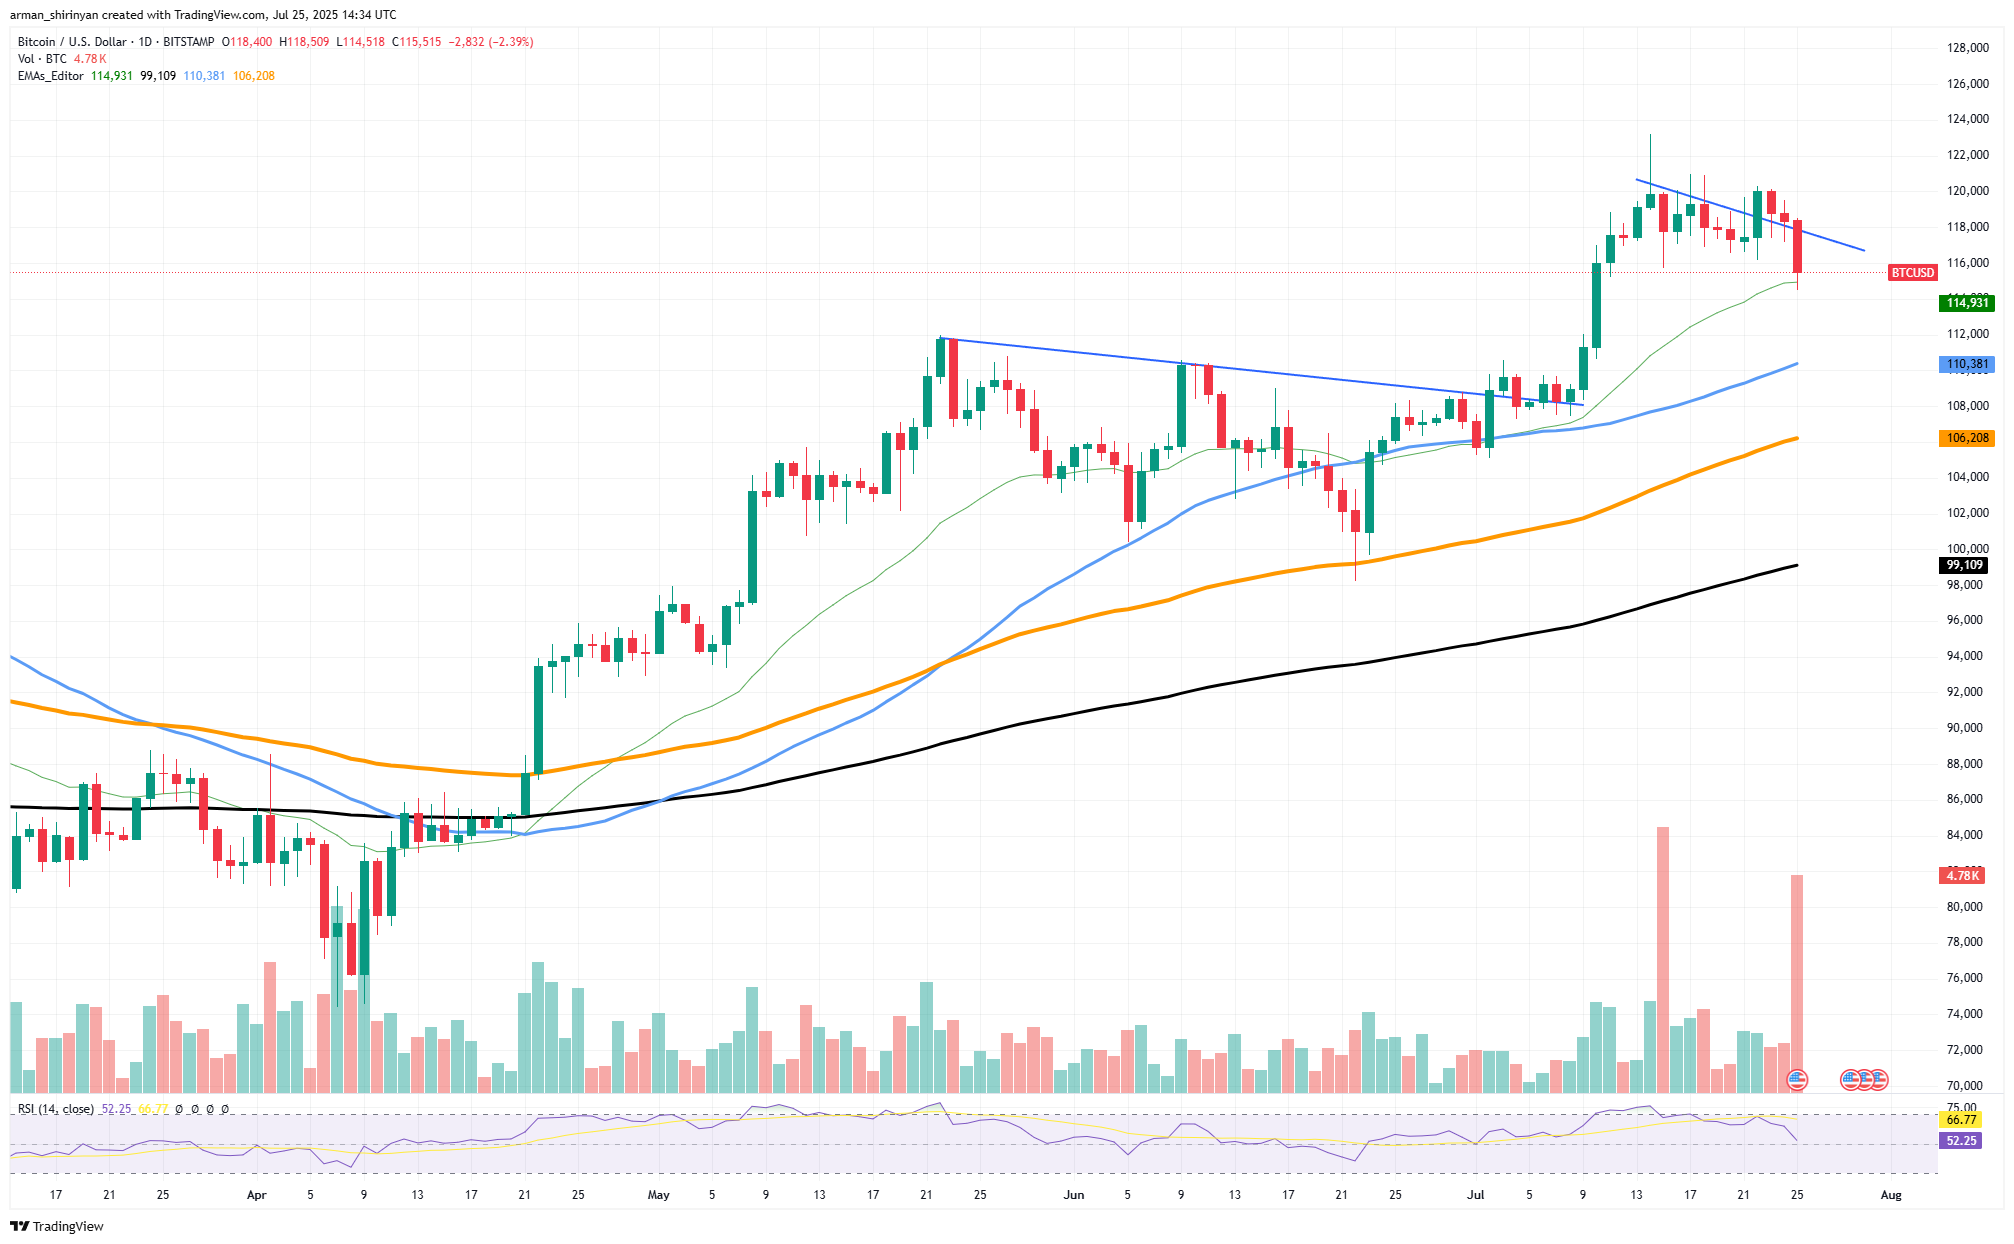
BTC/USDT Chart by TradingView
The Relative Strength Index (RSI), which is neutral but declining at 52.80, shows that momentum is waning. Despite its impressiveness, the volume spike raises concerns when it coincides with price weakness rather than strength. During an uptrend, volume increases indicate conviction. It frequently indicates forced liquidation or panic exits if it breaks out during a correction.
HOT Stories Bitcoin (BTC): 400% Surge There, XRP: Price Turnaround Incoming? Ethereum (ETH): Dominance Ensured New XRP Margin Pair Available on Major US Exchange Ripple's Larsen Might Be Just Starting After $200 Million XRP Selling Spree, Analyst Says Top Trader: Bitcoin Has Not Bottomed Yet
In terms of structure, Bitcoin can still decline to the 100-day EMA ($110,385) or even the 200-day EMA ($106,211) without causing the bull market as a whole to falter. However, this latest move calls into question the short-term bullish continuity. For the time being, Bitcoin is still in a tumultuous state, torn between short-term uncertainty and long-term optimism.
Caution is advised until buyers clearly reengage and Bitcoin regains the upper trendline. A breakdown was caused by that 400% volume explosion rather than a breakout. Bitcoin might also experience more pain before the next leg up unless volume slows down or reverses with price recovery.
XRP takes hit
XRP is currently experiencing its first significant correction following a huge parabolic run that sent the token skyrocketing above the $3.60 mark. With multiple red candles in a row, the price has retraced to about $3.10. However, this move appears more like a healthy cooldown than a collapse in contrast with the impulsive panic selling typical of altcoin cycles.
According to the daily chart, XRP is still above its 21-day EMA ($2.91), which has a track record of providing dependable short-term support during rallies. More significantly, the overall structure is still bullish. The recent spike occurred on a high volume, indicating accumulation as opposed to speculative froth.
You Might Also Like

Fri, 07/25/2025 - 14:22 XRP on Verge of Ultra-Rare Golden Cross vs. Bitcoin: Price History Points to 158% ByGamza Khanzadaev
Additionally, even though that volume is decreasing, it is not completely vanishing, suggesting that buyers have not given up. Resetting momentum without breaking the trend, the RSI is currently at 59 after falling out of overbought territory. With this reset, the market has a chance to stabilize before a subsequent leg. The $2.90 to $3.00 range is the crucial level to keep an eye on going forward.
A new base for a breakout could be formed if XRP keeps consolidating above this support band. A more significant retracement into the previous range would be indicated by a drop below the 50-day EMA at $2.49. As of right now, the correction is contained and in order. Such a measured pullback is often followed by price turnarounds.
As long as sellers are completely depleted and buyers regain confidence, XRP appears poised for another surge based on the underlying strength in recent volume, moving average support and RSI behavior. If important supports hold, there may be a bullish reversal before August, but expect short-term sideways movement.
Ethereum stays dominant
Ethereum's defiance of market gravity has persisted. ETH soared past the $3,800 mark, marking a near-vertical move that solidifies its current dominance in the crypto space, while Bitcoin and other major altcoins displayed signs of exhaustion or entered corrective phases. The context is just as striking as the price performance.
Despite pullbacks, low-volume rotations and consolidations on the larger cryptocurrency market, Ethereum was able to decisively overcome resistance levels. A robust breakout from months of range-bound trading above the $3,200-$3,300 band, followed by steady green candles and increasing volume, is evident in the daily chart. Alongside the spike, the RSI broke into overbought territory and is currently trading close to 77, which is a sign of strength rather than exhaustion — especially when supported by a healthy volume inflow.
You Might Also Like

Fri, 07/25/2025 - 10:13 Ripple CTO Issues Crucial Instagram Warning for XRP Holders: Here's Why ByTomiwabold Olajide
The moving average stack is still completely optimistic. At a comfortable $3,210, the 21-day EMA is serving as a possible short-term support. Deeper safety nets are provided below that by the 50- and 100-day EMAs, which are located at about $2,800 and $2,680, respectively. The upward trend will continue as long as the price stays within these ranges.
Ethereum may regain its hegemony in both price and mindshare if this departure from the market persists. The next market to keep an eye on is the ETH/BTC pair; any significant movement there would validate a larger capital shift in favor of Ethereum.
免责声明:本文章仅代表作者个人观点,不代表本平台的立场和观点。本文章仅供信息分享,不构成对任何人的任何投资建议。用户与作者之间的任何争议,与本平台无关。如网页中刊载的文章或图片涉及侵权,请提供相关的权利证明和身份证明发送邮件到support@aicoin.com,本平台相关工作人员将会进行核查。


