Life is about the process, just as life is about growth. Simplicity is not tasteless, but the true flavor of life; simplicity is not without desire, but rather the essence of life itself. Majestic mountains can offer us wonder, but the fragrance of rice and waves of wheat on the plains can satisfy our true needs. Any brilliant life will find tranquility in peaceful memories!
It should be considered that the anticipated downward trend has finally gained some momentum. The market maintained a fluctuating operation yesterday, and then started to decline from the high point of 119,000 in the early morning. As of now, the low point has reached around 115,000, with a pullback of 4,000 points. If you read the analysis in yesterday's article, you would have had some foresight about the current market situation. We also chose to short in the short term, primarily around 118,500. The pullback expectation has been fulfilled, aligning with our predicted level of around 115,000, which accurately hit the target position. So congratulations to those who followed the short position and successfully profited. Moreover, with the market's decline, our prediction of going long after clearing the bullish positions below has also provided an entry point, validating our operational strategy very well. Overall, remember to plan your short-term trades without losing sight of the bigger picture.
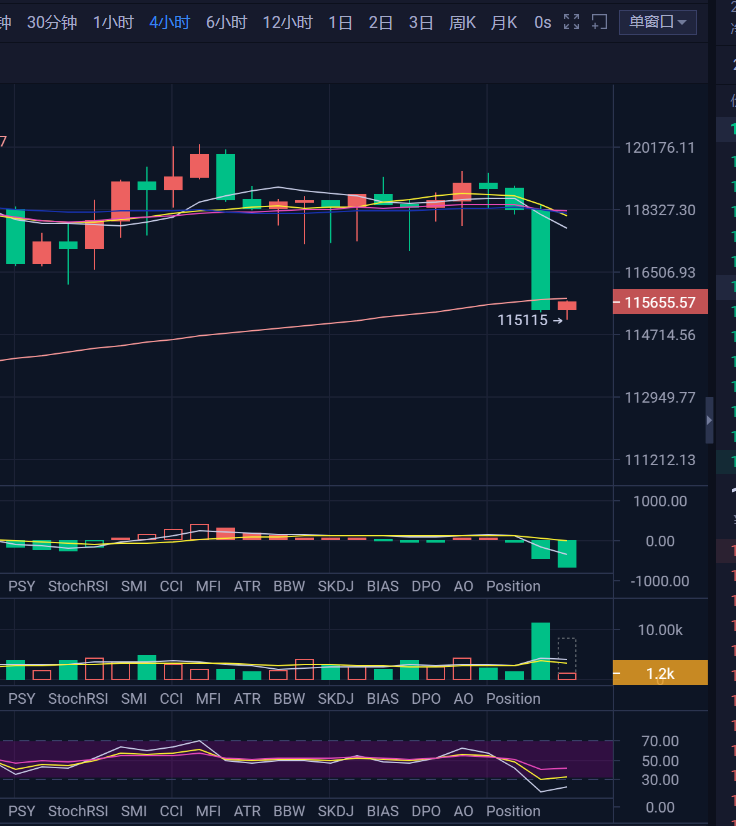
Returning to today's market, after a wave of fluctuations, a pullback has occurred, just as we expected, completing the liquidity clearance of the short-term bullish positions below. Yesterday, we emphasized that amidst the fluctuations, there was a clear increase in bullish liquidity below, which was distributed in a multi-layered high concentration manner. Therefore, our analysis yesterday indicated that it was most appropriate to clear the bullish liquidity downward. Today, the market's lowest point reached around 115,100. During the decline, due to the increase in bullish liquidity and the reopening of positions, there is still some residual bullish liquidity below, with the clearance position around 114,200. Meanwhile, new short positions have been added, with short-term high leverage bearish liquidity around 116,800, and high concentration bearish liquidity above 120,000. Currently, it is important to note whether the market intends to continue clearing the remaining bullish positions downward or first shake off the high leverage shorts above amidst the fluctuations. It will depend on the market's subsequent movements. It is also worth noting that the continuous decrease in spot premiums indicates that there has been ongoing selling pressure from the spot market, and the trend has not yet reached its end.
On the technical front, the daily candlestick from yesterday closed as a bearish doji under the pressure of bears, leading to a pullback today. In the short term, the daily chart has also entered an adjustment cycle, with the MA7 line crossing below the MA14 line, forming a small-scale death cross. In terms of market structure, the market has given a new low amidst high-level fluctuations, so the current daily chart's movement aligns with our earlier emphasis on completing a pullback within the fluctuations. On the technical indicators, MACD is operating in the initial bearish cycle, and RSI is diverging downward, gradually approaching the lower levels, with current daily support around 113,300.
On the four-hour level, a pullback structure has begun, with the last candlestick forming a large bearish entity. Such a candlestick is unlikely to represent a low point. Generally, when a large entity candlestick appears, there tends to be a continuation of the market. Therefore, at this price level, regardless of whether the market directly tests lower again or fluctuates before testing lower, we believe it is unlikely that this will be the low point of the current pullback. RSI is in the oversold zone at a low level, and if there is another decline, it will likely complete the clearance of the remaining bullish liquidity, followed by an indicator recovery. If it fluctuates and recovers first, it may lead to a lower low for the subsequent bullish clearance, as new bullish positions will definitely increase during the fluctuations.
In terms of operations, based on the market analysis, if the market tests lower again, we can consider going long around 114,000 for a rebound. If it first fluctuates and rises, we will look to short around 116,800.
Ethereum's decline today is performing better than Bitcoin's. At this stage, our operational strategy for Ethereum is still to avoid shorting as much as possible, primarily focusing on long positions. As we mentioned yesterday, Ethereum has had a significant rise previously, so a pullback is quite normal. With continuous funds entering the Ethereum ETF, if there is a sustained net outflow of funds later, it will likely signal the end of the market trend.
【The above analysis and strategies are for reference only. Please bear the risks yourself. The article is subject to review and publication, and market conditions change in real-time. The information may be outdated, and specific operations should follow real-time strategies. Feel free to contact us for market discussions.】

免责声明:本文章仅代表作者个人观点,不代表本平台的立场和观点。本文章仅供信息分享,不构成对任何人的任何投资建议。用户与作者之间的任何争议,与本平台无关。如网页中刊载的文章或图片涉及侵权,请提供相关的权利证明和身份证明发送邮件到support@aicoin.com,本平台相关工作人员将会进行核查。


