
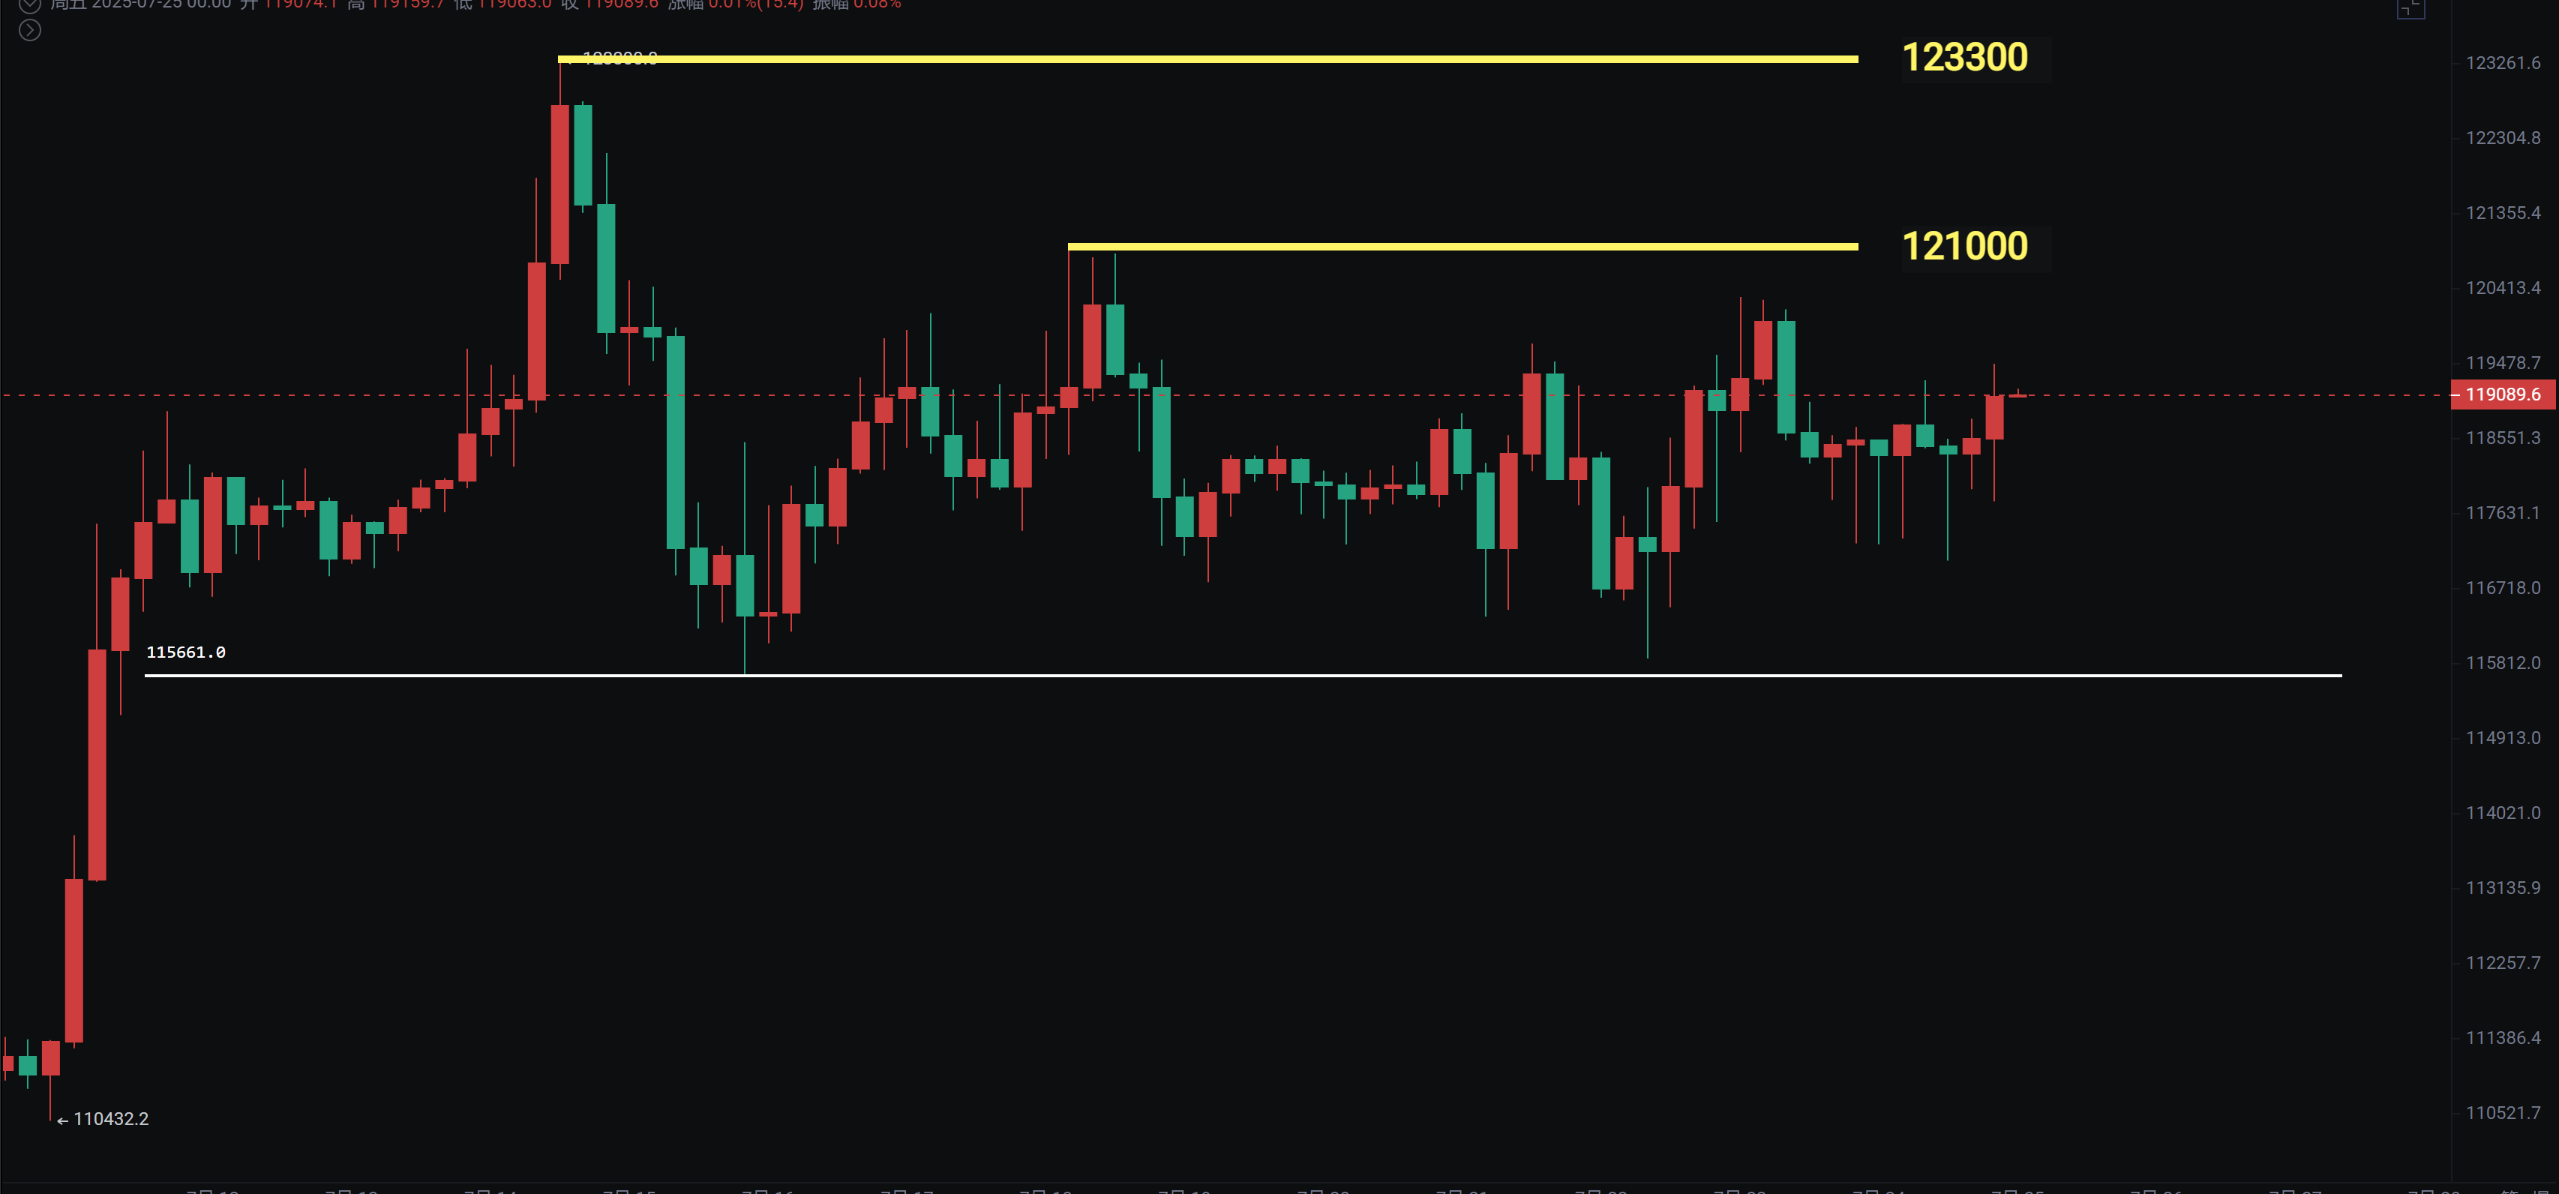
Bitcoin has been in a narrow range of fluctuations for over ten days, and the end of this fluctuation is about to choose a direction. After creating a new high of 123,300, it has been pushed back twice after touching 121,000. The MACD has crossed below the zero line, and if it does not break below around 116,000 for a while, it could be pulled up directly. However, from an indicator perspective, a false breakdown followed by a rise cannot be ruled out.
Regarding Ethereum, we previously warned in our videos and articles not to chase highs. On the 21st, we reminded to reduce positions in Ethereum and altcoins. It has now corrected, although the decline is not significant, some altcoins have dropped by 10 to 20 points.
Gold has once again shown a false breakout, maintaining high-level fluctuations, which increases the risk continuously. After a short-term rebound, the US dollar index continues to decline, and the offshore RMB exchange rate has fallen to 7.15. In this exchange rate game, the Eastern rabbit has won decisively, so we have recently seen the A-shares break through 3600.
Bitcoin
Bitcoin is fluctuating and adjusting within the range of 116,000 to 121,000. The adjustment has lasted about a week and is nearing its end, so it could give a direction at any time.
In terms of moving averages, the 1-hour EMA60 and EMA90 are basically flat, indicating that the forces of bulls and bears are relatively balanced in the short term, with neither side holding an absolute advantage, reflected in the K-line as up and down fluctuations.
The daily MACD has been below the zero line for the fourth day, with the fast and slow lines crossing, and the RSI continuing to turn down, forming a divergence with the K-line. However, the price has remained stable above 116,000, so we should pay attention to whether there will be a rebound after a breakdown. The second scenario is that if it maintains above 106,000 and the MACD returns to the zero line, there is a chance for a direct rise.
Support:
Resistance:
Ethereum
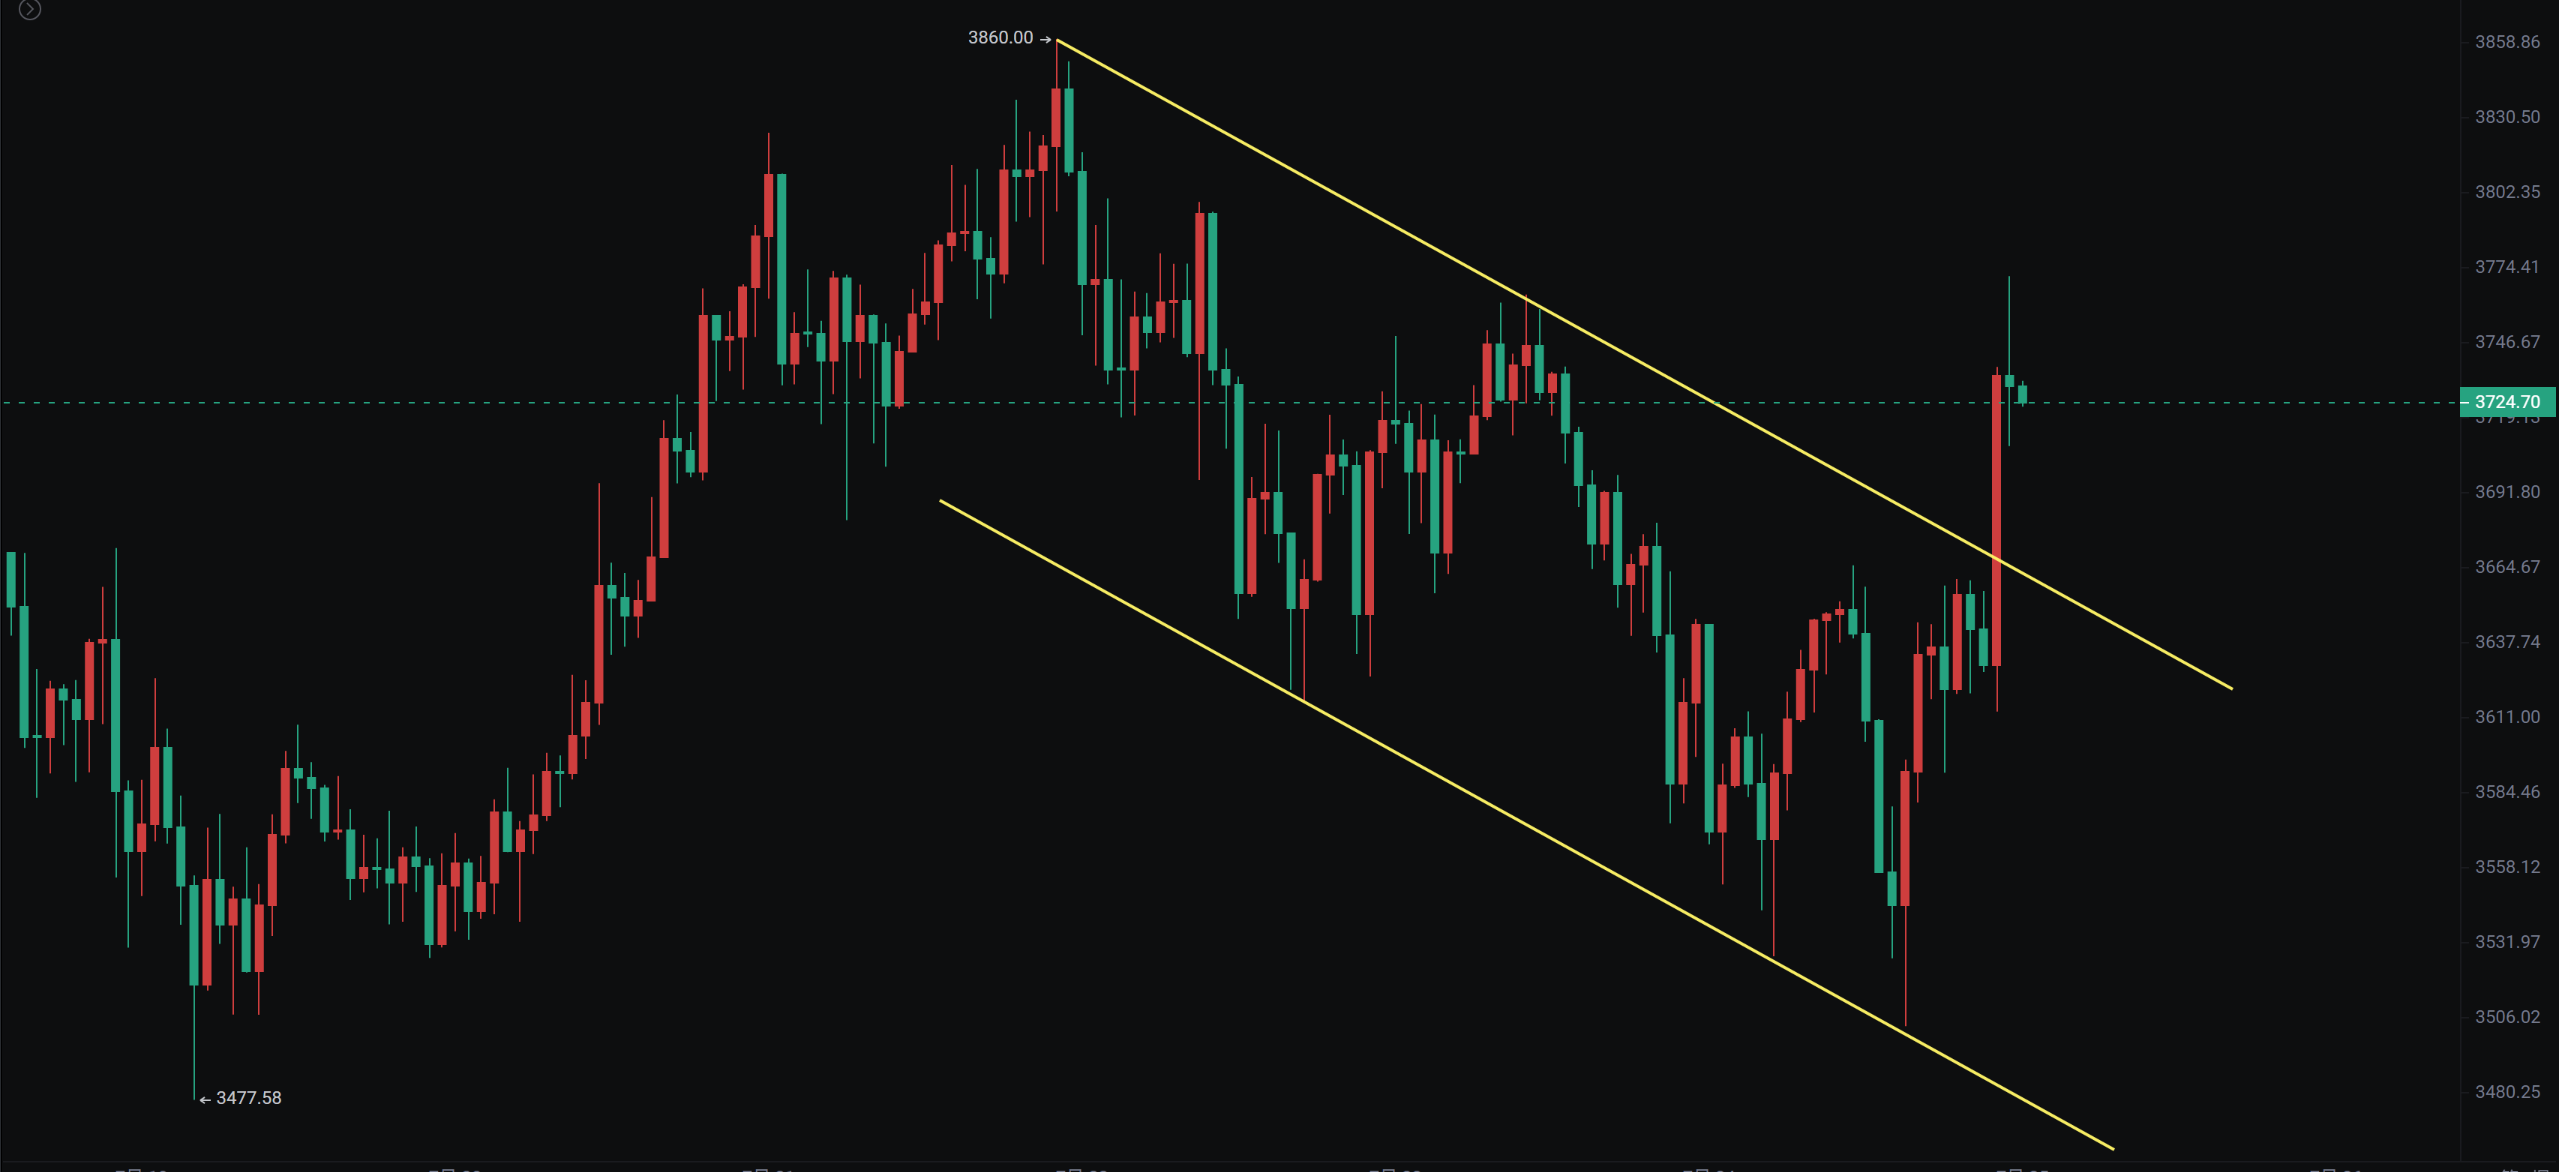
During the previous continuous stretch, I reminded not to chase the rise. On the 21st, I warned about the peak at 3860 before a reminder to reduce positions in altcoins and Ethereum.
The 4-hour and 1-hour charts have formed a descending channel. We will focus on the breakout of this channel. For now, the decline does not seem to be over. We patiently wait for an opportunity to add positions. If there is a good correction, there is still a chance to push towards 4000 to 4100, or even higher, while altcoins will face a rebound from oversold conditions.
Support:
Resistance:
If you like my views, please like, comment, and share. Let's navigate through the bull and bear markets together!!!
The article is time-sensitive and for reference only, updated in real-time.
Focusing on K-line technical research, sharing global investment opportunities. Official account: BTC Trading Master Fusu

免责声明:本文章仅代表作者个人观点,不代表本平台的立场和观点。本文章仅供信息分享,不构成对任何人的任何投资建议。用户与作者之间的任何争议,与本平台无关。如网页中刊载的文章或图片涉及侵权,请提供相关的权利证明和身份证明发送邮件到support@aicoin.com,本平台相关工作人员将会进行核查。


