
Ethereum continues to rise, currently reaching 3768, very close to the previous high of around 4100. My perspective remains the same; the higher it rebounds, the greater the pressure it will face, so I do not recommend chasing the rise. Only consider increasing positions after a pullback or a direct breakthrough of 4100. The weekly chart shows a large bullish candle, and I continue to be bullish on the pullback.
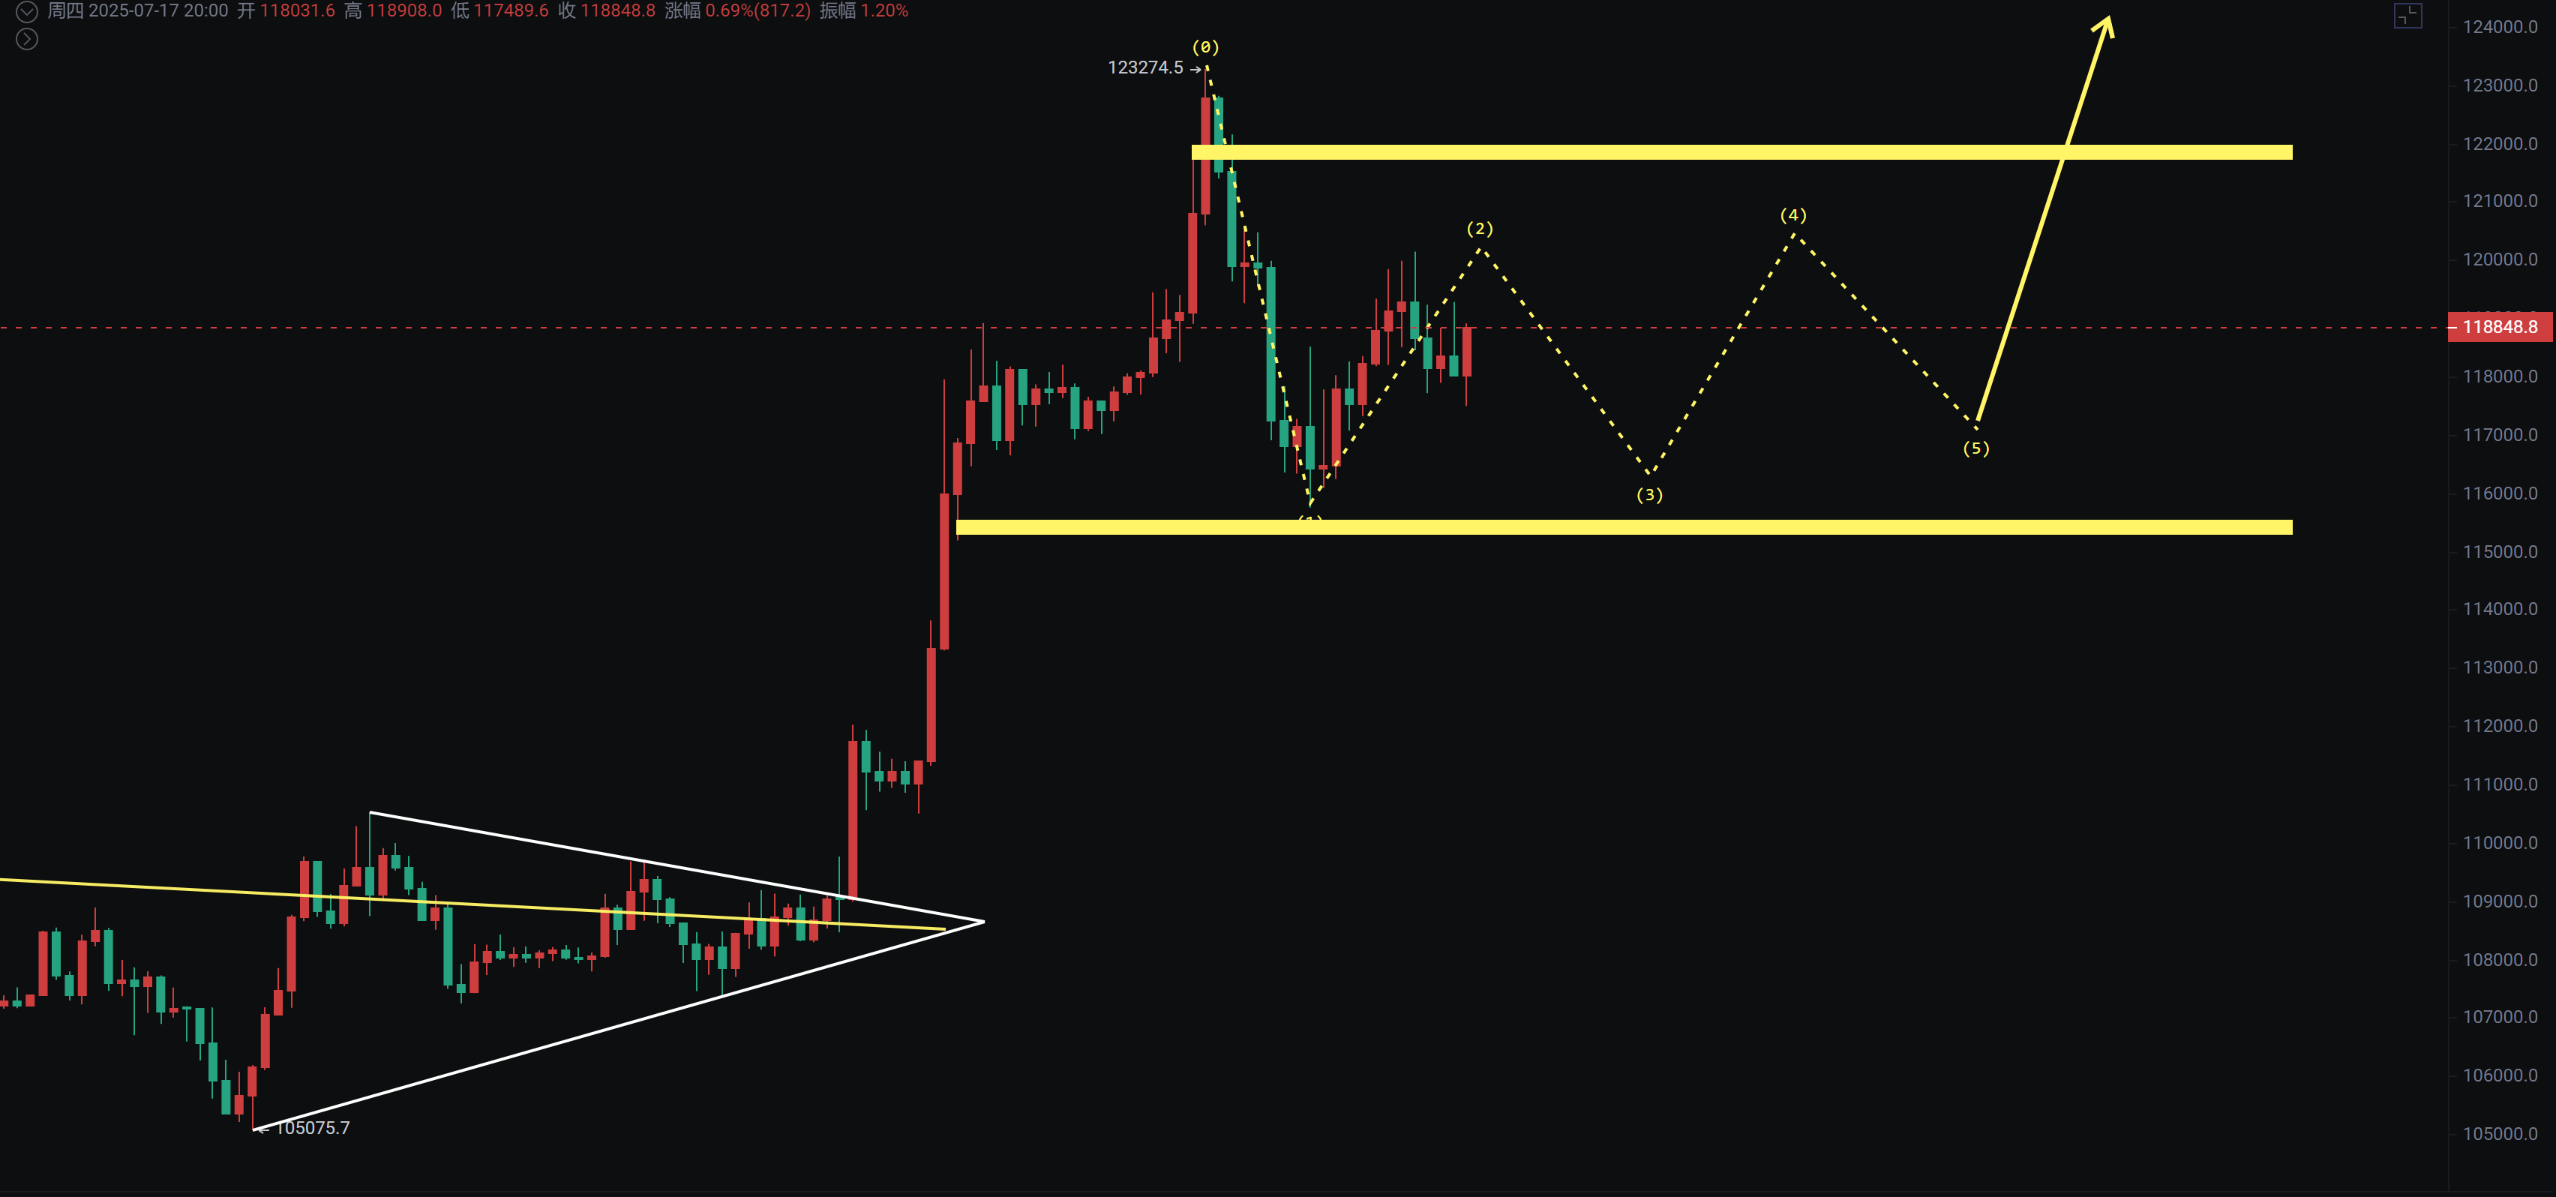
Bitcoin's weekly chart has a high probability of forming a doji star. The daily chart has been fluctuating for six days. I mentioned the pin bar that appeared above 123000. This aligns with my statement about continuous fluctuations at high levels. We will see if it directly breaks through or if it experiences a false breakdown before pulling back.
Bitcoin
Bitcoin has formed a doji star and has broken through the previous high, which aligns with the previous trend, making the probability of continuing to rise quite high. The daily MACD histogram continues to shorten, so pay attention to not crossing below the zero line. From my perspective, a pullback below support and then a return would provide a stronger opportunity to reach new highs, with the target still at 135000.
The 4-hour MACD shows signs of a bullish divergence. We will see how it moves when the market opens next week. As long as the price stays above 112,000, it remains bullish.
Support: 112000 to 115000
Resistance: 121000 to 123274
Ethereum
The weekly chart shows a large bullish candle, with less than eight points to the resistance level of 4100. Therefore, I advised against chasing the rise a couple of days ago. We are waiting for a pullback or a direct breakthrough of 4100 before considering increasing positions. This wave has risen 1.7 times since 1383, and it has nearly increased by 80% in the past month.
From the daily chart, the last two days have seen a volume decrease while rising. If it drops back below 3674 in the short term, we need to consider reducing positions; otherwise, the upward trend remains intact.
Support: 3480 to 3550
Resistance: 4000 to 4100

If you like my views, please like, comment, and share. Let's navigate through the bull and bear markets together!!!
The article is time-sensitive and for reference only, updated in real-time.
Focusing on candlestick technical research, sharing global investment opportunities. Public account: BTC Trading Prince Fusu

免责声明:本文章仅代表作者个人观点,不代表本平台的立场和观点。本文章仅供信息分享,不构成对任何人的任何投资建议。用户与作者之间的任何争议,与本平台无关。如网页中刊载的文章或图片涉及侵权,请提供相关的权利证明和身份证明发送邮件到support@aicoin.com,本平台相关工作人员将会进行核查。


