Overview
The Gate Research Institute has analyzed and summarized the market dynamics and popular airdrop projects from June 24 to July 7, 2025. During this period, the cryptocurrency market continued to oscillate at high levels. Although overall sentiment has not fully warmed up, mid and small-cap tokens have shown impressive performance driven by specific themes. Projects like BONK and REKT have resonated in terms of price and trading volume, reflecting the active short-term speculation of funds; while some tokens, despite increased volume, have stagnated in price, indicating divergent expectations regarding their future performance. The overall market presents a structural pattern of "thematic rotation and mainstream stability," with unusual trading volume remaining an important signal for capturing short-term opportunities.
Against this backdrop, several potential projects have simultaneously launched airdrop activities, including Altius (an emerging data intelligence protocol), Camp Network (modular blockchain infrastructure), ChainOpera (an AI-driven on-chain interaction platform), and Sapien (an on-chain identity and social points platform), all of which have opened task participation portals. This article will briefly introduce the characteristics and participation methods of these projects, assisting users in seizing airdrop benefits and medium to long-term layout opportunities during the market rebound period.
Cryptocurrency Market Overview
According to CoinGecko data, from June 24 to July 7, 2025, the cryptocurrency market maintained a range-bound oscillation, trending towards high-level consolidation. During this period, BTC reached a high of 110,307 USDT, with a range increase of nearly 4%, and has since retreated to around 108,900 USDT, indicating that the market is still in a tug-of-war between bulls and bears. 【1】
On the macro level, Federal Reserve Chairman Jerome Powell recently did not rule out the possibility of a rate cut in July, stating that if it weren't for the recent tariff increases, the Fed might have already initiated rate cuts; he also pointed out that the new round of tariffs is expected to exert pressure on future inflation. The market interprets this as a slightly more flexible attitude from the Fed, with short-term risk appetite warming up.
Additionally, the U.S. Senate passed a key procedural motion for the "Too Big to Fail" bill by a vote of 51 to 49, which was officially signed into law by President Trump on July 4. This bill continues the tax reduction policies of 2017 while adding new tax deduction items such as tips and auto loans, and significantly increases defense and border spending. In the short term, it is expected to boost corporate profits and household income, enhancing the popularity of the stock market and risk assets, thereby driving funds back into mainstream cryptocurrencies like BTC and ETH; however, the resulting expansion of the fiscal deficit and inflationary pressures may also become a concern for subsequent policy tightening.
In terms of regulation, the U.S. "GENIUS Stablecoin Act" has smoothly passed procedural review in the Senate, and the House of Representatives is also accelerating its pace. Republican leaders recently announced that the week of July 14 will be designated as "Cryptocurrency Week," planning to hold concentrated votes on three key digital asset bills, including the "GENIUS Act," the "CLARITY Act," and related bills opposing the introduction of central bank digital currencies (CBDCs). This series of legislative actions indicates that the U.S. Congress is systematically establishing a regulatory framework for digital assets, providing clear compliance pathways for stablecoins, trading platforms, and innovative products.
Overall, the cryptocurrency market is currently in a transitional period where regulation is gradually clarifying and policies are being released intensively. Fund sentiment remains cautious, but structural benefits are continuing to accumulate. With the Fed's attitude becoming more flexible, the approach of "Cryptocurrency Week" legislation, and the ongoing promotion of institutional products like ETFs, the market is expected to welcome a key turning point for sentiment recovery and fund inflow in the second half of the year. In the short term, it is recommended to closely monitor the legislative progress of the three major cryptocurrency bills and the net fund flow changes of mainstream crypto ETFs as important reference indicators for judging market trends.
I. Overview of Price Fluctuations
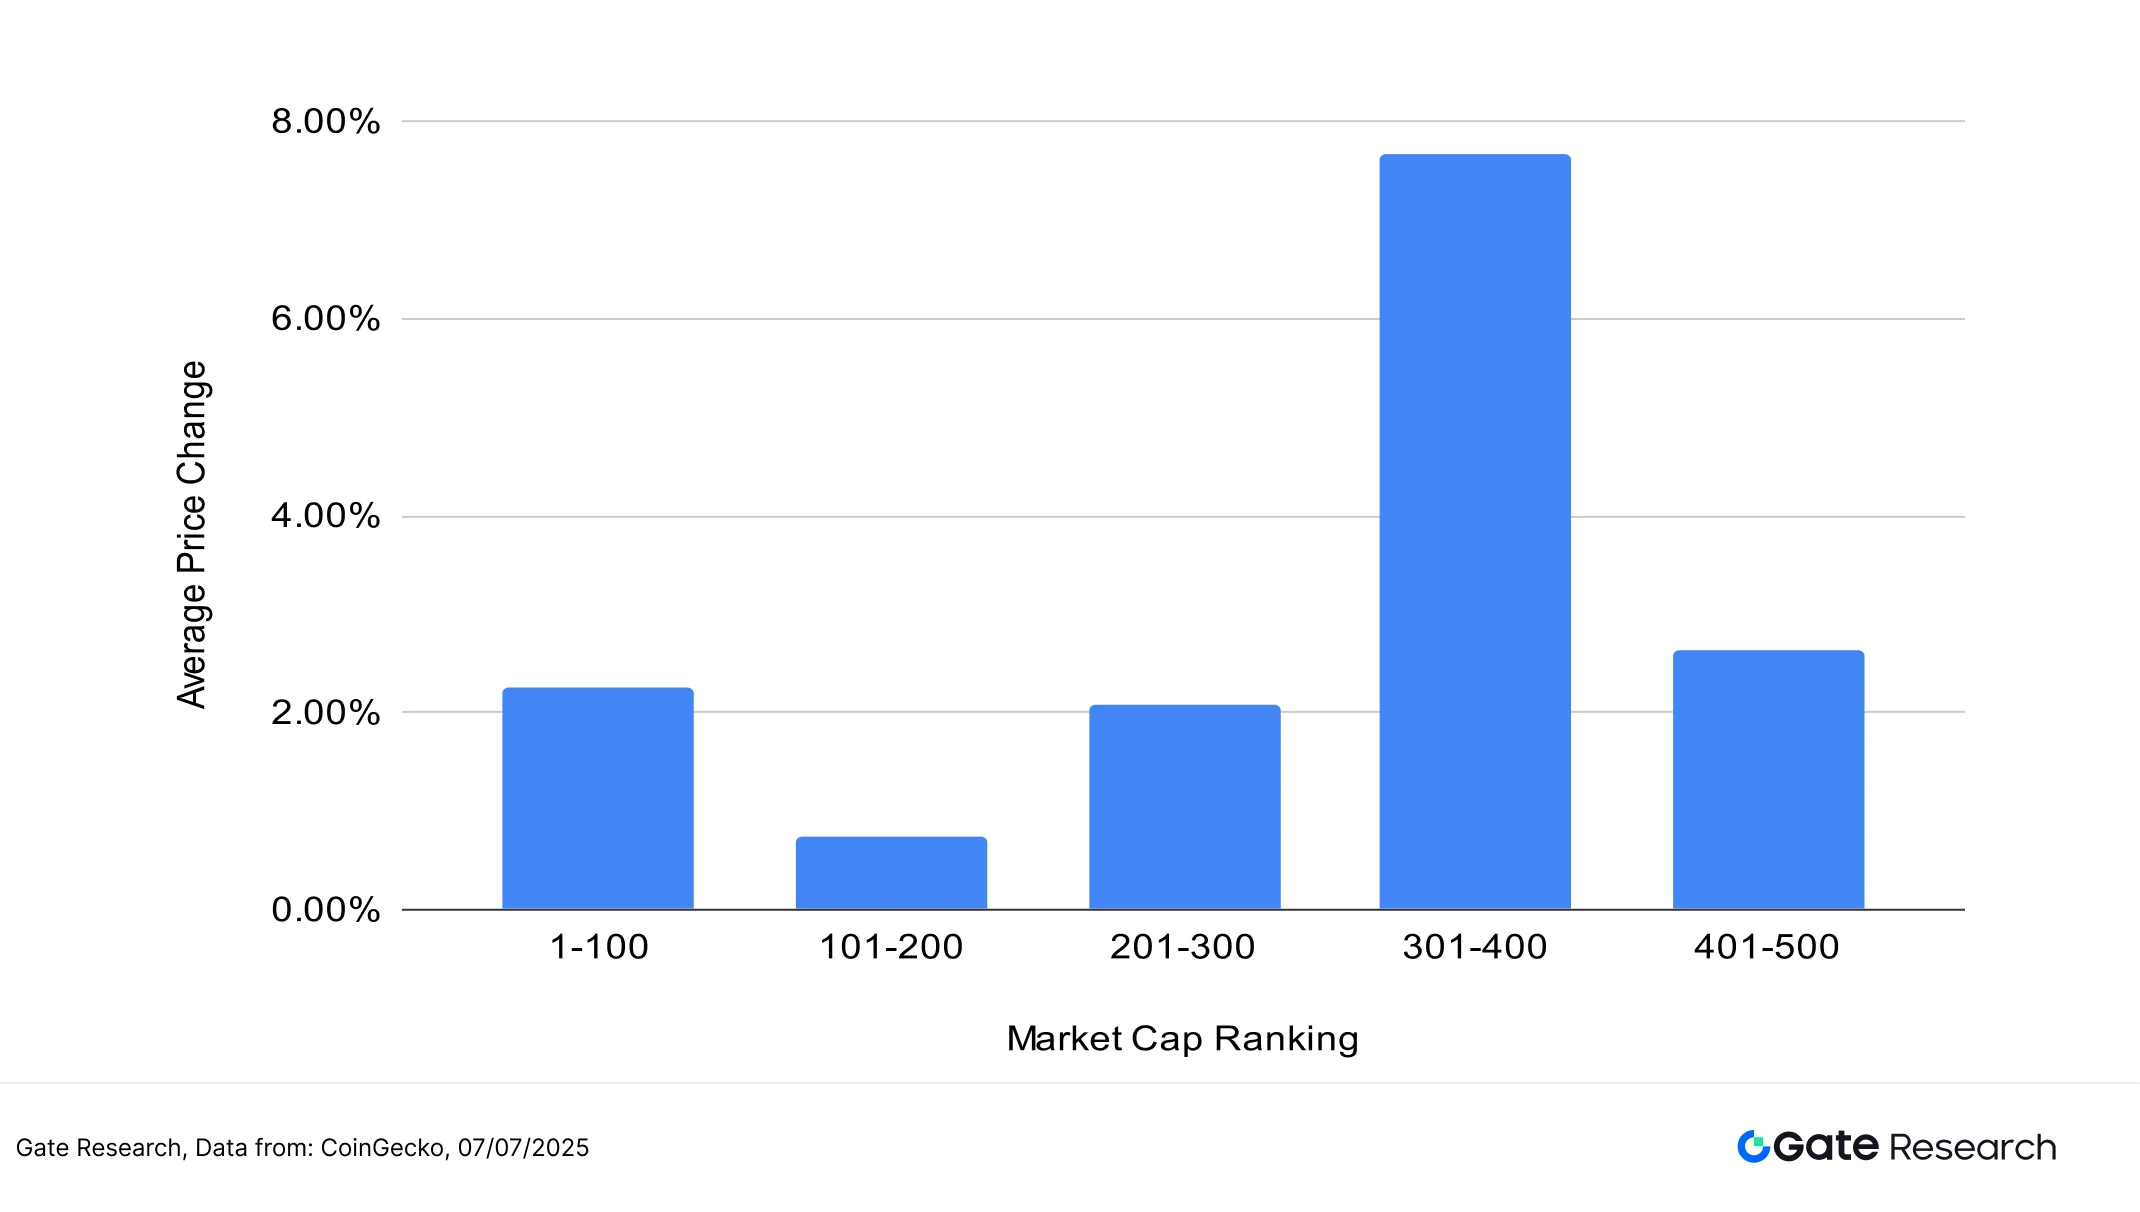
This article groups and analyzes the top 500 tokens by market capitalization, observing the average price increase during the period from June 24 to July 7.
Overall, the market shows a structural rotation pattern, with small-cap tokens generally outperforming large assets, and funds clearly favoring high-volatility targets. Among them, tokens ranked 301–400 in market capitalization performed the best, with an average increase of nearly 8%, far exceeding other ranges, indicating a concentrated influx of funds into mid-tier tokens, driving a phase of market explosion. The next best performers were in the 401–500 range, with an average increase of about 2.7%, also showing solid performance.
In terms of mainstream assets, tokens ranked in the top 100 had an average increase of about 2.2%, maintaining a moderate upward trend, indicating that institutions and stable funds still have a basic allocation willingness. Tokens ranked 201–300 had price increases similar to the top 100, showing neutral performance. In contrast, tokens ranked 101–200 performed the weakest, with an average increase of less than 1%, the lowest among all ranges, indicating a lack of thematic drive and relatively low fund attention in this segment.
Overall, the current market funds show a clear directional preference, with price increases mainly concentrated in specific mid and small-cap ranges, exhibiting characteristics of localized rotation and theme-driven structural rebounds. Although there are signs of warming sentiment, it has not yet fully spread.
Note: The market capitalization distribution is based on CoinGecko data, grouping the top 500 tokens by market capitalization into segments of 100 (e.g., ranks 1–100, 101–200, etc.), calculating the price fluctuations of tokens within each group during the period from June 24 to July 7, and computing the average for each group as the average increase indicator for that market capitalization range. The overall average increase (3.07%) is the unweighted average of the individual increases of the top 500 tokens.
Figure 1: The overall average increase is 3.07%, with the most notable increase in tokens ranked 301–400, averaging nearly 8%.
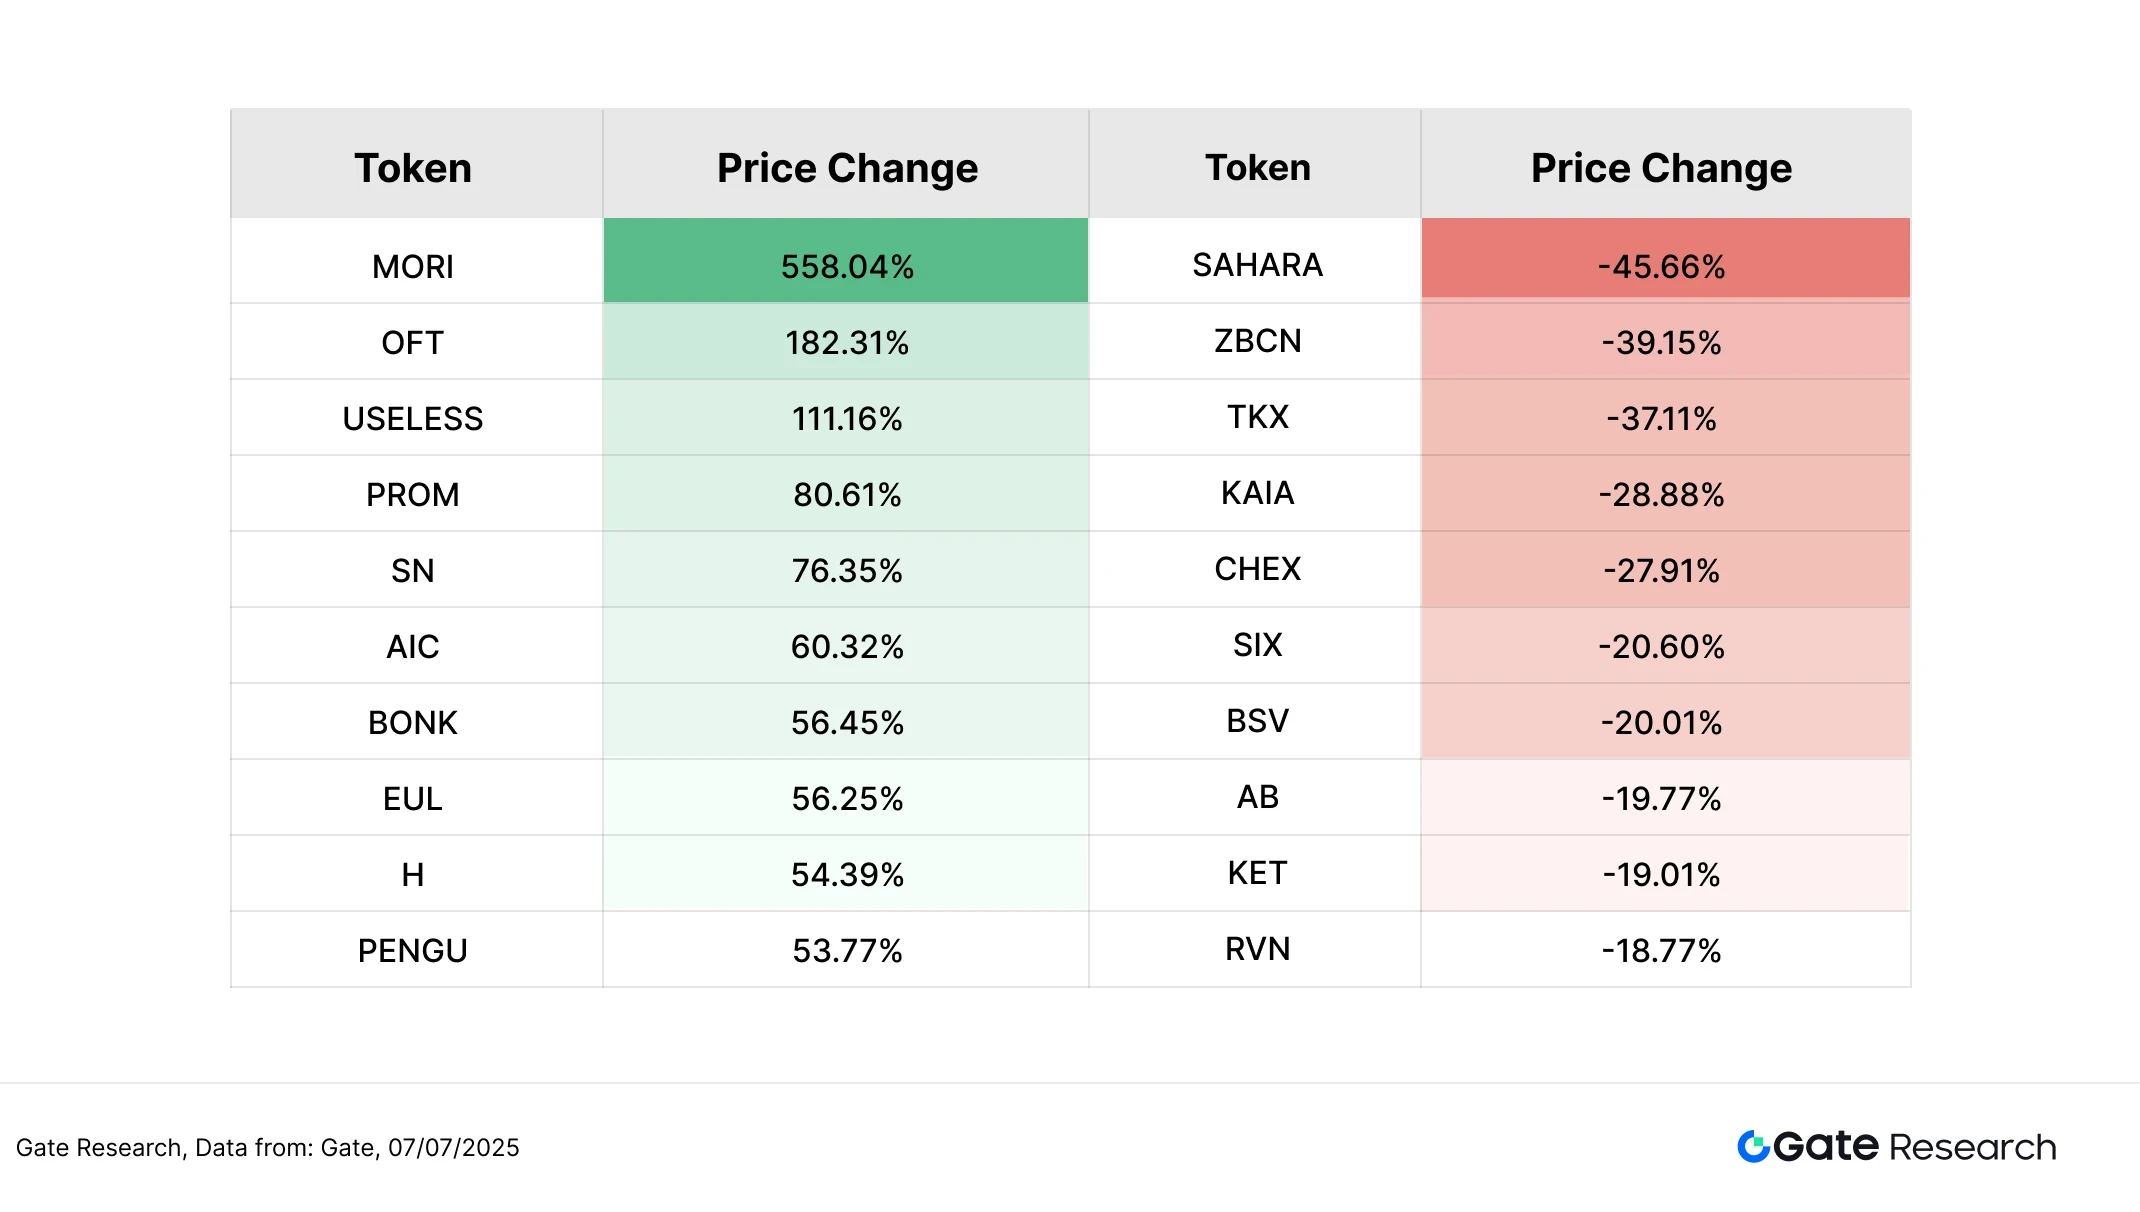
- Top Gainers and Losers
In the past two weeks, the cryptocurrency market has maintained an oscillating consolidation pattern, but fund rotation remains active, with some small-cap tokens performing particularly well, showing clear structural differentiation in the market. The top ten gainers are mostly concentrated in the Meme, AI, community, or experimental sectors, characterized by high topicality and volatility, becoming the focus of short-term fund chasing.
Among them, the top gainer is MORI, which has surged over 558% in price in the past two weeks, far exceeding other projects, indicating a highly concentrated influx of funds. MORI is a meme coin deployed on the Solana chain, which, due to its minimalist narrative style and high community enthusiasm, has formed a unique speculative cultural layer on the X platform in a short time, becoming one of the popular high Beta assets on Solana this round. Other outstanding projects include OFT (+182.31%, focusing on on-chain fragmented narratives), USELESS (+111.16%, emphasizing an ironic style of meme coin), and PROM (+80.61%, combining NFT and social invitation mechanisms), all of which generally possess strong community attributes and speculative topics.
Additionally, the list also includes BONK, PENGU, and other representative meme coins from Solana. BONK benefited from positive ETF application news and the Letsbonk platform's token issuance surpassing Pump.fun, with the number of holding addresses exceeding one million, recording an increase of over 56%. Emerging projects like AIC and EUL, which combine AI and native public chain positioning, also performed well, indicating that the market still maintains a high preference for high Beta assets.
In contrast, the losers are concentrated among projects that have recently lacked new narratives or have seen a significant decline in popularity, such as SAHARA (-45.66%, a data trading platform built on zero-knowledge privacy protocols that briefly gained popularity due to the "AI + data" concept but has recently seen a noticeable decrease in attention), ZBCN (-39.15%), TKX (-37.11%), etc., reflecting that in the context of overall market sentiment not having significantly warmed up, weak assets are more likely to be the first choice for fund withdrawal. Some older tokens like BSV and RVN also appear on the list, indicating their attractiveness is gradually waning under the new thematic rotation.
Overall, the market has not yet entered a systemic reversal phase, but fund styles have clearly shifted towards high volatility, high narrative, and strong community participation assets, with localized themes still presenting short-term performance opportunities. Projects lacking liquidity, popularity, or narrative strength face the risk of being marginalized by the market, with clear structural differentiation characteristics in the market.
Figure 2: The most prominent performer is the meme coin MORI on the Solana chain, with an increase of over 550%.
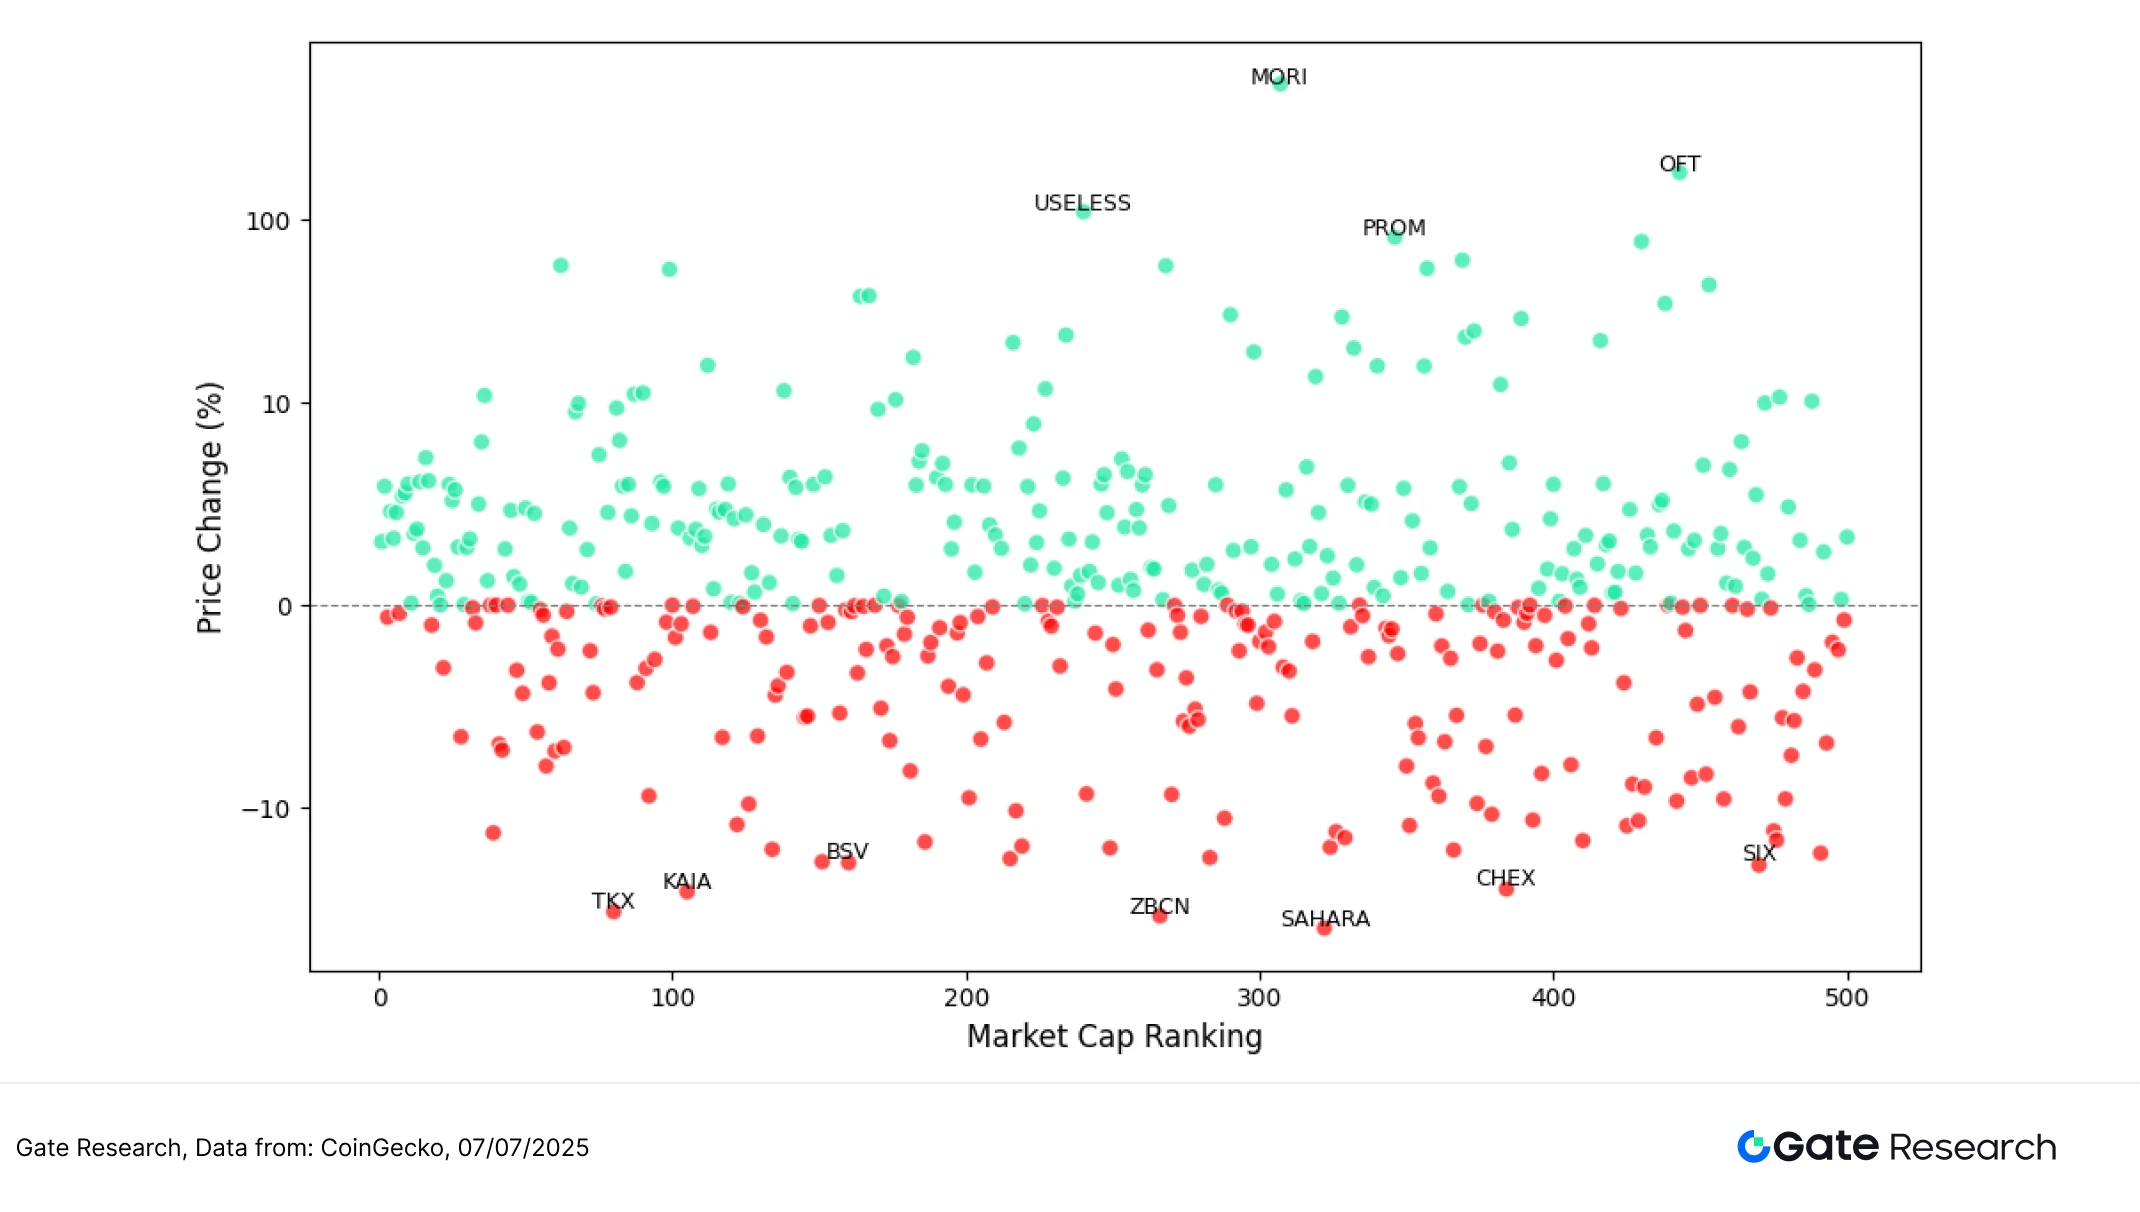
- Relationship Between Market Capitalization Ranking and Price Fluctuations
To further analyze the structural characteristics of token performance in this round of market conditions, this article has plotted a scatter distribution chart of the top 500 tokens by market capitalization. The horizontal axis represents market capitalization ranking (the further left, the larger the market cap), and the vertical axis represents price fluctuations from June 24 to July 7, displayed on a logarithmic scale. Each dot in the chart represents a token, with green indicating an increase and red indicating a decrease.
From the overall distribution, approximately 55% of tokens have increased, indicating that while there are signs of warming sentiment in the market, a comprehensive rebound has not yet formed, and the overall market still leans towards structural differentiation. The tokens with outstanding price increases are mostly mid and small-cap tokens, especially MORI, OFT, USELESS, PROM, etc., which are clearly located in the high-increase area of the chart, reflecting that market funds tend to focus on projects with topicality, community foundation, or speculative heat. These types of assets typically possess stronger social dissemination power and short-term explosive potential, making them more likely to attract attention and concentrated liquidity in a volatile market.
The mid to lower market capitalization ranges show relatively stable increases overall, indicating that funds tend to rotate within the mid and small-cap segments. In contrast, projects like SAHARA and ZBCN are among the top losers, mostly due to waning popularity or lack of narrative support, becoming the focus of fund withdrawal.
Overall, the current market trend is not dominated by mainstream assets but presents a structural characteristic of "mainstream stability, small coins active, and clear differentiation." Funds prefer mid and small-cap tokens with community enthusiasm, thematic speculative space, or innovative mechanisms, while assets lacking liquidity and narrative support face greater downward pressure.
Figure 3: More than half of the top 500 tokens have increased, with price increases concentrated in the 0–50% range, and mid and small-cap projects are relatively more active.
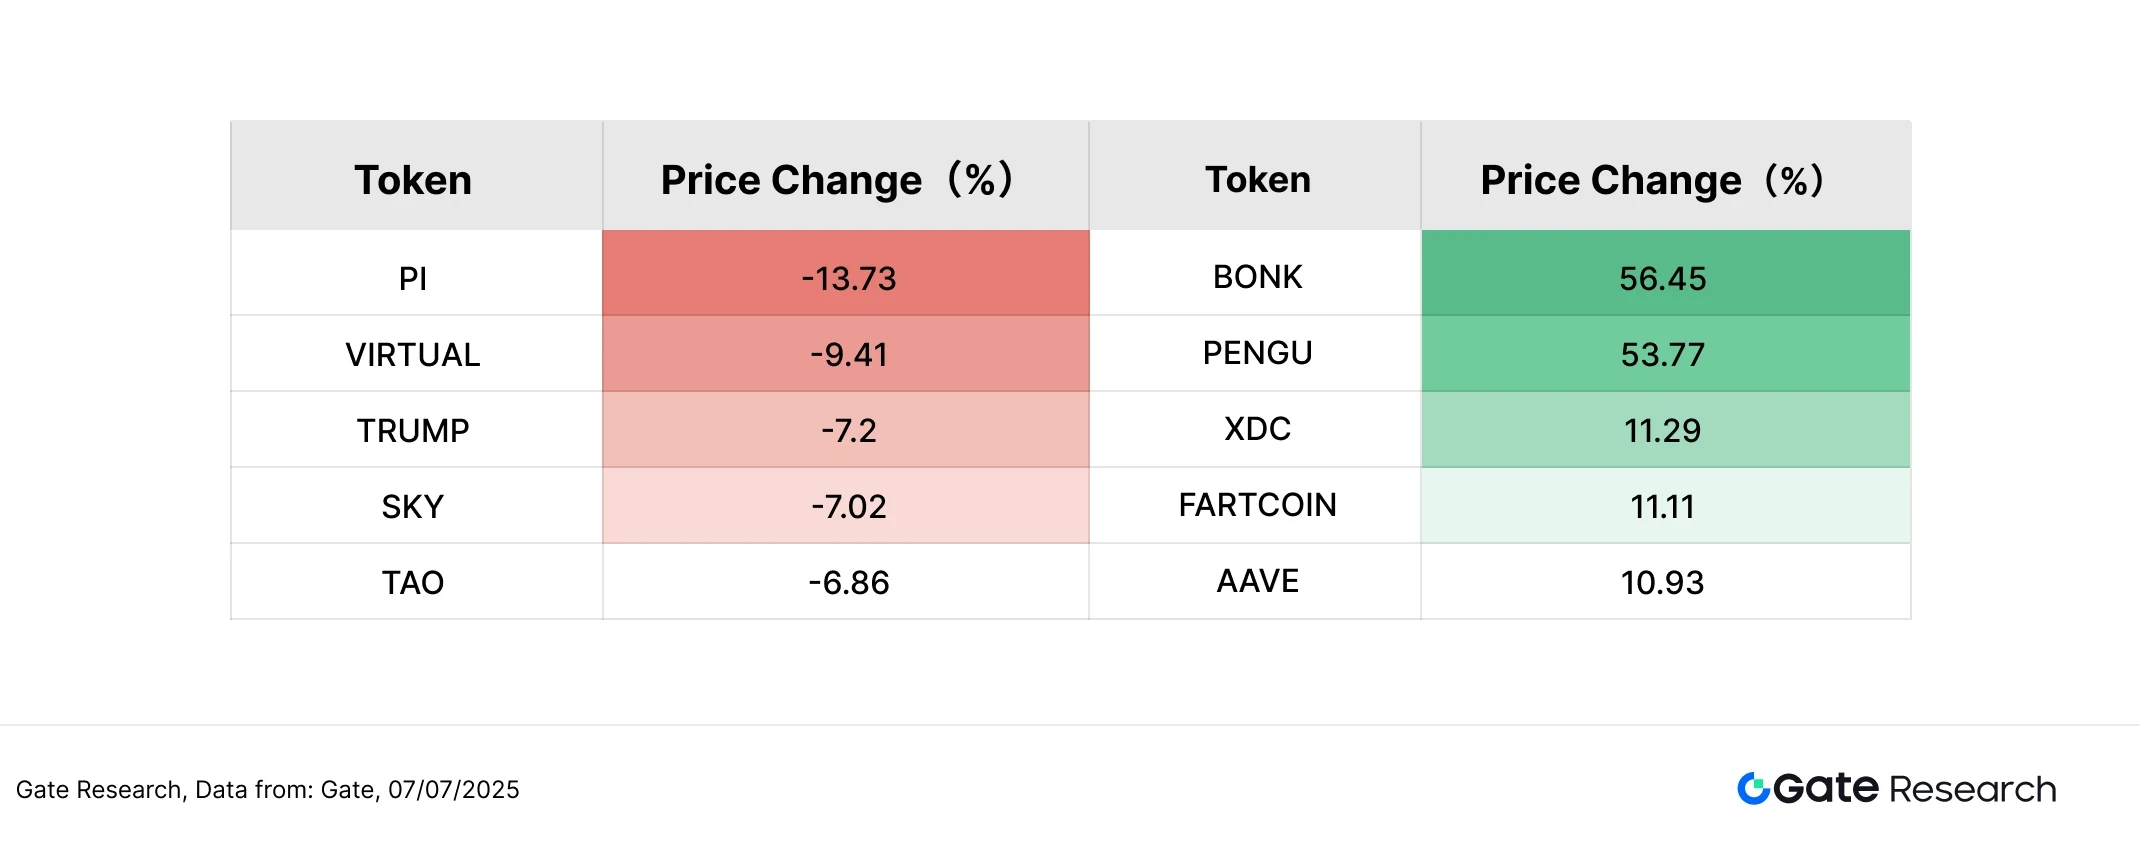
- Top 100 Market Capitalization Rankings
In the context of the current oscillating market, the top 100 tokens by market capitalization have maintained relatively robust performance overall. Excluding stablecoins and LSDs (liquid staking derivatives), the top five tokens by price increase are BONK (+56.45%), PENGU (+53.77%), XDC (+11.29%), FARTCOIN (+11.11%), and AAVE (+10.93%). These projects generally possess strong narratives, active communities, or high trading volumes, indicating that funds tend to favor high Beta targets in a volatile market.
Among them, BONK and PENGU, as representative meme projects on the Solana chain, not only benefit from macro positive expectations such as ETFs but also stand out in the market due to their strong community foundations and continuous topic dissemination capabilities; FARTCOIN, although a meme coin, has attracted short-term speculation due to its AI interactive gameplay mechanism, exhibiting typical high volatility characteristics. AAVE and XDC demonstrate the resilience of traditional DeFi projects in this cycle, with the former benefiting from continuous upgrades to its lending protocol, and the latter gaining traction from the RWA narrative, along with Credefi and CRYMBO deploying loan and compliance tools on its chain at the end of June, further strengthening its application expectations in traditional financial asset on-chain scenarios.
On the other hand, some tokens among the top 100 have recorded significant declines, showing relative pressure. The top five losers are PI (-13.73%), VIRTUAL (-9.41%), TRUMP (-7.20%), SKY (-7.02%), and TAO (-6.86%), most of which were previously notable for significant price increases and rapidly rising popularity, entering a consolidation phase in the absence of new catalysts, leading to a certain degree of price correction. Among them, PI and VIRTUAL gained market attention in May due to ecological progress and conceptual speculation, but this month, lacking new catalysts, they face dual pressures of profit-taking and sentiment decline, leading to a converging trend.
Overall, the current top 100 tokens exhibit a pattern of "the strong remain strong, thematic rotation," where projects with clear narratives and trading heat are more likely to gain market favor, while speculative assets lacking sustained support are prone to corrections, highlighting the structural differentiation trend in a volatile market.
Figure 4: The leading tokens in the top 100 by price increase are mainly distributed in active trading or high narrative sectors, reflecting that market funds are more inclined to allocate to mainstream projects with topicality and responsiveness.
II. Analysis of Volume Performance
- Volume Growth Analysis
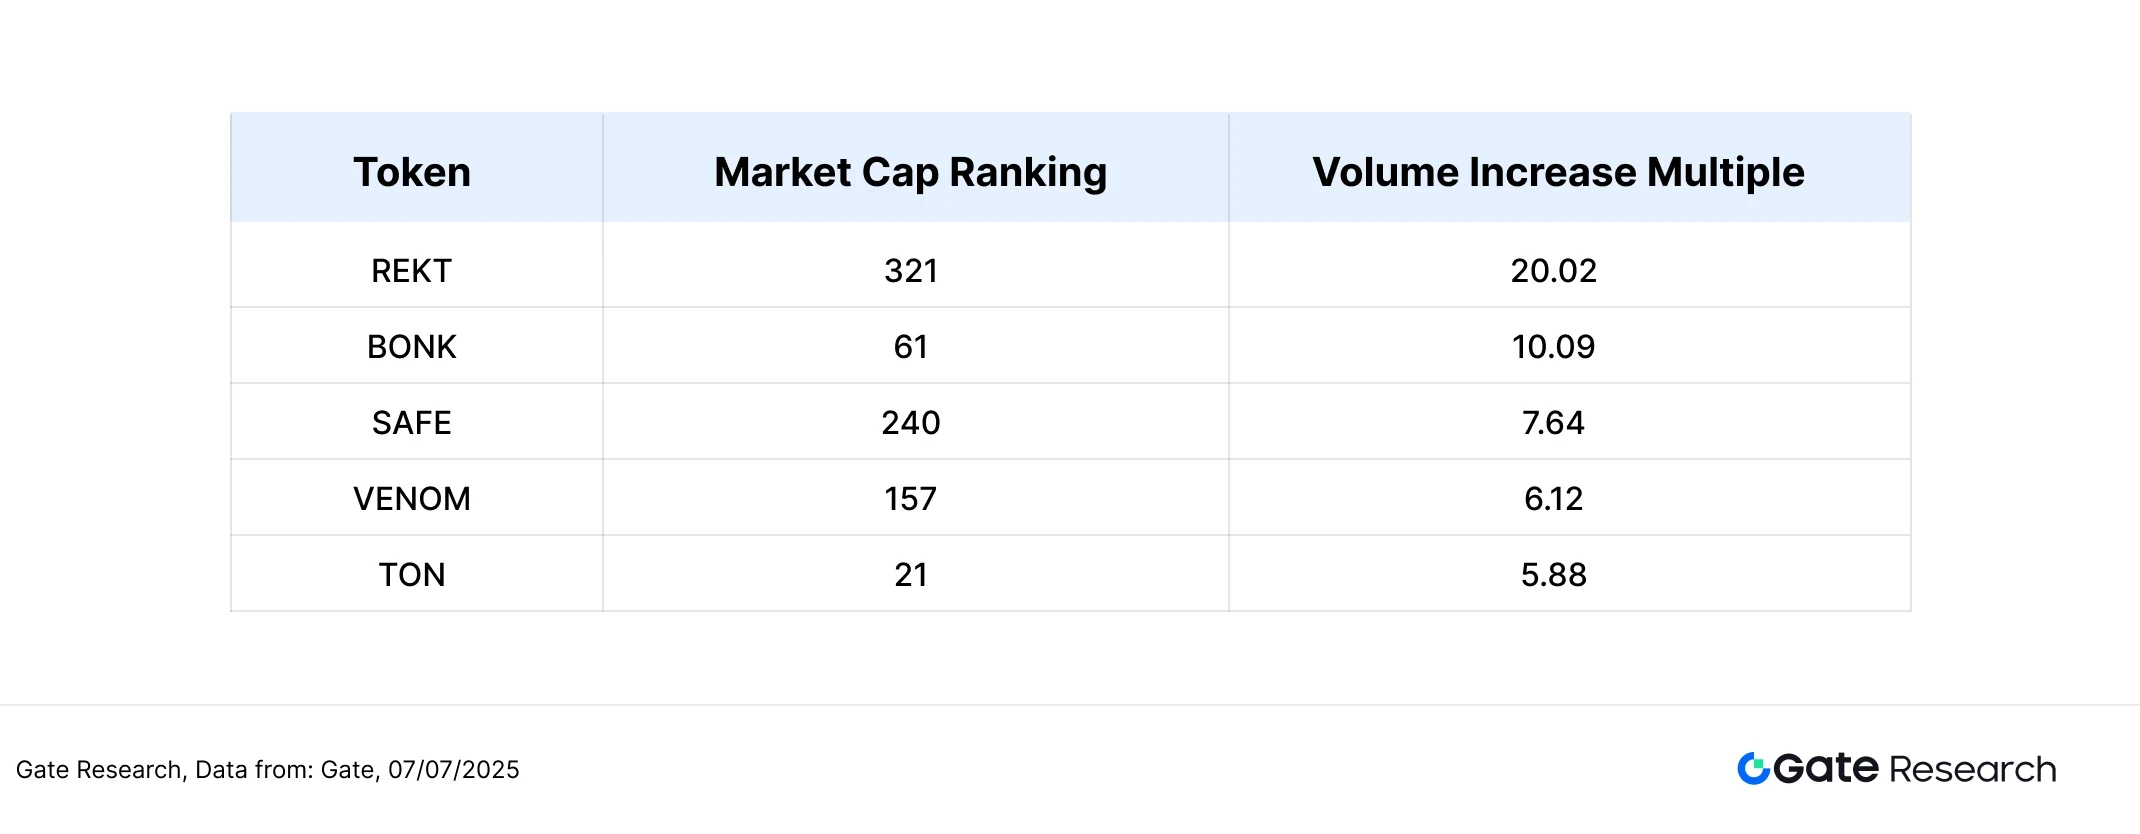
Building on the analysis of token price performance, this article further observes the changes in trading volume for certain tokens during this market cycle. Using the trading volume before the market started as a baseline, the volume growth multiple as of July 7 is calculated to measure changes in market heat and trading activity.
Data shows that REKT, ranked outside the top 300 by market capitalization, has seen its trading volume increase by over 20 times. Although its price rebound is relatively mild (+11.03%), it has already shown clear signs of short-term speculative activity. REKT is a meme project featuring a minimalist issuance model with "no pre-mining, no token distribution, no private placement," with its core mechanism being on-chain anonymous token issuance, attracting a large amount of speculative funds due to its high risk and high volatility characteristics. The meme coin BONK from the Solana ecosystem has seen its trading volume increase by over 10 times, with a price rebound of 56%, continuing its strong performance mentioned earlier, indicating that it remains a highly sought-after trading target driven by community momentum and platform development.
Other tokens such as SAFE (+7.64 times), VENOM (+6.12 times), and TON (+5.88 times) also recorded significant volume increases. Among them, VENOM achieved nearly 40% price increase driven by project expansion and community engagement, while TON, despite significant volume increase, saw a slight price correction (-2.75%), possibly indicating that the inflow of funds is more from short-term arbitrage or selling pressure.
From the market capitalization structure perspective, the current volume-increasing projects are mostly concentrated in the market capitalization ranks of 50 to 300, characterized by moderate size, high volatility, and active liquidity, making them easy targets for short-term funds. Rapid volume expansion may not necessarily be accompanied by sustained price increases, but it often indicates heightened market attention, especially among mid and small-cap tokens, where changes in volume often have leading significance, making them suitable as one of the observation signals for short-term market conditions.
Figure 5: The trading volumes of mid and small-cap tokens like REKT and BONK have significantly increased, indicating rising market attention.
- Volume Changes and Price Analysis
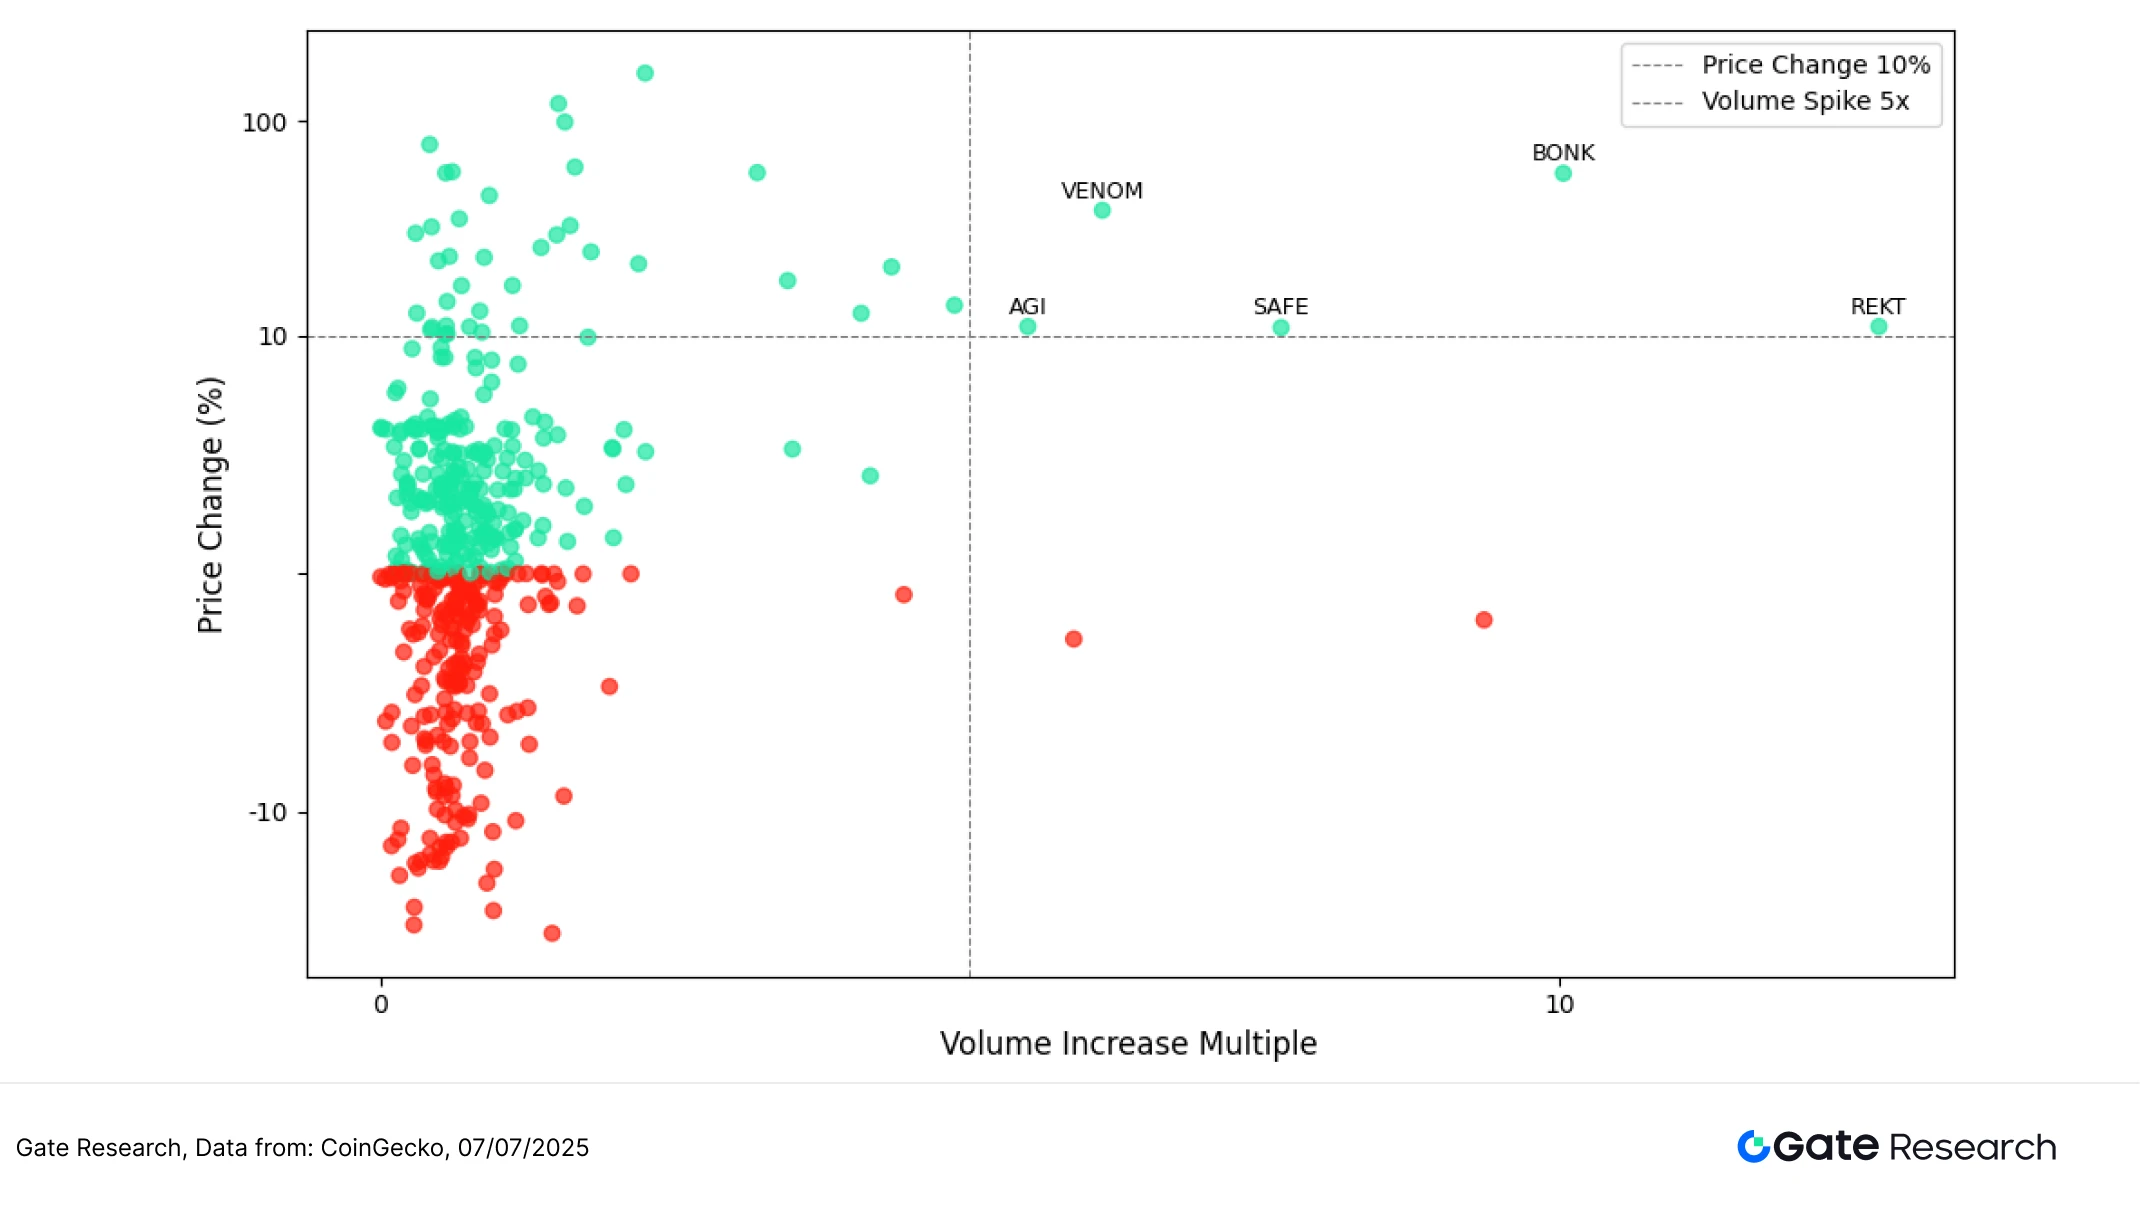
Continuing the observation of volume anomaly projects, this article further combines price performance to plot a scatter diagram of volume growth multiples (Volume Increase Multiple) and price change percentages (Price Change %). The horizontal axis represents the growth multiples of each token's trading volume compared to the baseline period over the past two weeks, while the vertical axis represents the price fluctuations during the same period, using a symmetric logarithmic scale for clearer presentation of extreme changes.
Overall, the upper right quadrant concentrates a group of tokens that have attracted significant attention in this market cycle, exhibiting typical "volume-price resonance" characteristics. Among them, BONK's trading volume increased over 10 times, with a price increase of 56%, continuing its strong performance mentioned earlier. Driven by the Solana community momentum and meme craze, it has become a focal point for fund chasing. VENOM and SAFE are also located in this area, recording increases of 39.66% and 11.02%, respectively, reflecting that their narrative themes are attractive and that their funding support is relatively stable.
It is noteworthy that REKT, despite a price increase of only about 11%, has seen its trading volume increase by as much as 15 times, also falling into the upper right quadrant, demonstrating clear signs of short-term speculative activity. As a minimalist on-chain token issuance project with "no pre-mining, no distribution," REKT's performance confirms the market's preference for high volatility and high-risk assets, indicating that even if its price increase is not as significant as that of BONK and other projects, the dramatic changes in volume still hold indicative significance for fund momentum.
In contrast, the lower right quadrant gathers some projects that have "increased volume but not synchronized price increases." For example, TON's trading volume increased nearly 6 times, but its price saw a slight correction (-2.75%), possibly due to the recently launched golden visa program attracting funds to lock up, which has increased heat but faced certain pressure in the short-term market due to limited actual buying. Additionally, the lower left quadrant is populated with assets showing neither significant trading volume nor price changes, indicating that the current market still belongs to structural rotation, with funds focusing on individual tokens with thematic or community momentum, yet to fully spread to the overall market.
In summary, the relationship between volume anomalies and price trends remains a key indicator for identifying short-term fund attention and market initiation potential. Especially among mid and small-cap projects, "rapid volume expansion" often leads price reactions, and if accompanied by narrative or community catalysts, it is more likely to attract fund inflows, forming an important reference signal for short-term strategies.
Figure 6: Tokens like BONK, VENOM, SAFE, and REKT fall into the upper right quadrant, aligning with the "volume-price resonance" logic, representing typical volume-driven price increases in this market cycle.
- Correlation Analysis
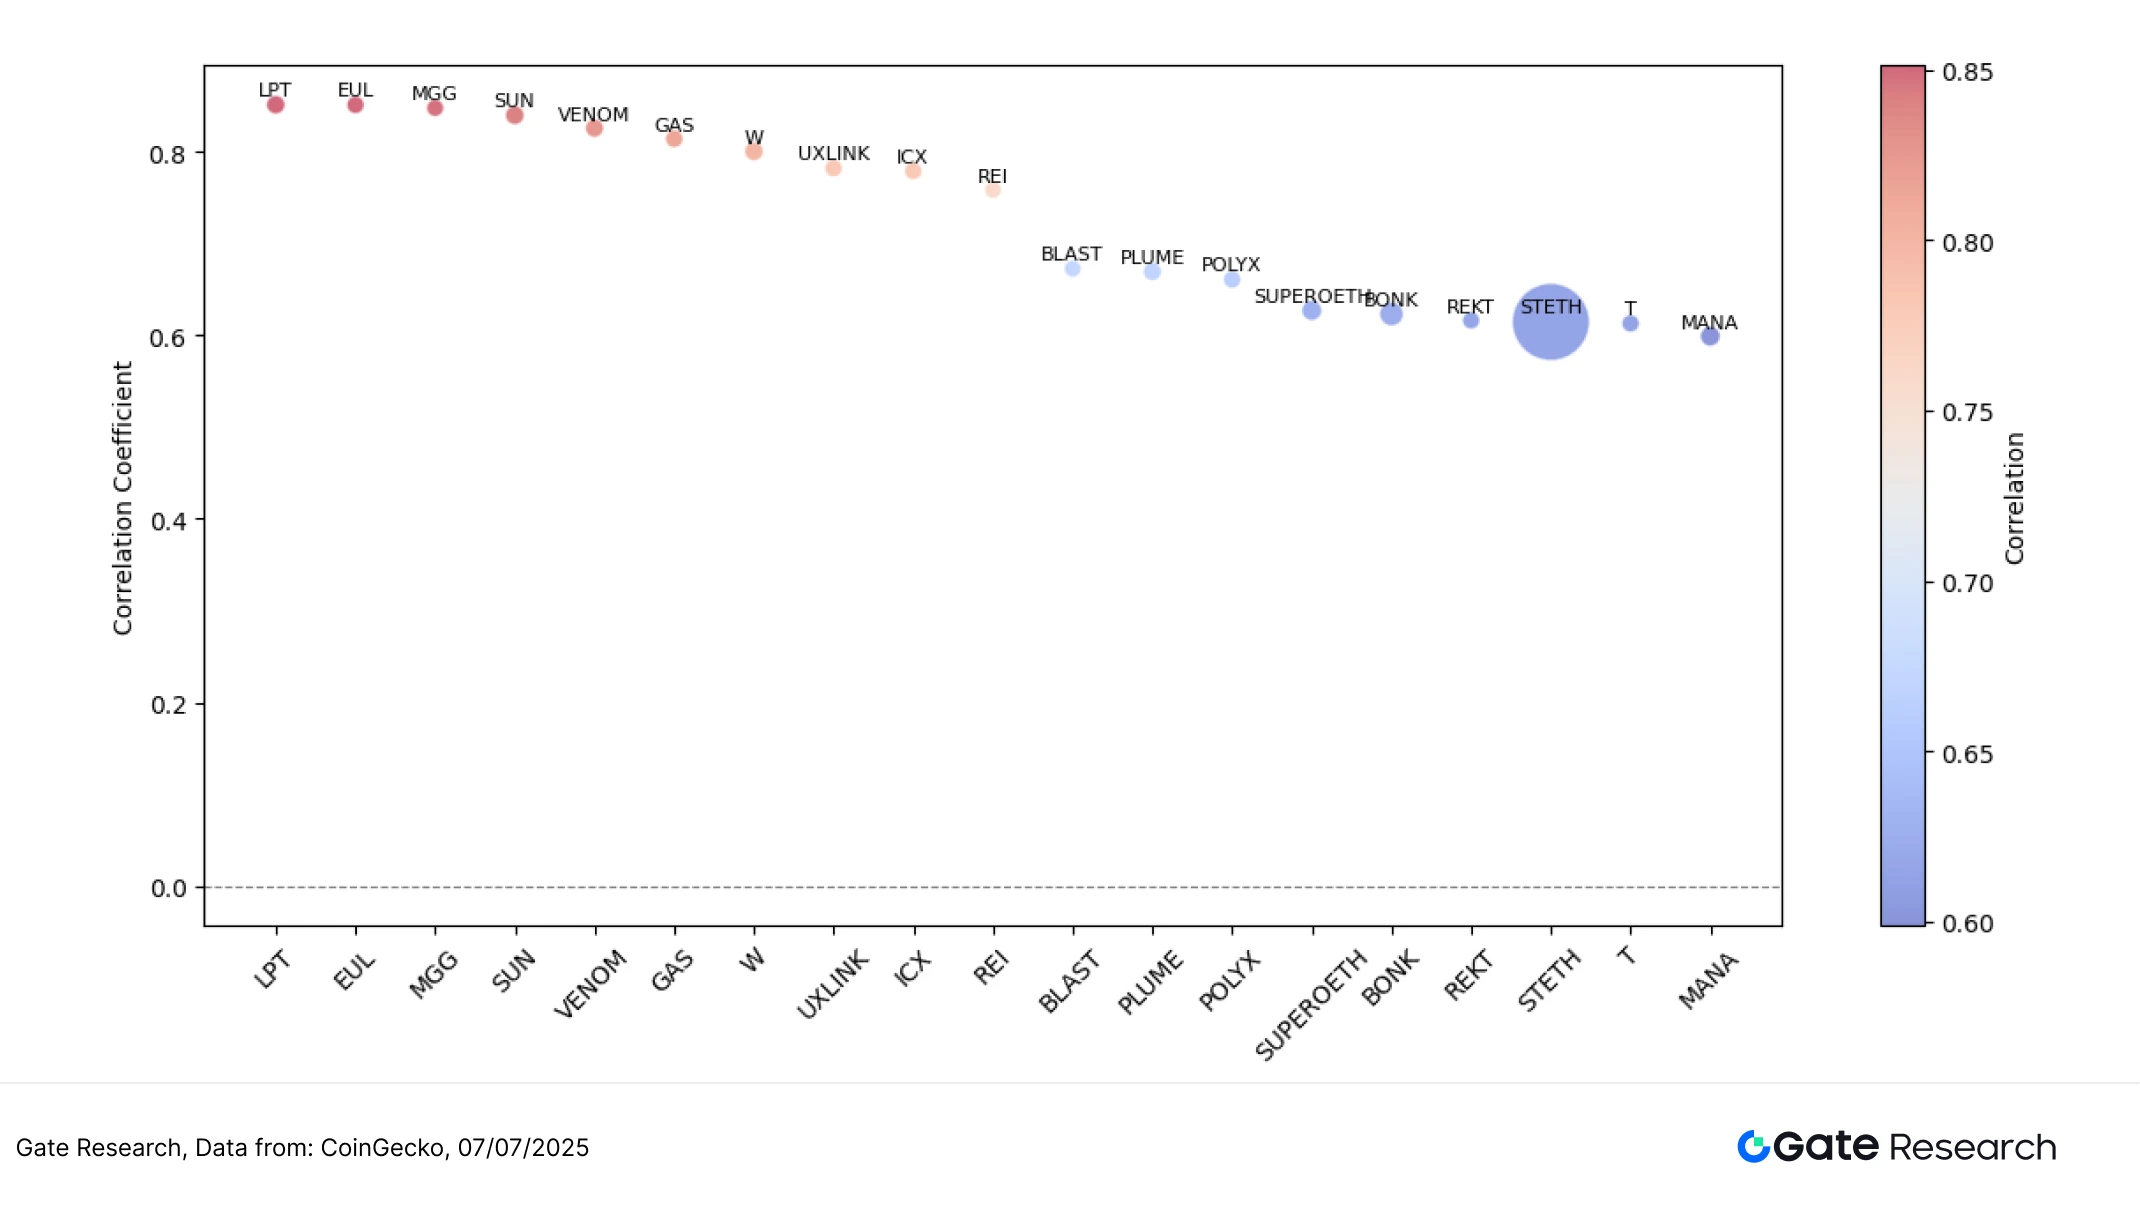
After exploring the direct relationship between token trading volume changes and price performance, this article further analyzes the structural connection between the two from a statistical perspective. To assess whether market fund activity has a systematic impact on price changes, we introduce "Volume / Market Cap" as a relative activity indicator and calculate its correlation coefficient with price fluctuations. Through correlation analysis, it helps identify which tokens in the current market are more likely to be driven by fund liquidity and whether there is a consistent linkage pattern between volume and price, thus providing investors with more structured insights for judgment.
From the chart, it can be seen that the correlation between "Volume / Market Cap" and price increases for most tokens is concentrated between 0.60 and 0.85, indicating that fund activity has a certain impact on price changes. The color of the points in the chart represents the strength of the correlation coefficient (red for high, blue for low), and the size of the bubbles is adjusted according to the market capitalization of the tokens, reflecting their size differences in the market.
Projects like LPT, EUL, MGG, SUN, and VENOM located in the upper left of the chart generally have correlation coefficients between 0.82 and 0.85, and their bubbles are relatively small, indicating that these mid and small-cap tokens are more likely to experience significant price fluctuations when trading volume is active, reflecting typical "volume-price linkage" characteristics, often becoming hotspots for short-term fund attention.
On the right side, tokens like BONK, REKT, STETH, and MANA, although having slightly lower correlations (mostly in the 0.60–0.65 range), have significantly larger market capitalizations, and their bubble sizes are also larger, reflecting ample liquidity and widespread fund participation. These tokens exhibit relatively mild volatility; although the degree of volume-price linkage is lower, they still provide stable support in the overall market.
Overall, this chart reveals a structural characteristic of "thematic drive + market capitalization diffusion": mid and small-cap tokens are more likely to experience short-term explosions driven by funds, while large-cap projects attract mainstream funds and maintain relative stability. Investors can use this to identify changes in trading heat, combining the correlation between activity and price increases to optimize short-term strategies and mid-term allocation directions.
Figure 7: Tokens like LPT, EUL, SUN, and VENOM show high volume-price linkage, reflecting concentrated speculative characteristics; REKT and STETH, with larger market capitalizations, exhibit relatively stable performance.
In summary, although the cryptocurrency market has not yet welcomed a comprehensive rebound, the structural rotation characteristics are becoming increasingly evident, with funds clearly inclined to chase mid and small-cap assets with narrative heat and trading activity. Volume anomalies and thematic catalysts are becoming key references for identifying short-term trading opportunities and fund momentum in the current market.
In addition to the active performance in the trading market, several potential airdrop projects are also being promoted simultaneously, covering popular tracks such as data intelligence, modular infrastructure, AI interaction, and on-chain identity. If users can grasp the timing, they are likely to layout in advance during the market oscillation period and obtain potential token returns. The following will briefly outline the current airdrop tasks worth paying attention to and participation methods.
Airdrop Hot Projects
This article summarizes the airdrop potential projects worth focusing on from June 24 to July 7, 2025, covering several active Web3 newcomers such as Altius (emerging data intelligence protocol), Camp Network (modular blockchain infrastructure), ChainOpera (AI-driven on-chain interaction platform), and Sapien (on-chain identity and social points platform). These projects are generally in the early stages and are attracting user participation through incentive testnets, task systems, AI interactions, and social bindings. Points, badges, and verification mechanisms may become important references for token distribution in the future. Users can continuously accumulate points by registering accounts, binding wallets and social accounts, and participating in daily tasks to secure potential airdrop qualifications in advance. The following will detail each project's basic positioning, latest activities, and participation paths to help users keep pace and layout early dividends.
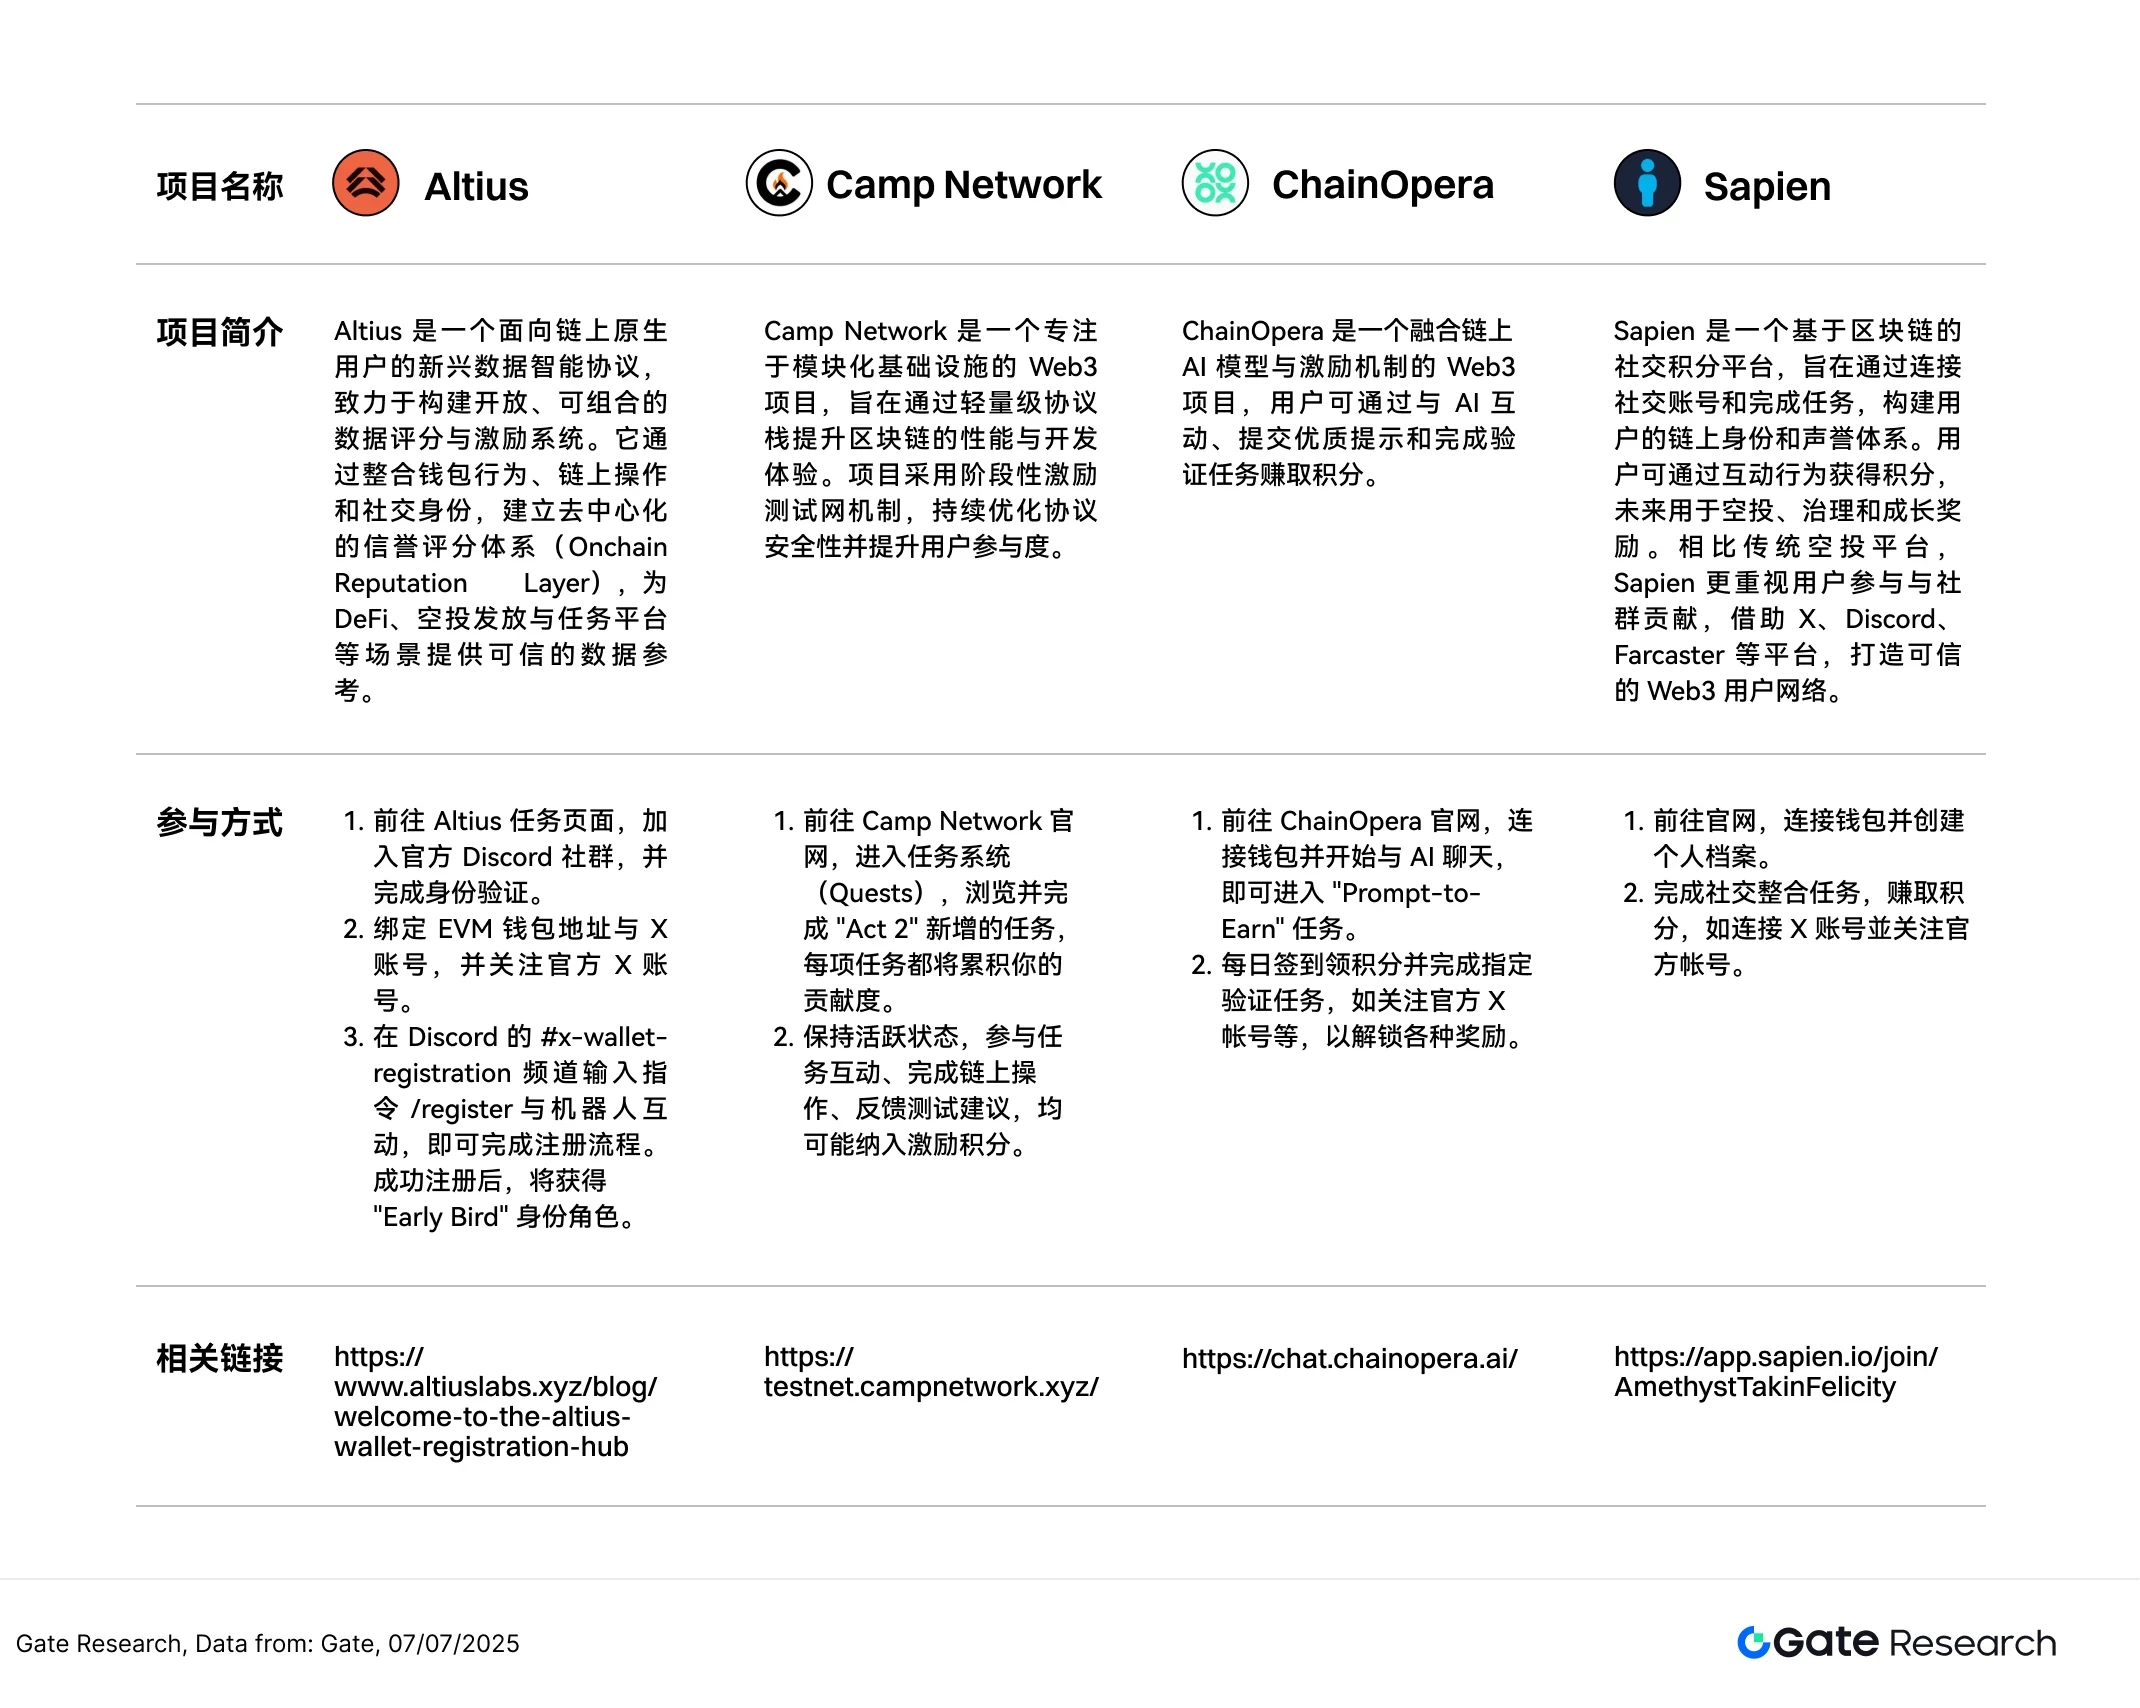
- Altius
Altius is an emerging data intelligence protocol aimed at on-chain native users, dedicated to building an open and composable data scoring and incentive system. By integrating user wallet behaviors, on-chain operation records, and social identities, Altius aims to establish a decentralized reputation scoring system (Onchain Reputation Layer) to provide trusted data references for applications such as DeFi, airdrop distribution, and task platforms.
Currently, Altius is temporarily opening applications for the Early Bird role, which is an important identity marker for early supporters, potentially enjoying exclusive airdrops, whitelist participation qualifications, or platform point incentives in the future.
Participation method:
Visit the Altius task page, join the official Discord community, and complete identity verification.
Bind your EVM wallet address and X account, and follow the official X account.
In the Discord #x-wallet-registration channel, enter the command /register to interact with the bot to complete the registration process. After successful registration, you will receive the "Early Bird" identity role.
- Camp Network
Camp Network is a Web3 project focused on building modular infrastructure, aiming to enhance the performance scalability and development experience of blockchain networks through a lightweight protocol stack. It employs a phased incentive testnet mechanism to continuously optimize protocol security and participant activity.
Currently, Camp Network has officially launched the "Incentive Testnet V2 Act 2" and introduced new tasks. Users can earn points by completing tasks, which may be used for airdrops or testnet reward settlements in the future.
Participation method:
Visit the Camp Network official website, enter the task system (Quests), browse and complete the newly added tasks in "Act 2," each task will accumulate your contribution.
Stay active by participating in task interactions, completing on-chain operations, and providing feedback on testing suggestions, all of which may be included in incentive points.
- ChainOpera
ChainOpera is a Web3 project that combines on-chain AI models with incentive mechanisms. Users can earn points by interacting with AI models, submitting quality prompts, and completing verification tasks. The platform has launched the "Prompt-to-Earn" interactive task activity and the second season of airdrops, where early participants will have the opportunity to earn badges, ranking rewards, and future token airdrop qualifications.
Currently, the platform has launched the "Prompt-to-Earn" interactive task activity and the second season of airdrops, where early participants will have the opportunity to earn badges, ranking rewards, and future token airdrop qualifications.
Participation method:
Visit the ChainOpera official website, connect your wallet, and start chatting with AI to enter the "Prompt-to-Earn" task.
Check in daily to earn points and complete designated verification tasks, such as following the official X account, to unlock various rewards.
- Sapien
Sapien is a blockchain-based social points platform aimed at building users' on-chain identities and reputation systems by connecting social accounts and completing tasks. Users can earn points through interactive behaviors, which can be used for airdrops, governance, and growth rewards in the future. Compared to traditional airdrop platforms, Sapien places more emphasis on user participation and community contributions, leveraging platforms like X, Discord, and Farcaster to create a trustworthy Web3 user network.
Currently, the platform has launched multiple activities, and users can earn points by completing simple tasks, which can be used for reward distribution, airdrop allocation, or platform governance in the future.
Participation method:
Visit the official website, connect your wallet, and create a personal profile.
Complete social integration tasks to earn points, such as connecting your X account and following the official account.
Note
Airdrop plans and participation methods may be updated at any time, so users are advised to follow the official channels of the above projects for the latest information. At the same time, users should participate cautiously, be aware of risks, and conduct thorough research before participating. Gate does not guarantee the distribution of subsequent airdrop rewards.
Summary
Looking back at the market cycle from June 24 to July 7, 2025, the cryptocurrency market overall maintained a high-level oscillating consolidation pattern. Although there has not been a systemic rebound, under the structural rotation of funds and local thematic drives, some mid and small-cap tokens performed brightly, indicating that market heat has not significantly receded. The average increase of the top 500 tokens by market capitalization was 3.07%, with tokens ranked 301–400 showing the most outstanding performance, averaging nearly 8% increase, reflecting that funds still prefer assets with topicality, narrative potential, and price elasticity.
From the perspective of trading volume changes, projects like BONK, REKT, and VENOM have seen significant volume increases, with some tokens' trading volumes growing over 10 times, becoming the focus of short-term market attention, indicating that funds are actively seeking trading targets with explosive potential. The volume-price linkage chart further reveals that projects in the upper right quadrant generally exhibit a resonance characteristic of "volume surge + price increase," making them easy to attract funds; while some tokens that have increased volume but not seen synchronized price increases reflect market divergence regarding their subsequent performance.
Overall, the current market still presents a structural pattern of "thematic rotation + mainstream stability," with funds seeking speculative space between narrative-driven and high-volatility targets. Volume anomalies remain an important signal for identifying market initiation and judging structural rotation, especially among mid and small-cap assets, where they hold greater trading reference value. If the macro environment and regulatory landscape continue to release positive expectations, the market is likely to gradually accumulate momentum during the oscillation, laying the foundation for market recovery in the second half of the year.
Additionally, the projects tracked in this issue, such as Altius, Camp Network, ChainOpera, and Sapien, cover popular tracks like data intelligence, modular infrastructure, AI interaction, and on-chain identity, with clear tasks and participation paths. Most are currently in testing or early incentive stages, and users can accumulate points through wallet binding, task completion, and inviting friends to secure future airdrop or reward qualifications. Continuous participation not only helps in obtaining token incentives but also benefits in seizing early Web3 dividends.
References:
CoinGecko, https://www.coingecko.com/
Altius, https://www.altiuslabs.xyz/blog/welcome-to-the-altius-wallet-registration-hub
Camp Network, https://testnet.campnetwork.xyz/
ChainOpera, https://chat.chainopera.ai/
Sapien, https://app.sapien.io/join/AmethystTakinFelicity
Gate Research Institute is a comprehensive blockchain and cryptocurrency research platform that provides readers with in-depth content, including technical analysis, hot insights, market reviews, industry research, trend forecasts, and macroeconomic policy analysis.
Disclaimer
Investing in the cryptocurrency market involves high risks. Users are advised to conduct independent research and fully understand the nature of the assets and products they are purchasing before making any investment decisions. Gate does not assume responsibility for any losses or damages caused by such investment decisions.
免责声明:本文章仅代表作者个人观点,不代表本平台的立场和观点。本文章仅供信息分享,不构成对任何人的任何投资建议。用户与作者之间的任何争议,与本平台无关。如网页中刊载的文章或图片涉及侵权,请提供相关的权利证明和身份证明发送邮件到support@aicoin.com,本平台相关工作人员将会进行核查。


