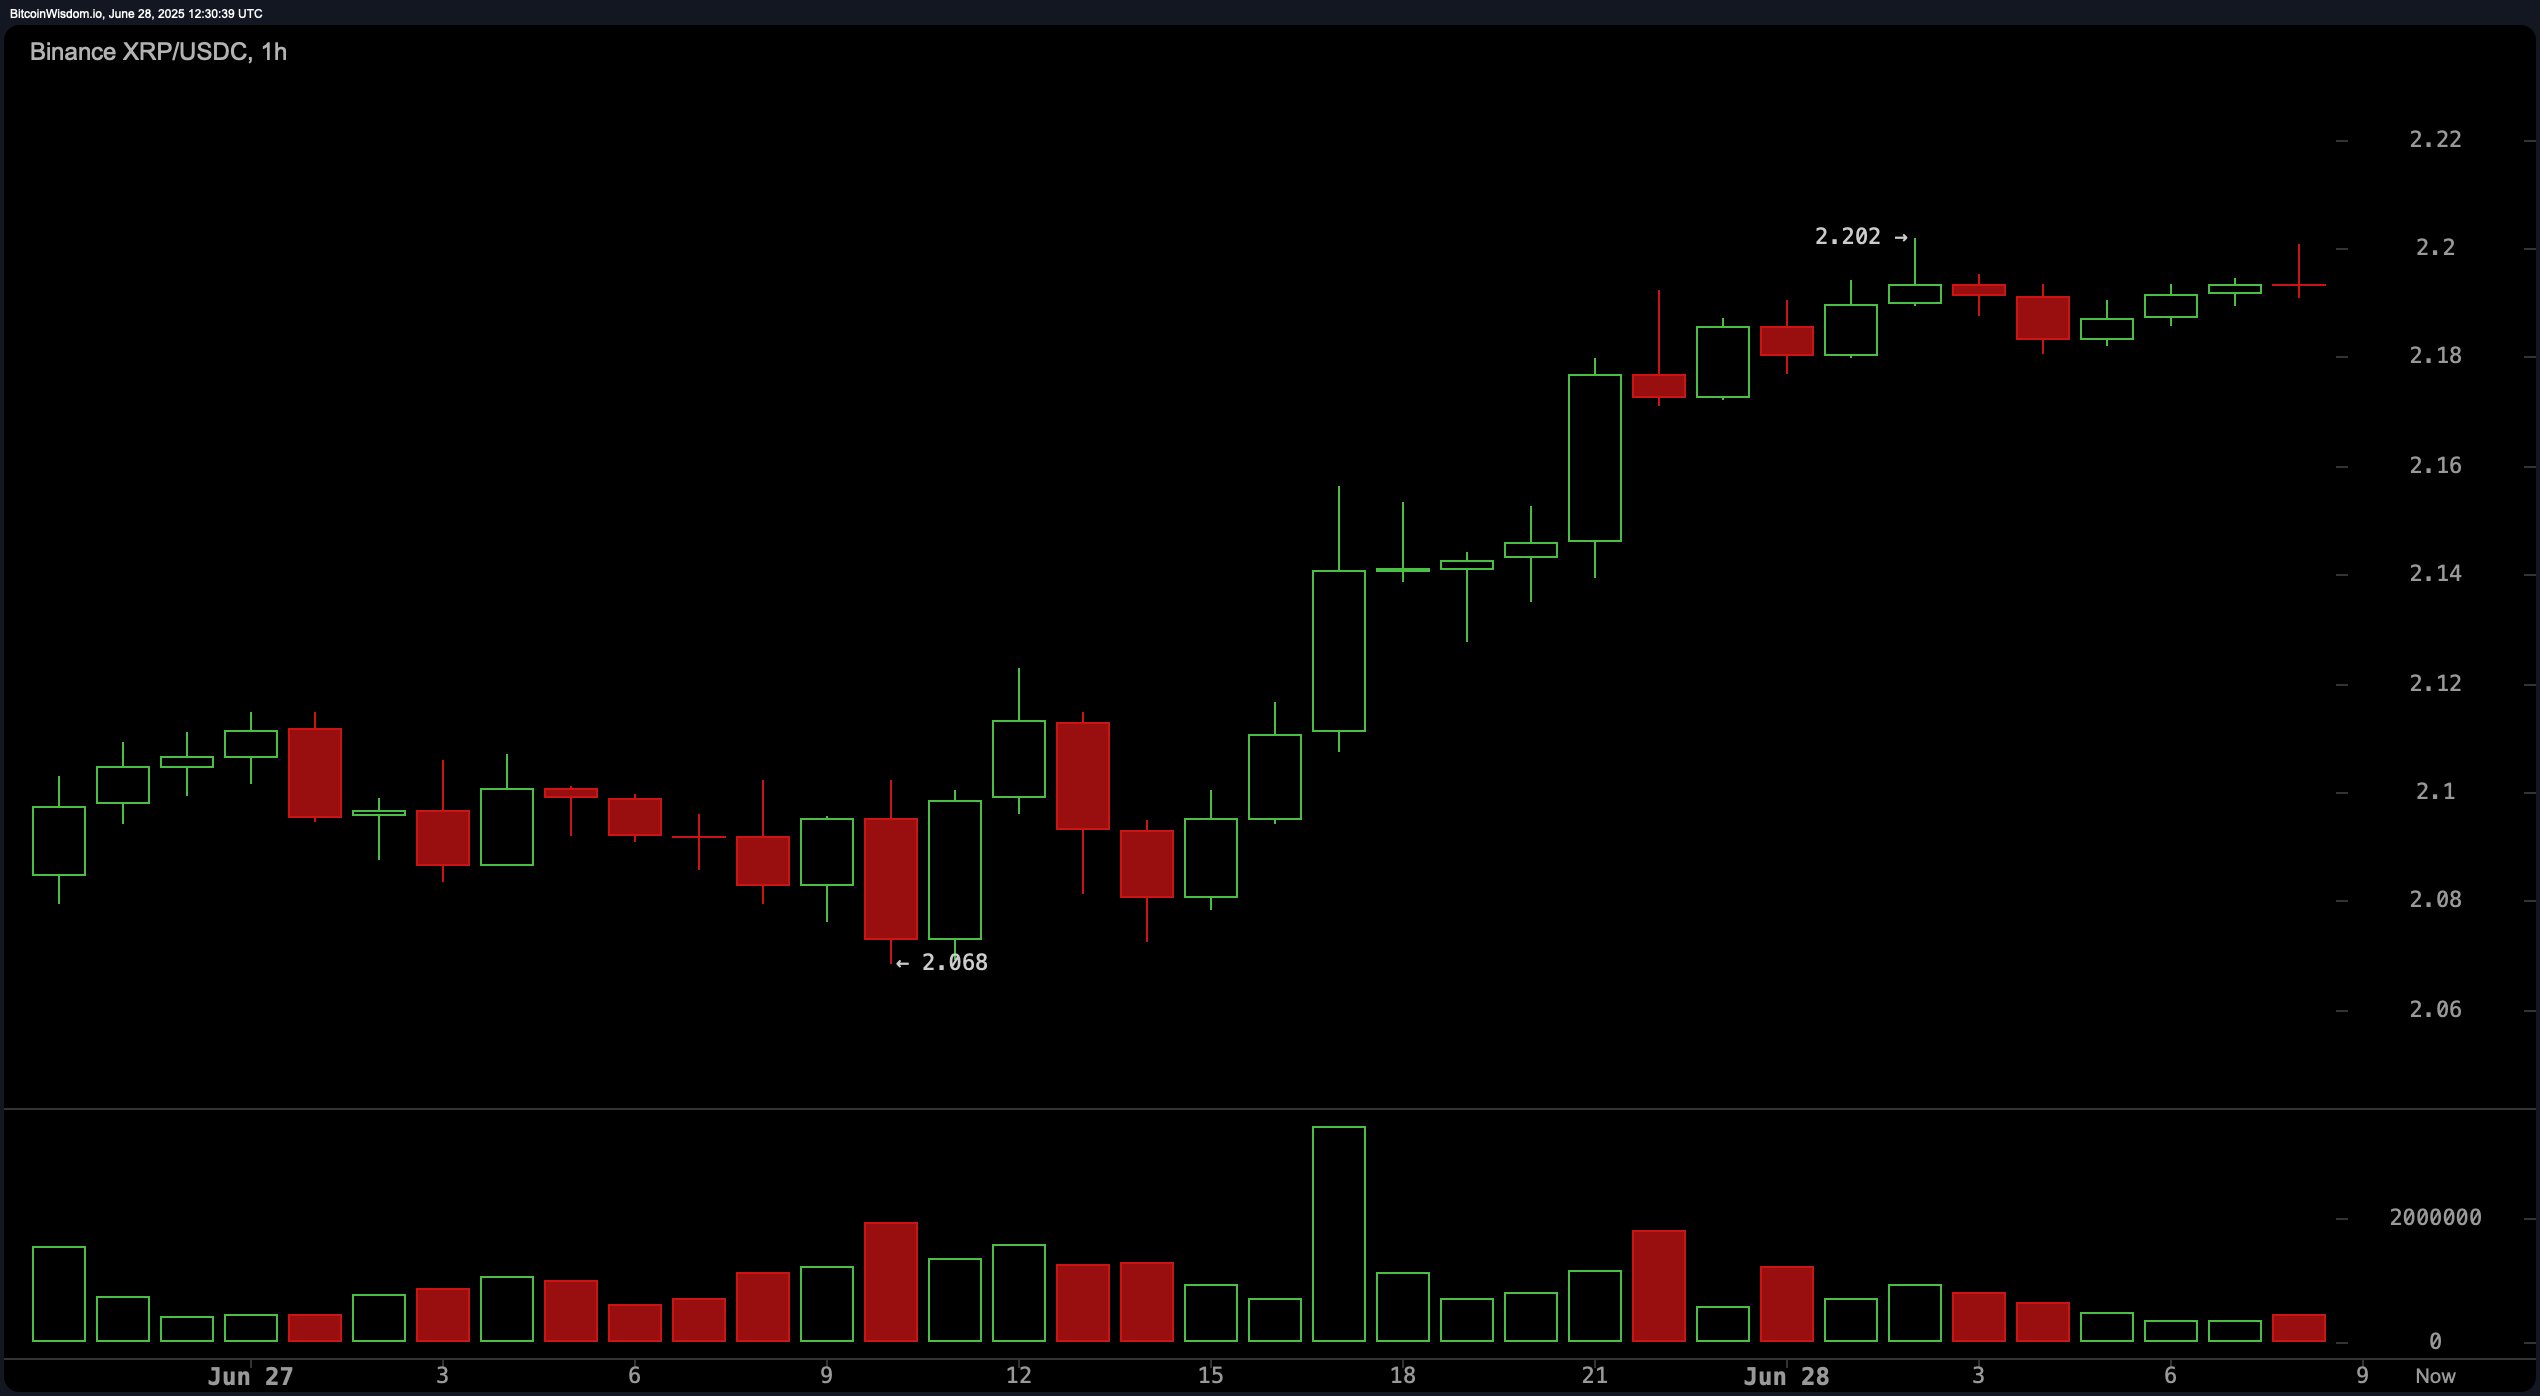
In the 1-hour chart, XRP exhibits a clear short-term uptrend marked by higher highs and higher lows. This suggests that bullish momentum is driving the price action. Buyers are evidently dominating the short-term market, with the latest peak reaching $2.202 before encountering minor resistance. Dip-buying opportunities appear favorable between $2.17 and $2.18, targeting the $2.22 to $2.23 range. A prudent stop-loss level for intraday trades would be set just below $2.16 to mitigate downside risk.

XRP/USDC via Binance on June 28, 2025, 1-hour chart.
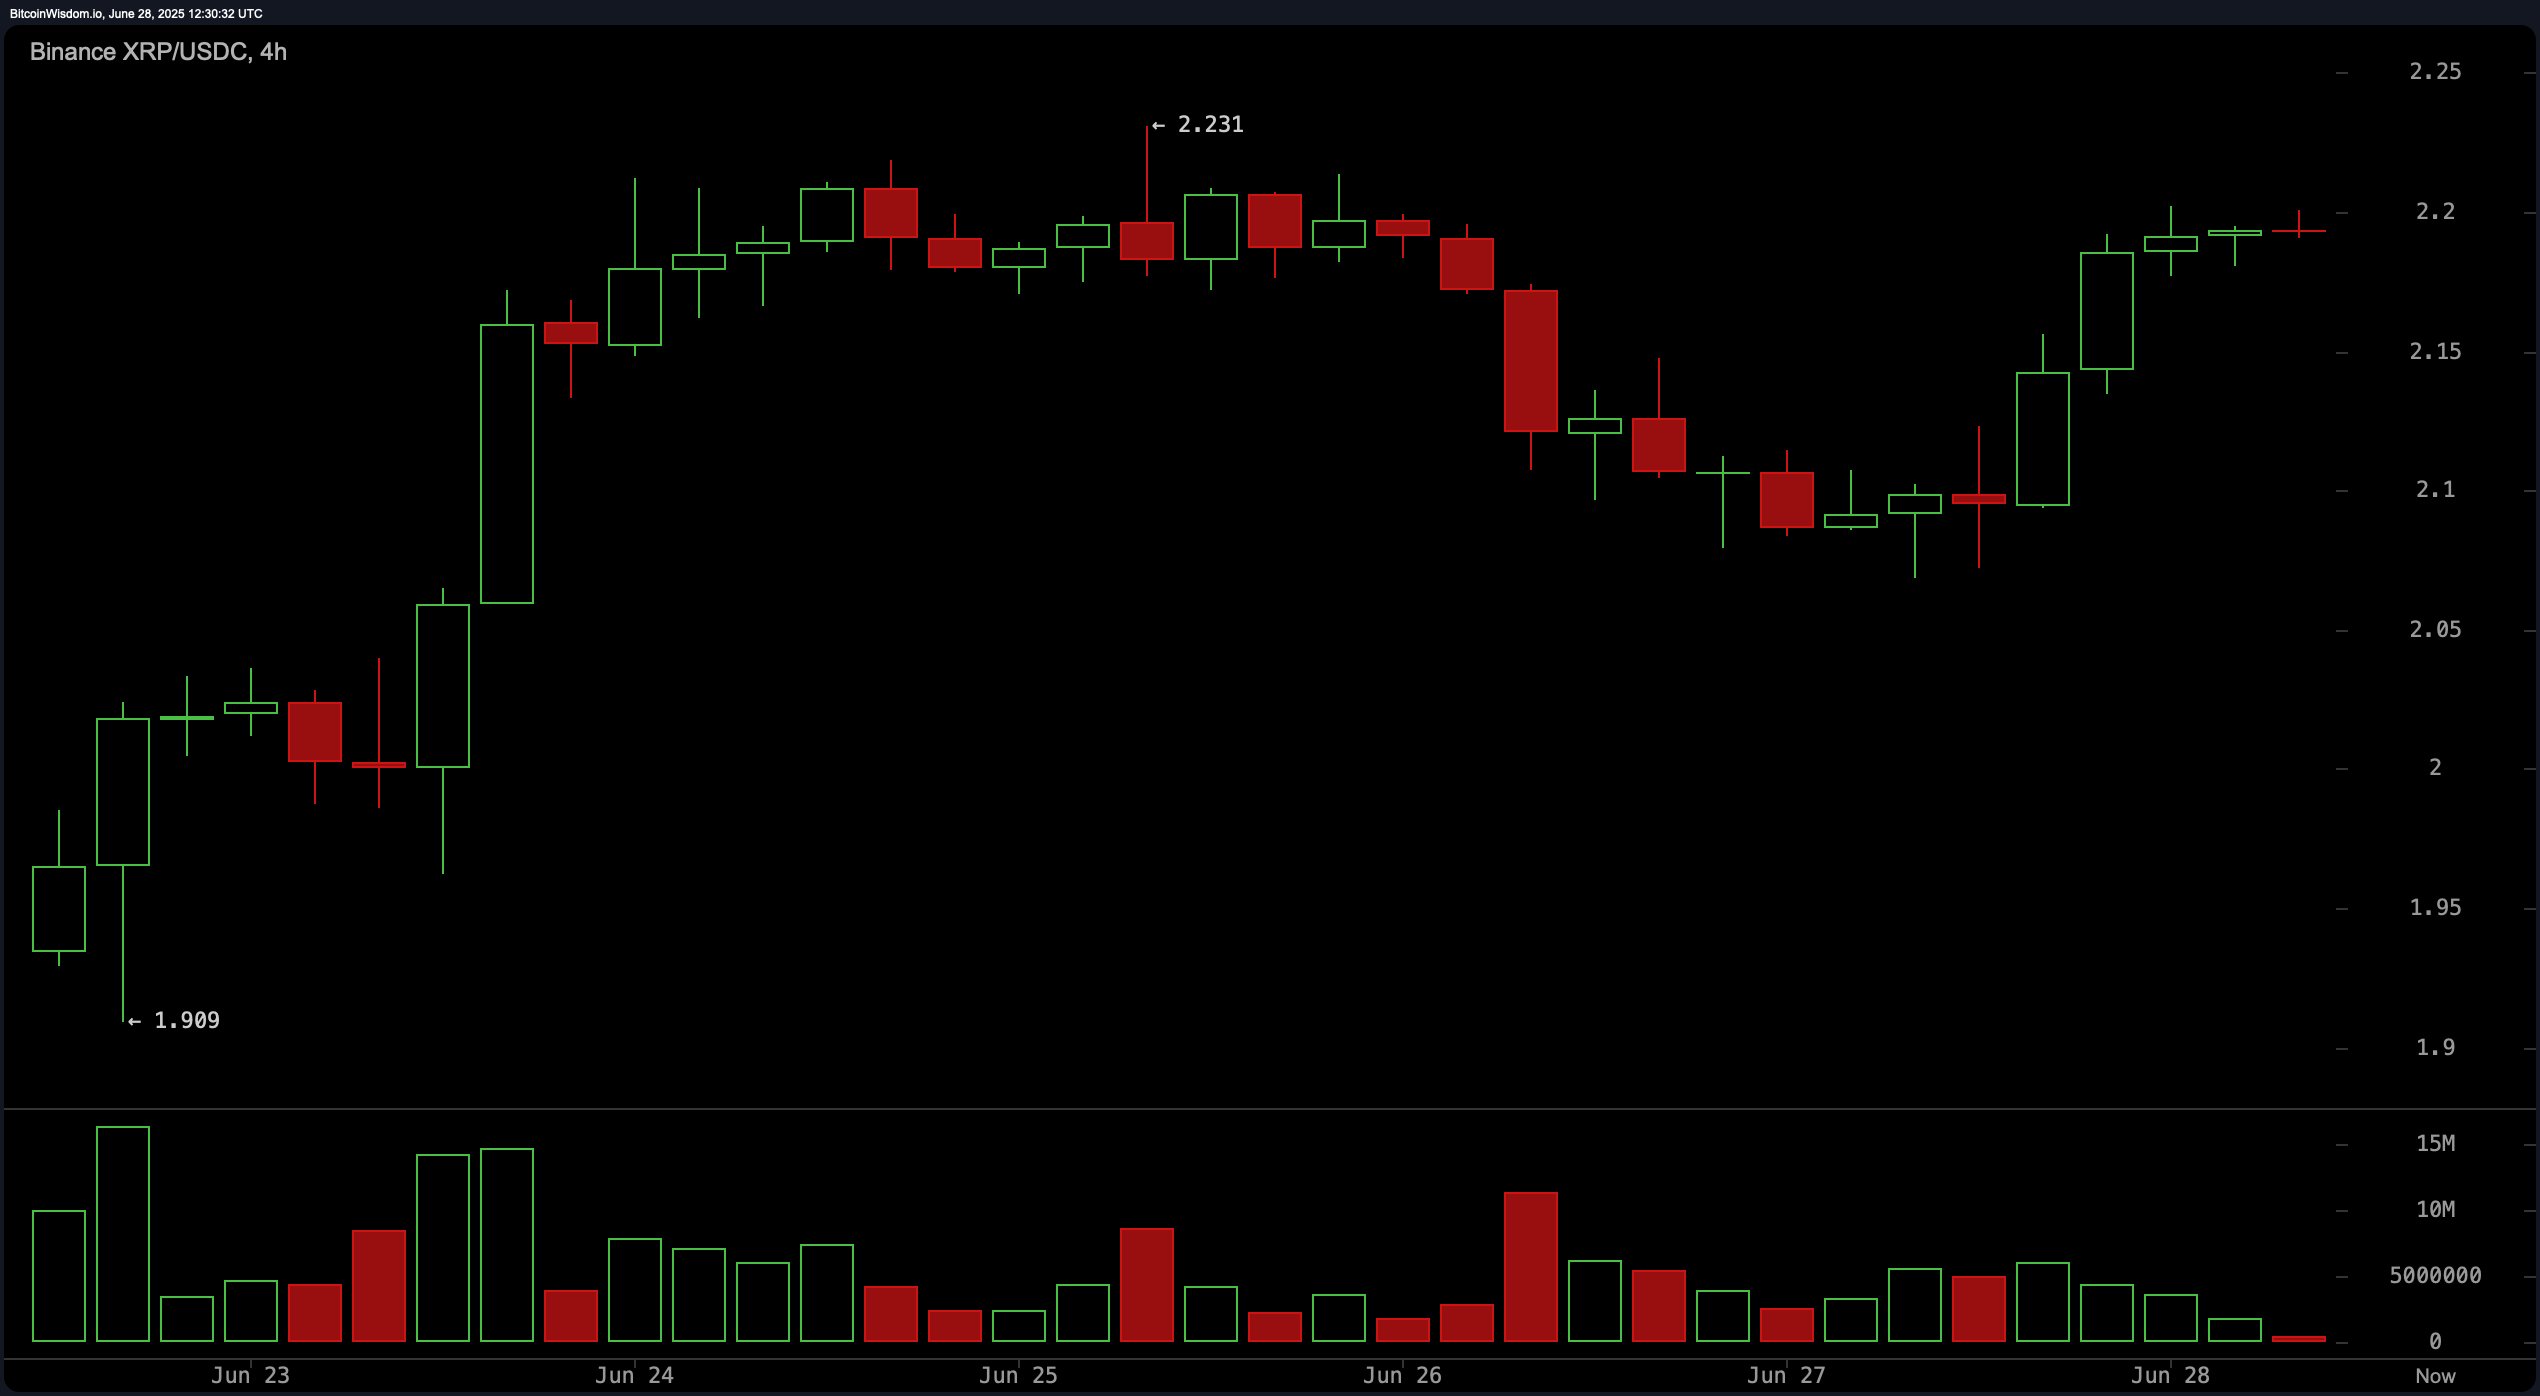
The 4-hour chart supports the view of a recovery pattern from recent local lows, establishing a mild upward trajectory. XRP has formed consistent higher lows near $2.07, breaking out above the $2.20 level with diminishing but still positive volume. Traders may consider entries on slight pullbacks to the $2.12 to $2.15 range, aiming for resistance near $2.23 to $2.25. A stop-loss of just under $2.08 provides an appropriate risk buffer for mid-term positioning.

XRP/USDC via Binance on June 28, 2025, 4-hour chart.
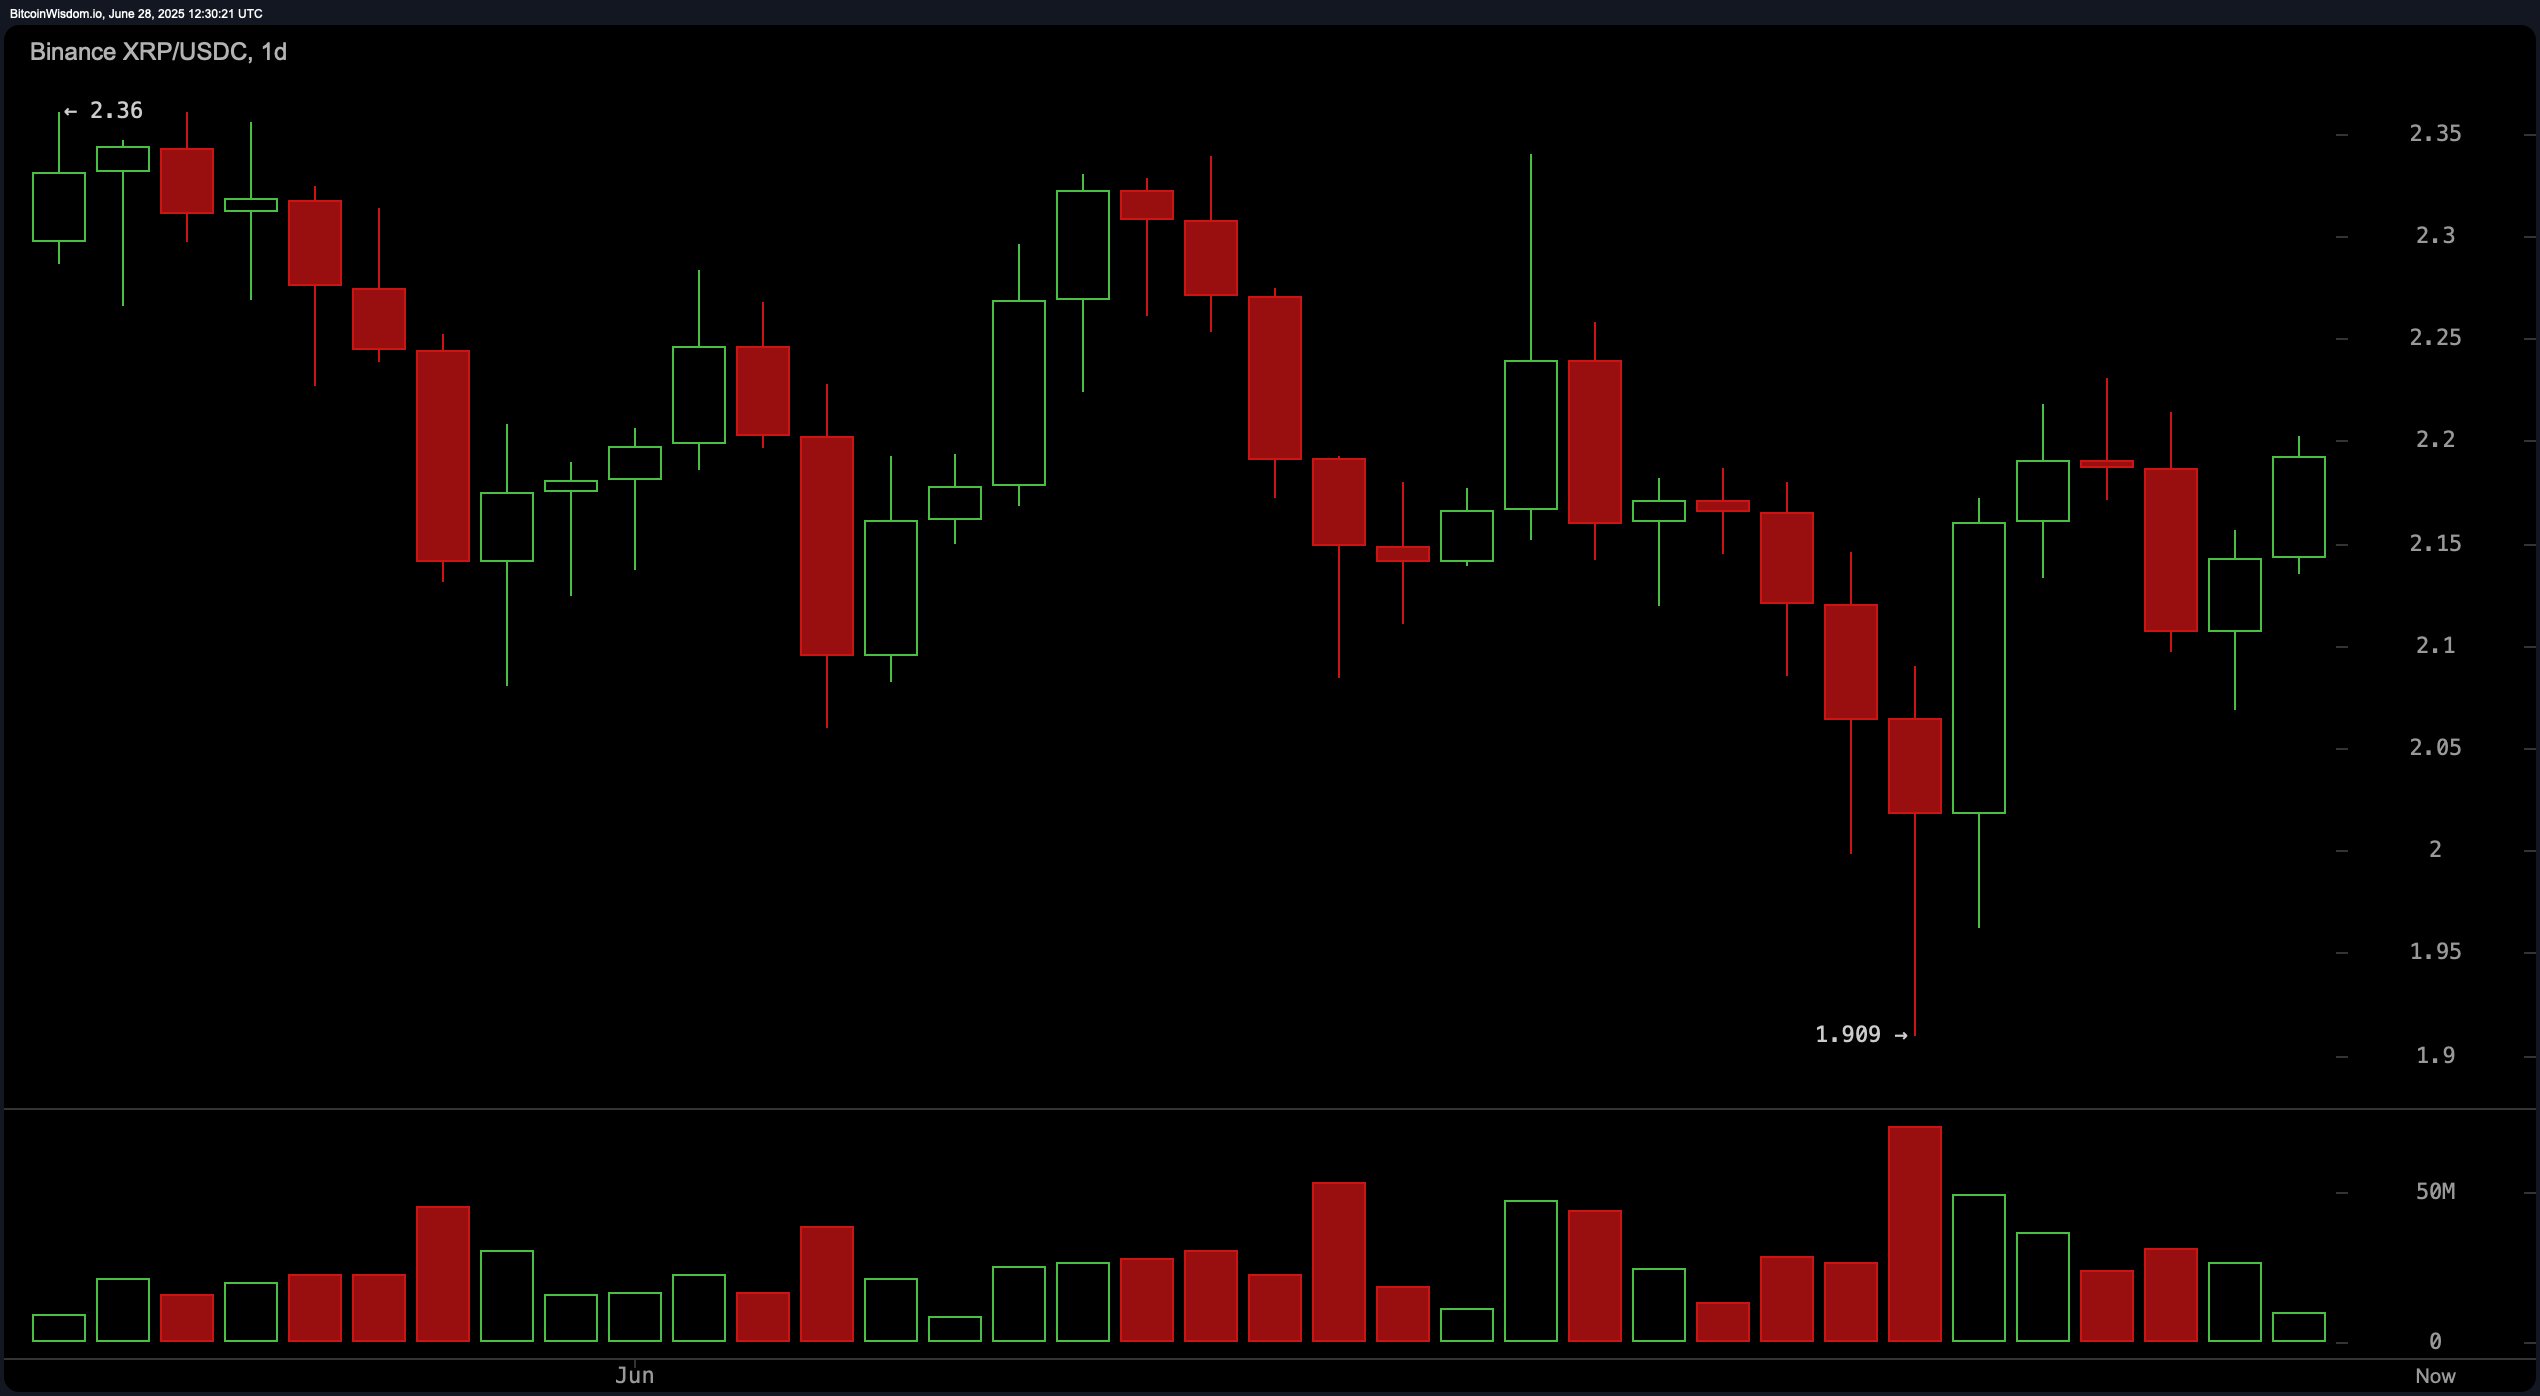
Daily chart analysis reveals a sideways-to-bearish structure, with signs of a possible rebound. The $1.90 support level has held firm, while resistance has proven strong near $2.36 following a failed breakout. Recent green candles and increased volume signal growing buyer interest. Swing or position traders could consider entries between $2.00 and $2.05, with exit targets ranging from $2.25 to $2.30. A stop-loss below $1.89 would be warranted in this scenario.

XRP/USDC via Binance on June 28, 2025, daily chart.
Technical oscillators mostly indicate neutrality, with the relative strength index (RSI) at 50.87, the Stochastic oscillator at 55.45, the commodity channel index (CCI) at 7.47, the average directional index (ADX) at 15.29, and Awesome oscillator at -0.025—all suggesting a market in equilibrium. However, the momentum indicator at 0.01996 and the moving average convergence divergence (MACD) level at -0.02391 both issue positive signals, hinting at underlying bullish potential.
A mixed reading emerges from XRP’s moving averages (MAs) on Saturday. Short-term averages are bullish, including the 10-period exponential moving average (EMA) at $2.15275 and simple moving average (SMA) at $2.13441, as well as the 20-period EMA at $2.16759 and SMA at $2.17289. Likewise, the 30-period EMA and SMA at $2.18481 and $2.17670 respectively also support a bullish bias. Conversely, longer-term indicators lean bearish: the 50-, 100-, and 200-period EMAs and SMAs reflect a mixed trend, with the 200-period EMA at $2.09941 still showing optimism, while others indicate negative signals, such as the 50-period SMA at $2.26111 and 200-period SMA at $2.36830.
Bull Verdict:
Short-term momentum indicators and moving averages lean bullish, particularly on the 1-hour and 4-hour charts, where higher lows and increasing buyer interest suggest further upside potential. Provided XRP holds support above $2.16 and maintains buying volume, a move toward the $2.25 resistance zone appears likely in the near term.
Bear Verdict:
Despite short-term strength, XRP faces notable overhead resistance and mixed signals from long-term moving averages. Failure to hold critical support levels around $2.16 or a drop below $2.08 could invalidate the bullish structure and potentially signal a return toward the $2.00–$1.90 support range.
免责声明:本文章仅代表作者个人观点,不代表本平台的立场和观点。本文章仅供信息分享,不构成对任何人的任何投资建议。用户与作者之间的任何争议,与本平台无关。如网页中刊载的文章或图片涉及侵权,请提供相关的权利证明和身份证明发送邮件到support@aicoin.com,本平台相关工作人员将会进行核查。


