
A few days ago, the news mentioned a ceasefire, and the gentleman also reminded that it is basically unlikely to start easily and end difficultly. Then, very unreliable news today stated that the Israel-Palestine conflict may soon reignite; the world is just a makeshift stage.
On another news front, according to the Securities Times, as of June 24, 2025, the Hong Kong Securities and Futures Commission has disclosed that a total of 40 institutions have been approved to provide virtual asset trading services through comprehensive accounts, including 38 brokerages, 1 bank, and 1 internet company. It’s just a step away from directly announcing Bitcoin as legal.
The Nasdaq and S&P 500 indices in the US stock market are about to hit new highs, just a few points away, while the Dow Jones index still has some room to grow. Therefore, the US stock market is also exceptionally strong. If 0.886 is completed, then we should pay attention to whether the next 1.13 will show a reversal; it is very crucial that it does not fall back down. If it doesn’t fall back, there is no risk.
Bitcoin
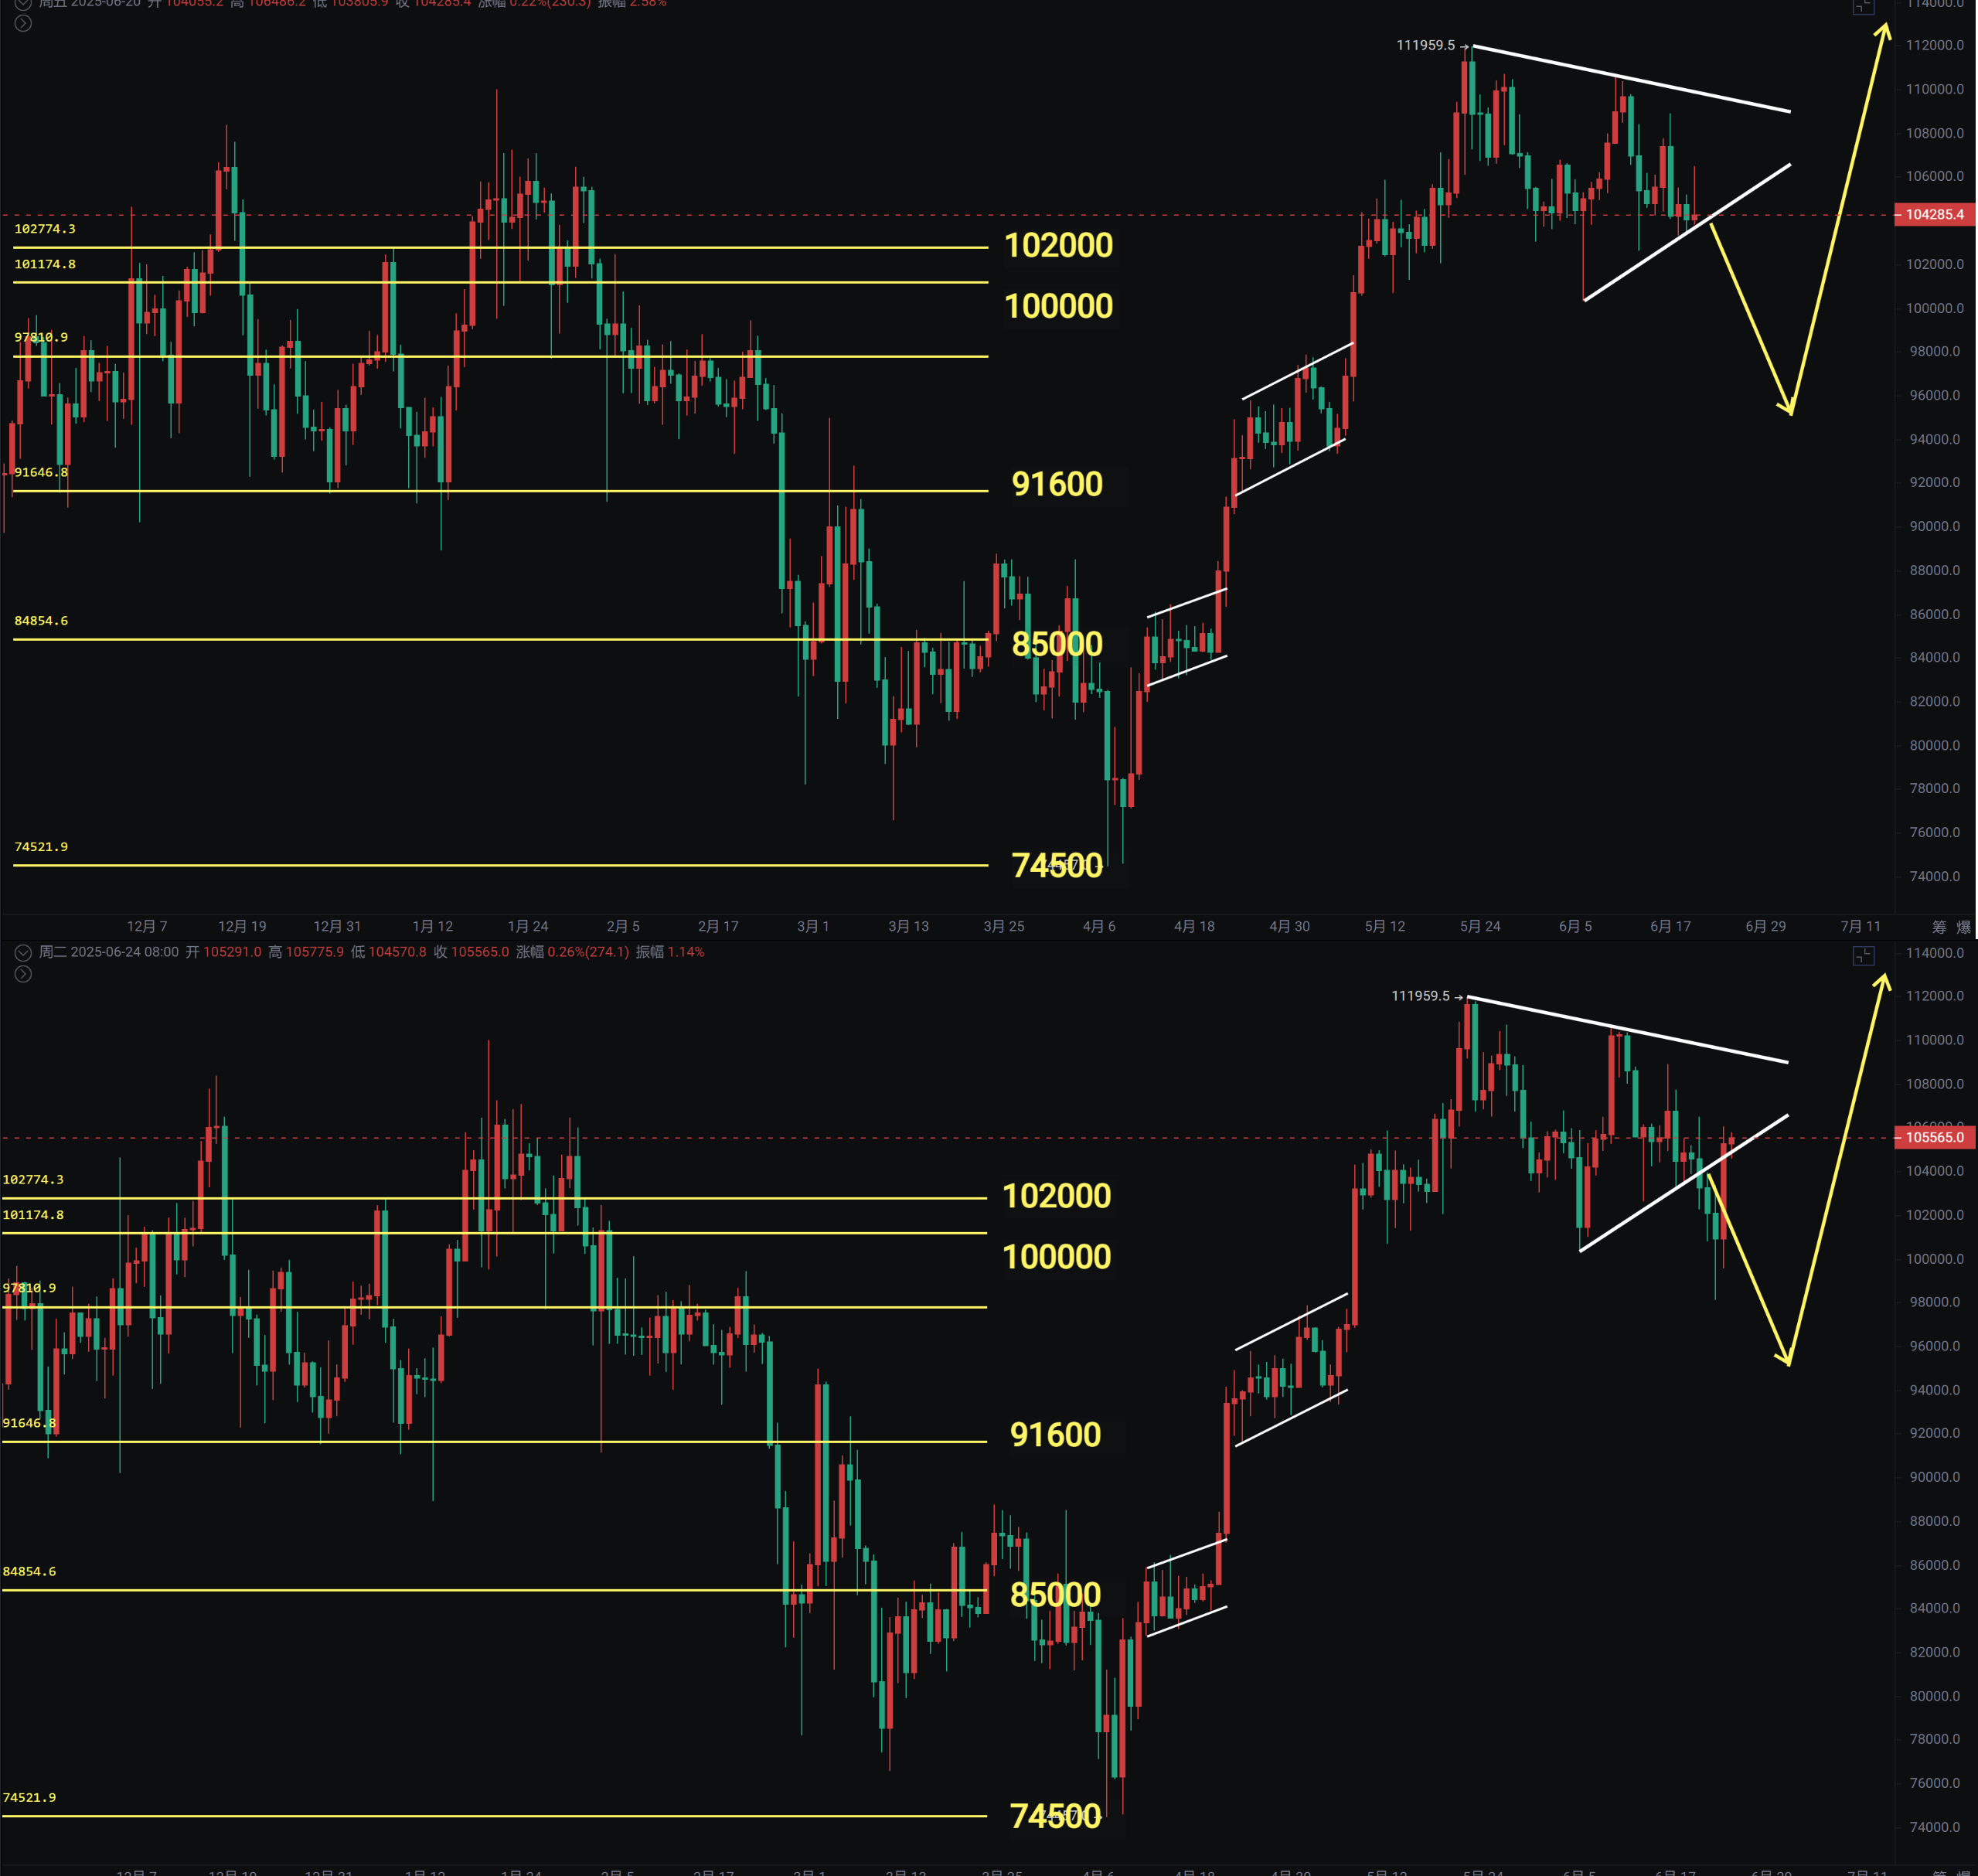
Bitcoin's daily chart has formed a rising flag pattern, and the current price is under pressure below the upper line at 108,272. This situation is somewhat similar to last year's six-month fluctuation. The price is above the three moving averages. The MACD shows a bottom divergence crossing the zero axis, and the RSI shows signs of a breakout.
Currently, Bitcoin is in a flag pattern, and if it can break through the previous high, there is a chance to reach 135,000. The monthly and weekly lines are about to close, with the weekly line showing an engulfing pattern while the monthly line is still a doji star, indicating a high probability of bullish movement in the future.
Support: 102,800—104,000
Resistance: 110,000—112,000—135,000
Ethereum
Ethereum dropped to a low of 2,111 and rebounded back into the range of 2,300—2,400. The 4-hour downtrend line has been broken. Ethereum is expected to catch up in the rally, returning to the top of the range around 2,700—2,800.
2,800 serves as the dividing line between bulls and bears. The recent breakout to 2,879 and subsequent drop back is actually testing the pressure at this line. Both the monthly and weekly lines have opportunities to rise, and we remain optimistic about the chance to break through to 3,300—4,000.
Support: 2,111—2,200—2,375
Resistance: 2,730—2,879—3,300

If you like my views, please like, comment, and share. Let’s navigate through the bull and bear markets together!!!
The article is time-sensitive and for reference only; it is updated in real-time.
Focusing on K-line technical research, sharing global investment opportunities. Public account: BTC Trading Gentleman Fusu

免责声明:本文章仅代表作者个人观点,不代表本平台的立场和观点。本文章仅供信息分享,不构成对任何人的任何投资建议。用户与作者之间的任何争议,与本平台无关。如网页中刊载的文章或图片涉及侵权,请提供相关的权利证明和身份证明发送邮件到support@aicoin.com,本平台相关工作人员将会进行核查。


