No matter how life is, we must hold onto hope and face it with a positive attitude. Let us greet the challenges of life with a smile and depict our own wonderful life with our hearts. Because both the beauty and the difficulties of life will become the steps for our growth, making us stronger, braver, and more mature!
The market has performed slightly worse than expected. According to yesterday's plan, we anticipated a bullish trend that should reach above 107,000, but it fell short. Currently, the high point of the market rebound is around 106,800. I wonder if any friends have taken short positions. Our operation was to short above 107,000, and we placed our orders before going to sleep, but the short position was not filled. Now, based on the situation, it seems the market is starting to resemble the other type of oscillating upward trend we discussed yesterday, so we need to adjust our operations accordingly.
Returning to the market, in a fluctuating upward trend, although some of the liquidity accumulated here has been cleared, the movement is not characterized by a rapid surge followed by a pullback, and it has not directly reached above 107,000, leaving the short liquidity here not fully cleared. In the current indecisive market, recent short liquidity has begun to gather again around 108,000, while there has also been an increase in long liquidity near 104,000. As we analyzed yesterday, the ideal scenario we envisioned was for the market to rise and clear the recent short liquidity, then pull back to confirm support, allowing for a subsequent rise, even breaking historical highs. This could be the most perfect trend we imagined. However, the first wave of upward clearing has occurred, but it is not clean. Although it has reached the clearing area, it has not been fully cleared, and with the continued increase in shorts, it is typical of shorts trying to save themselves, which makes the market more inclined to operate in a fluctuating manner, forming a short squeeze. In the meantime, if the spot premium index rises, it indicates buying pressure from the spot side, making further upward clearing inevitable. This is simple because, in the current market, the strength from the spot side can better determine the market direction.
From a technical perspective, there is not much to say about the daily chart. In the rebound, the K-line shows a bullish arrangement and is operating above the moving averages. At the same time, the indicators also reflect a bullish upward trend. The MACD is about to enter a bullish cycle after being in a bearish cycle for a long time. It is still important to note that after the MACD enters a bullish cycle, the issue of upward momentum after being consumed by bears for a long time needs attention. So far, I personally still hold the view that even if it breaks the high point, it is unlikely to go very high. The bullish trend is more evident in the daily chart in the short term, and we just need to wait for expectations to gradually unfold.
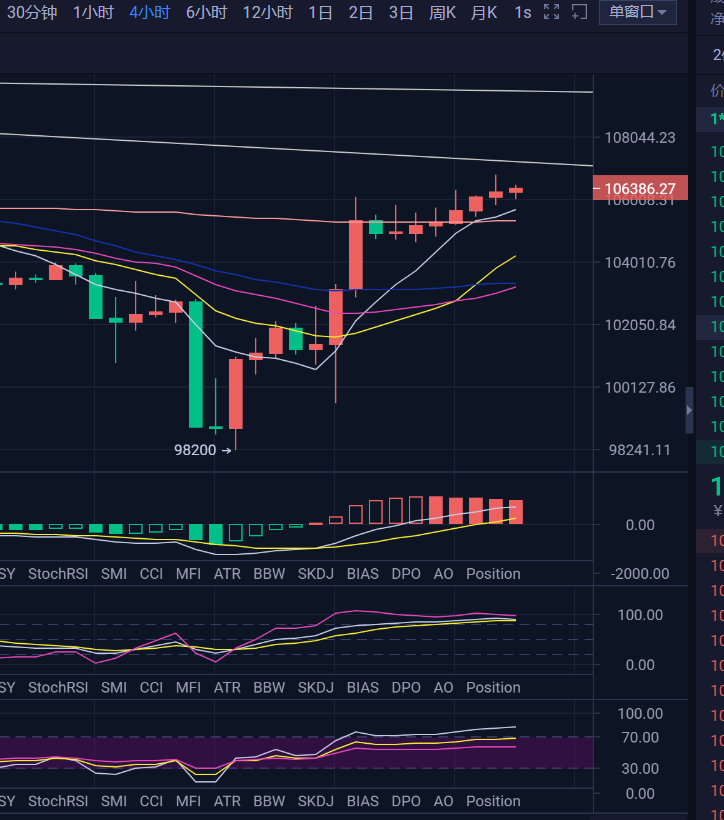
On the four-hour chart, the rebound has entered a high position and is close to the previously formed downward trend line. Additionally, there was considerable liquidity clearing strength at the trend line position yesterday, which is why we judged to set up shorts when it first approached the trend line. Now looking at the four-hour chart, the K-line has continuously closed positively, and the highs are rising. At the same time, the technical indicators show that the MACD is clearly in a bullish high position, indicating a need for a pullback to repair the indicators. If the oscillation continues, it should provide an opportunity to enter long positions. The current short-term support is around 105,300.
In terms of operations, on the short-term side, if it falls back to around 105,300 during the oscillation, we can participate in a short long position upon the first touch. If it tests again and breaks down, we will need to consider clearing long liquidity downwards, which would require setting up longs below 104,000. On the upside, if it first touches around 107,200 during the oscillation, we can participate in a short position. For upward clearing, we need to set up shorts above 108,500. For short-term operations, participating once is sufficient.
Ethereum is not as strong as Bitcoin. In terms of the upcoming trend, we will first maintain a short position around 2,500, while considering a short long position around 2,380 during a pullback. Currently, we are operating Ethereum on a short-term basis, and if we encounter rapid market movements, it is more suitable for trend setups.
【The above analysis and strategies are for reference only. Please bear the risks yourself. The article is subject to review and publication, and market conditions change in real-time. The information may be outdated, and strategies may not be timely. Specific operations should follow real-time strategies. Feel free to contact us for discussions on the market.】

免责声明:本文章仅代表作者个人观点,不代表本平台的立场和观点。本文章仅供信息分享,不构成对任何人的任何投资建议。用户与作者之间的任何争议,与本平台无关。如网页中刊载的文章或图片涉及侵权,请提供相关的权利证明和身份证明发送邮件到support@aicoin.com,本平台相关工作人员将会进行核查。


