
Today's most notable news is that the U.S. has taken action, and the specifics are likely clear to everyone. This marks the official start of the "Third World War."
Lu Qiyuan analyzed the global situation before Trump's presidency, pointing out that Trump's main goal is to take military action against Iran, thereby pushing oil prices up to $150 - $200, benefiting traditional industries in the U.S. such as military and petrochemicals, while also favoring Russia. This action will impact Europe and Japan/South Korea, putting pressure on inflation in China, but China can buffer this with its development of new energy and energy reserves. Additionally, it is speculated that Trump may impose military control over Mexico to promote its industrialization and reconstruct the U.S. industrial chain, even reducing external resistance through deals (like "giving the second child to the first child, and Taiwan to the panda"). If these plans succeed, Trump could solidify his historical position and extend his time in office. However, these are merely unverified speculations.
Therefore, we have always emphasized not just listening to what others say, but focusing on what they do. For instance, Buffett has been selling stocks and still holds a large amount of cash. In the long run, localized conflicts or even the "Third World War" will not easily come to an end in a short time, and the safe-haven roles of gold and Bitcoin will become increasingly significant.
Bitcoin
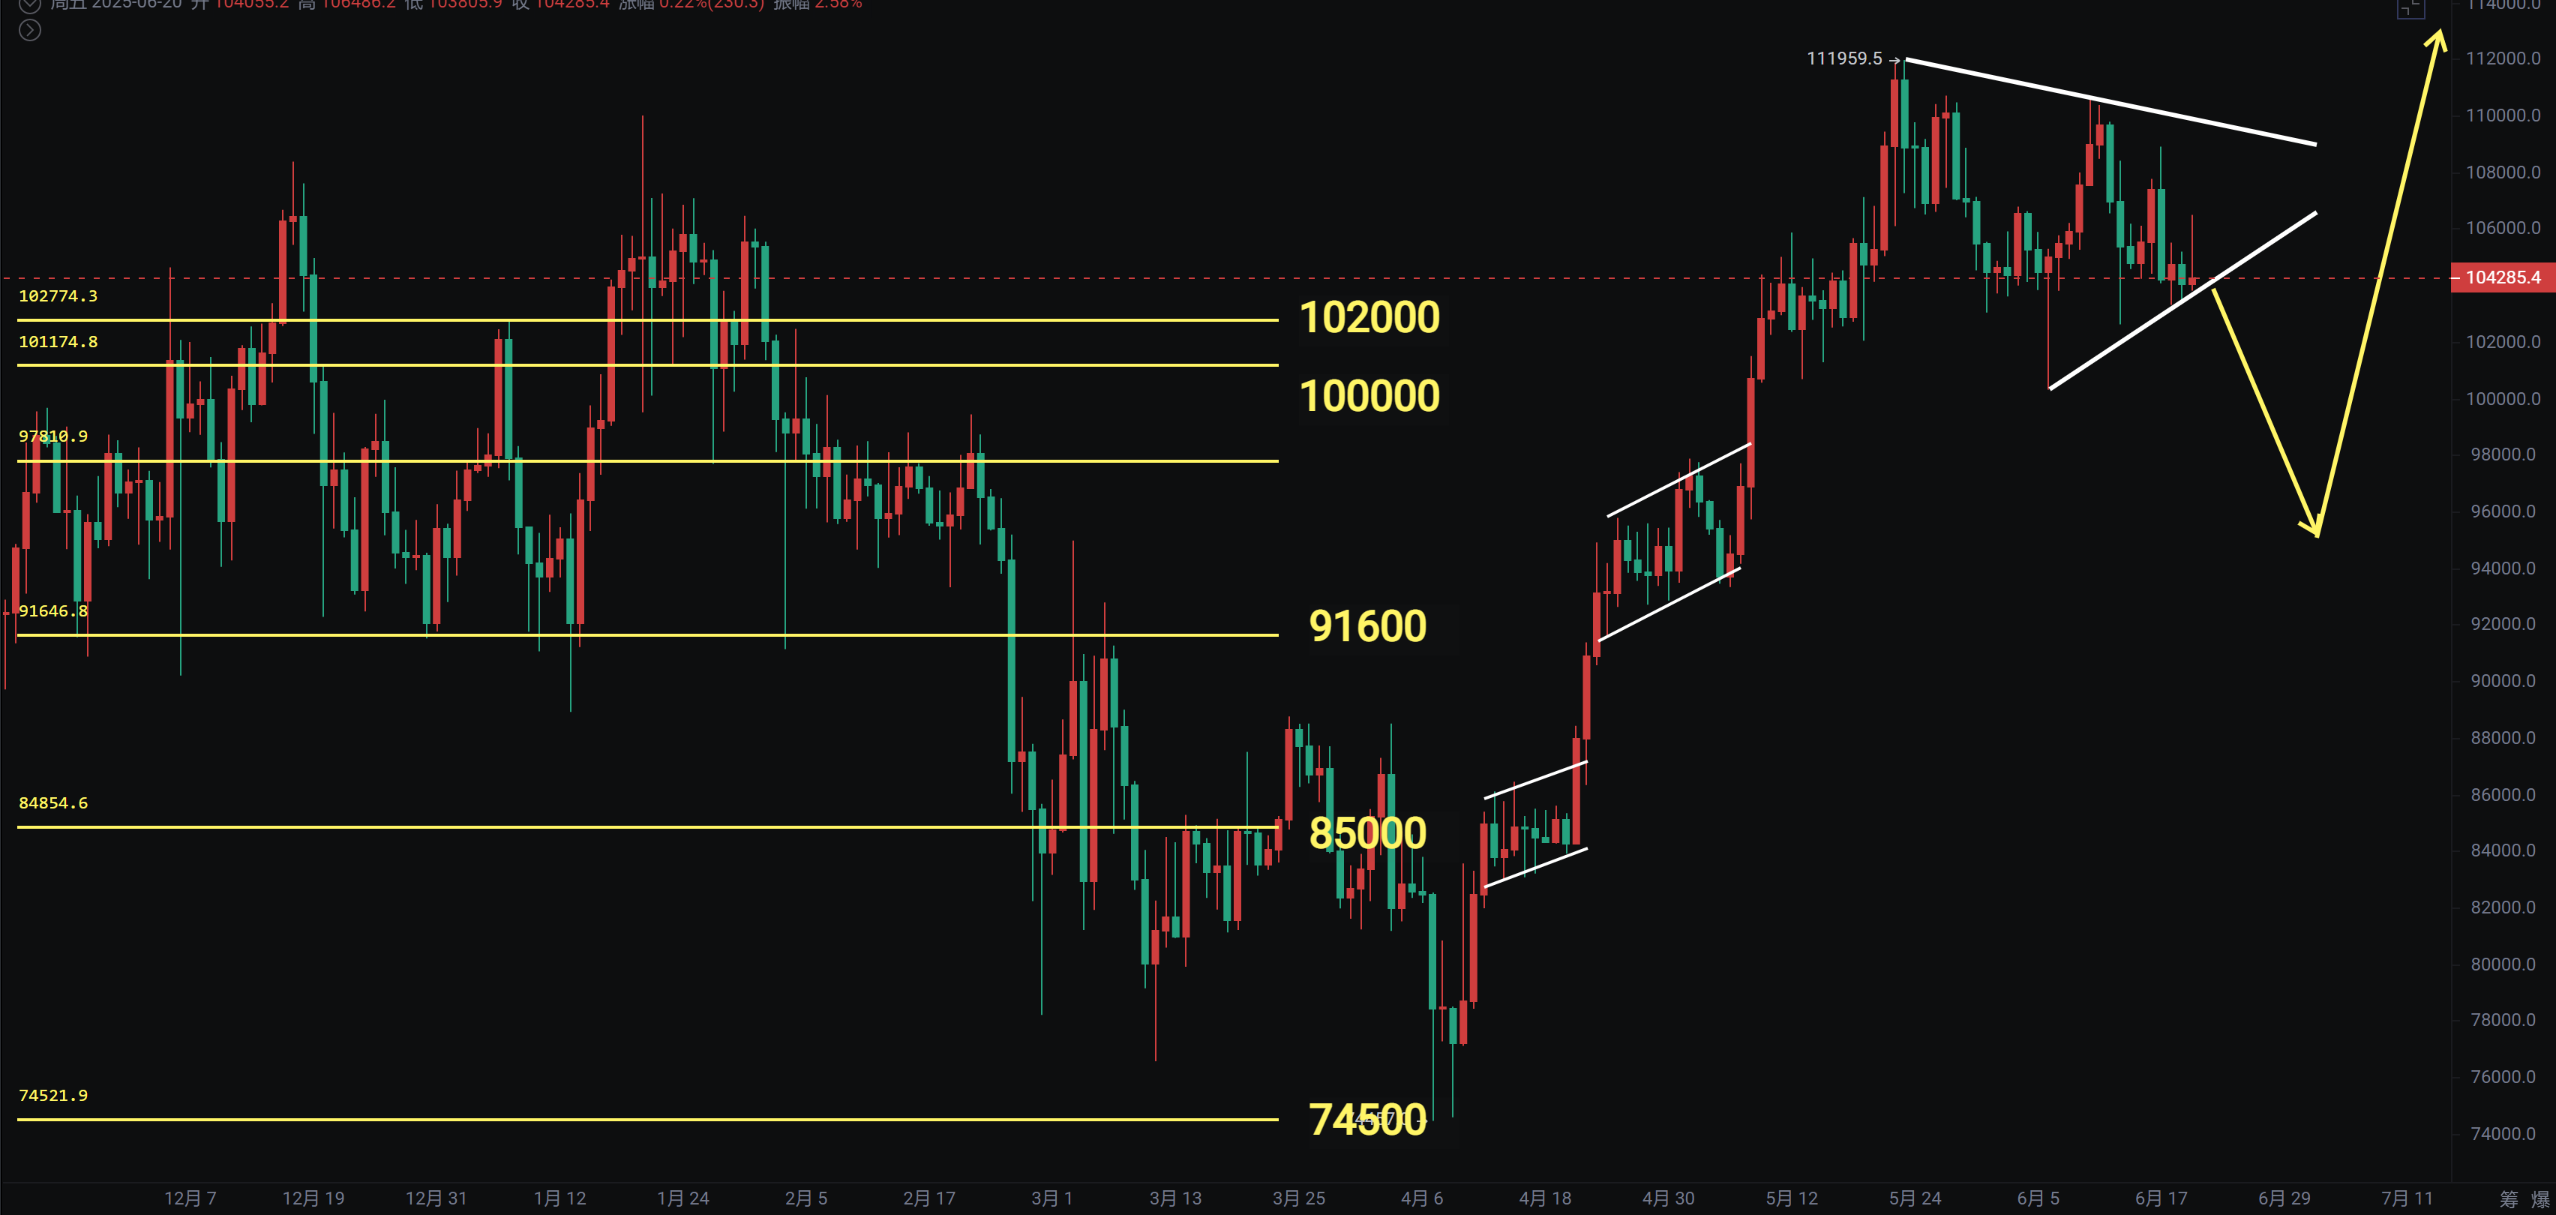
As of the time of writing, Bitcoin has dipped to 99,000. A couple of days ago, I reminded that the daily chart maintains a converging triangle with a risk of further decline. I mentioned earlier that 98,000 to 94,000 could be a good bottom-fishing opportunity, which is still worth looking forward to. This evening, Bitcoin accelerated its drop below 100,000. After breaking the entire upward trend, it has formed a downward ABC wave, with the CME gap at 97,000 and the weekly Bollinger middle band at 94,000. Therefore, I have been reminding that there is a chance to retest the Bollinger middle band, and even a spike situation may occur.
The daily MACD's bottom divergence has failed, with the histogram continuing to extend below the zero axis, and the daily Bollinger bands opening downwards, extending the adjustment time. Thus, I have been reminding not to chase highs and to wait for a pullback to set up mid to long-term opportunities.
• Support: 94,000—98,000
• Resistance: 103,000—107,000—110,000
Ethereum
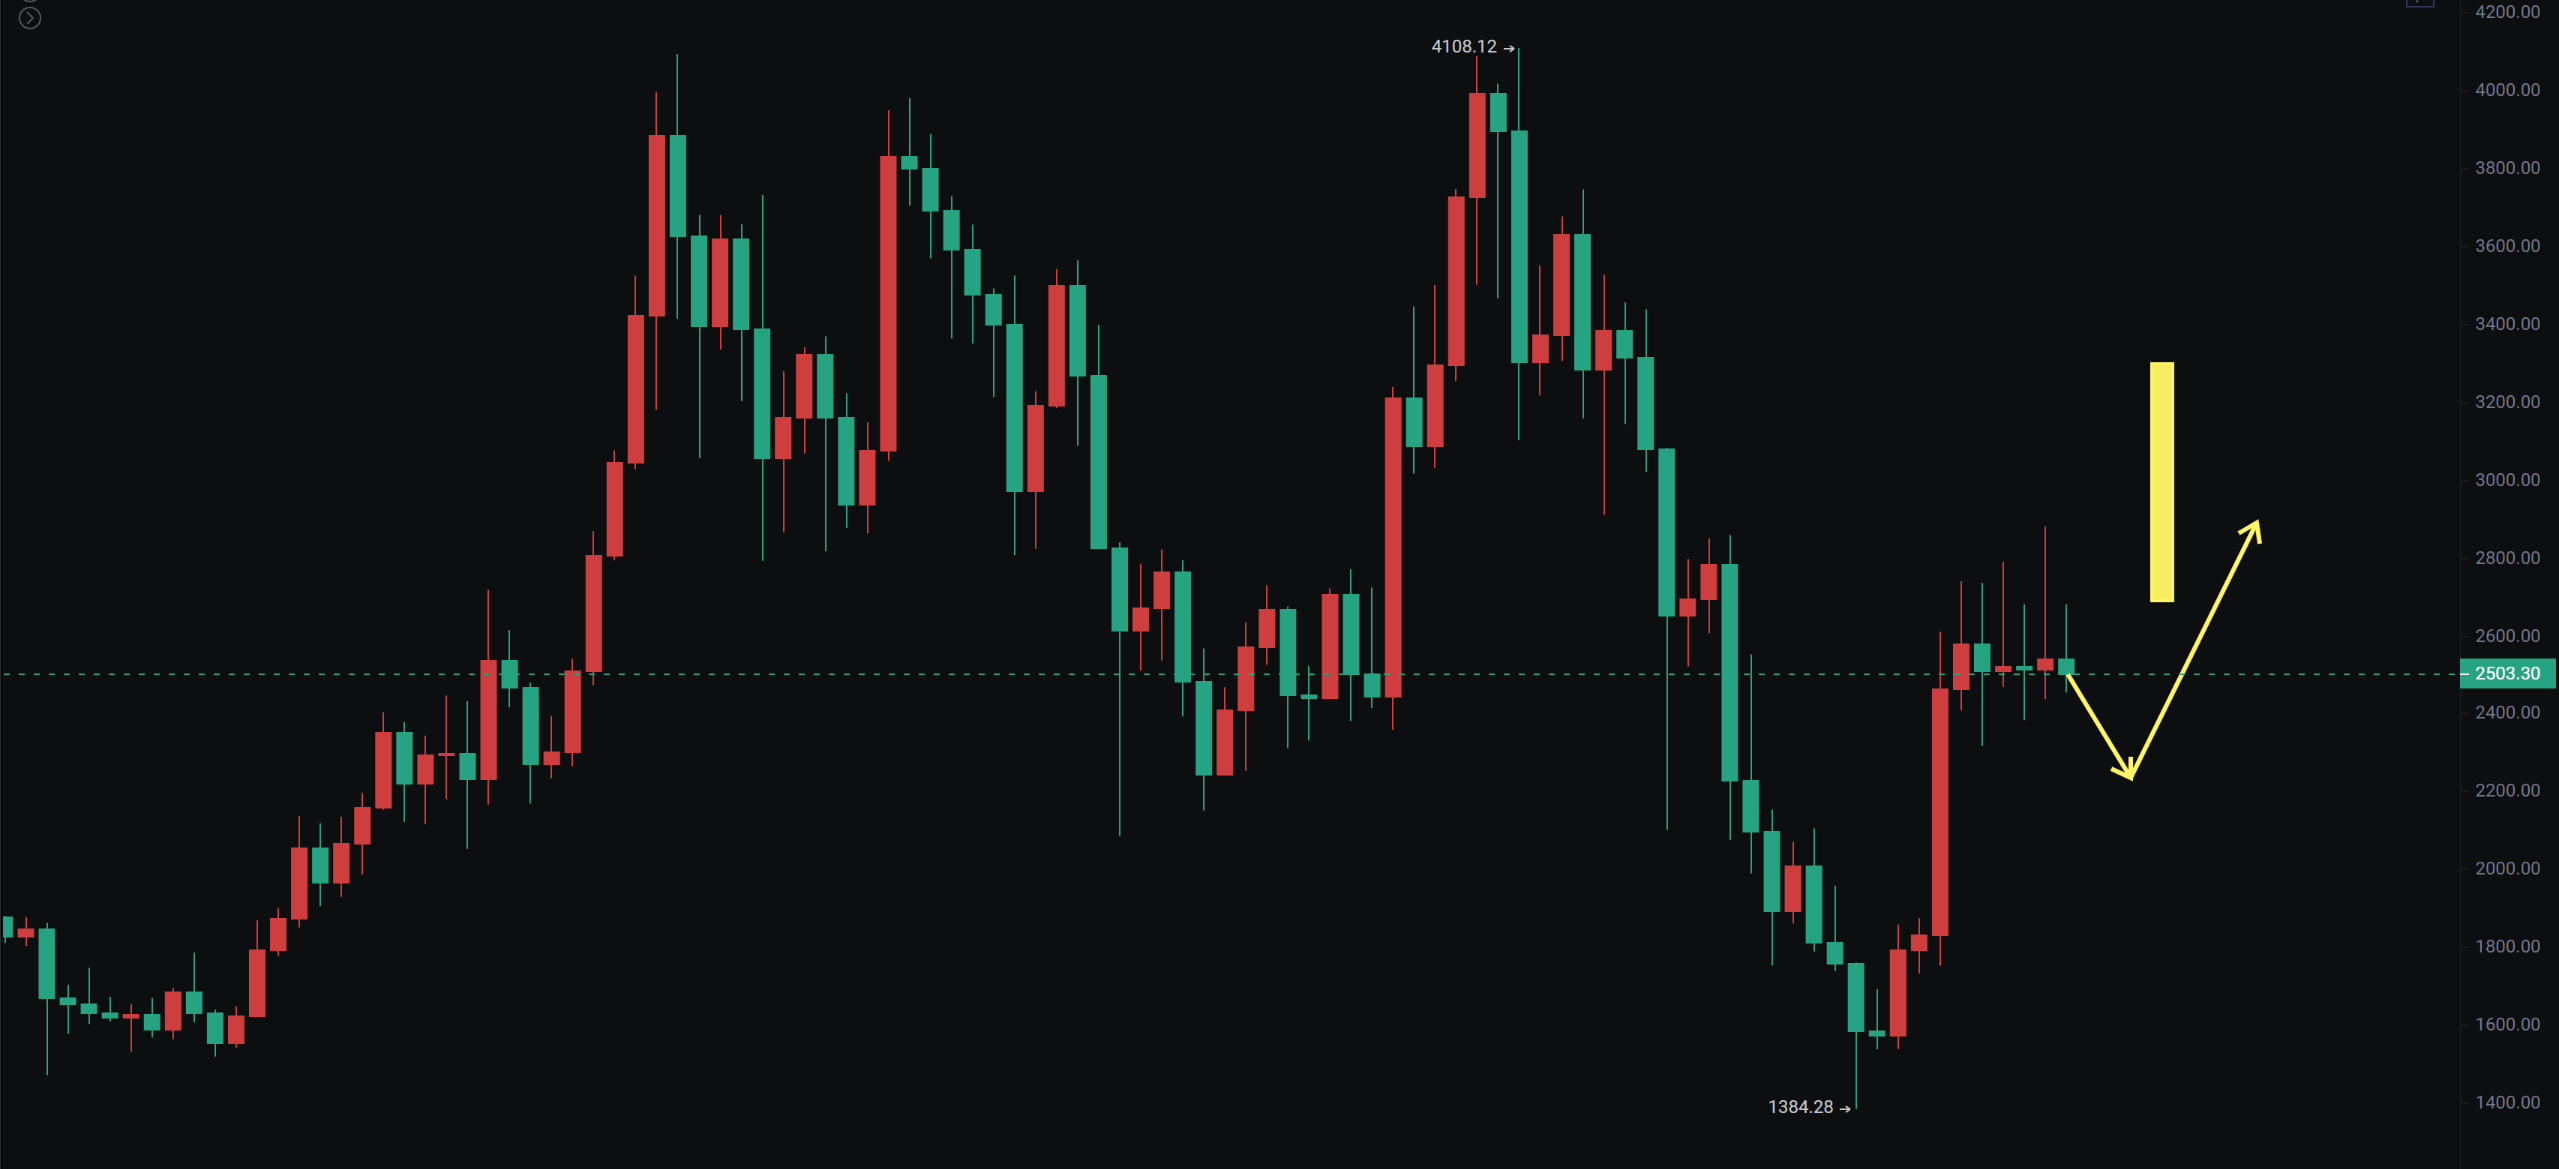
The weekly chart has formed five doji stars. I previously reminded that this is a "throw a brick to attract jade" pattern, and the overall outlook is bullish, but it should also be noted that it will follow Bitcoin's decline before rebounding. 2800 has always been the dividing line between bull and bear for Ethereum. After a narrow fluctuation for over forty days, it has also been dragged down by Bitcoin's market, with support at 2300 and 2200 both broken, hitting a low spike of 2155. This raises the possibility of a drop to the 1700—1800 range.
• Support: 1700—1800—1900
• Resistance: 2300—2879
If you like my views, please like, comment, and share. Let's navigate through the bull and bear markets together!!!
This article is time-sensitive and for reference only, with real-time updates.
Focusing on K-line technical research, sharing global investment opportunities. Public account: BTC Trading Prince Fusu

免责声明:本文章仅代表作者个人观点,不代表本平台的立场和观点。本文章仅供信息分享,不构成对任何人的任何投资建议。用户与作者之间的任何争议,与本平台无关。如网页中刊载的文章或图片涉及侵权,请提供相关的权利证明和身份证明发送邮件到support@aicoin.com,本平台相关工作人员将会进行核查。


