
Bitcoin is oscillating at a high level. In historical trends, maintaining high-level oscillation near previous highs is relatively strong. After a good adjustment at high levels, there is still an opportunity for further increases. Last year, it oscillated from March to September, then created a new high and oscillated for half a year. I have always been bullish, believing there is a chance for further increases. Currently, it has reached around 110,000, and the pullback has been relatively small, so from a broader perspective, I remain bullish. The daily chart has formed a converging triangle, with 100,000 being a key support level.
Ethereum's weekly chart has formed a five-week doji star, with a high reaching 2879. After forming two doji stars in the previous weeks, I felt it was a throw-brick-to-attract-jade pattern, and there is a chance to look towards 3300 or even 4000. Currently, it has been oscillating for five weeks, also under pressure around 2800.
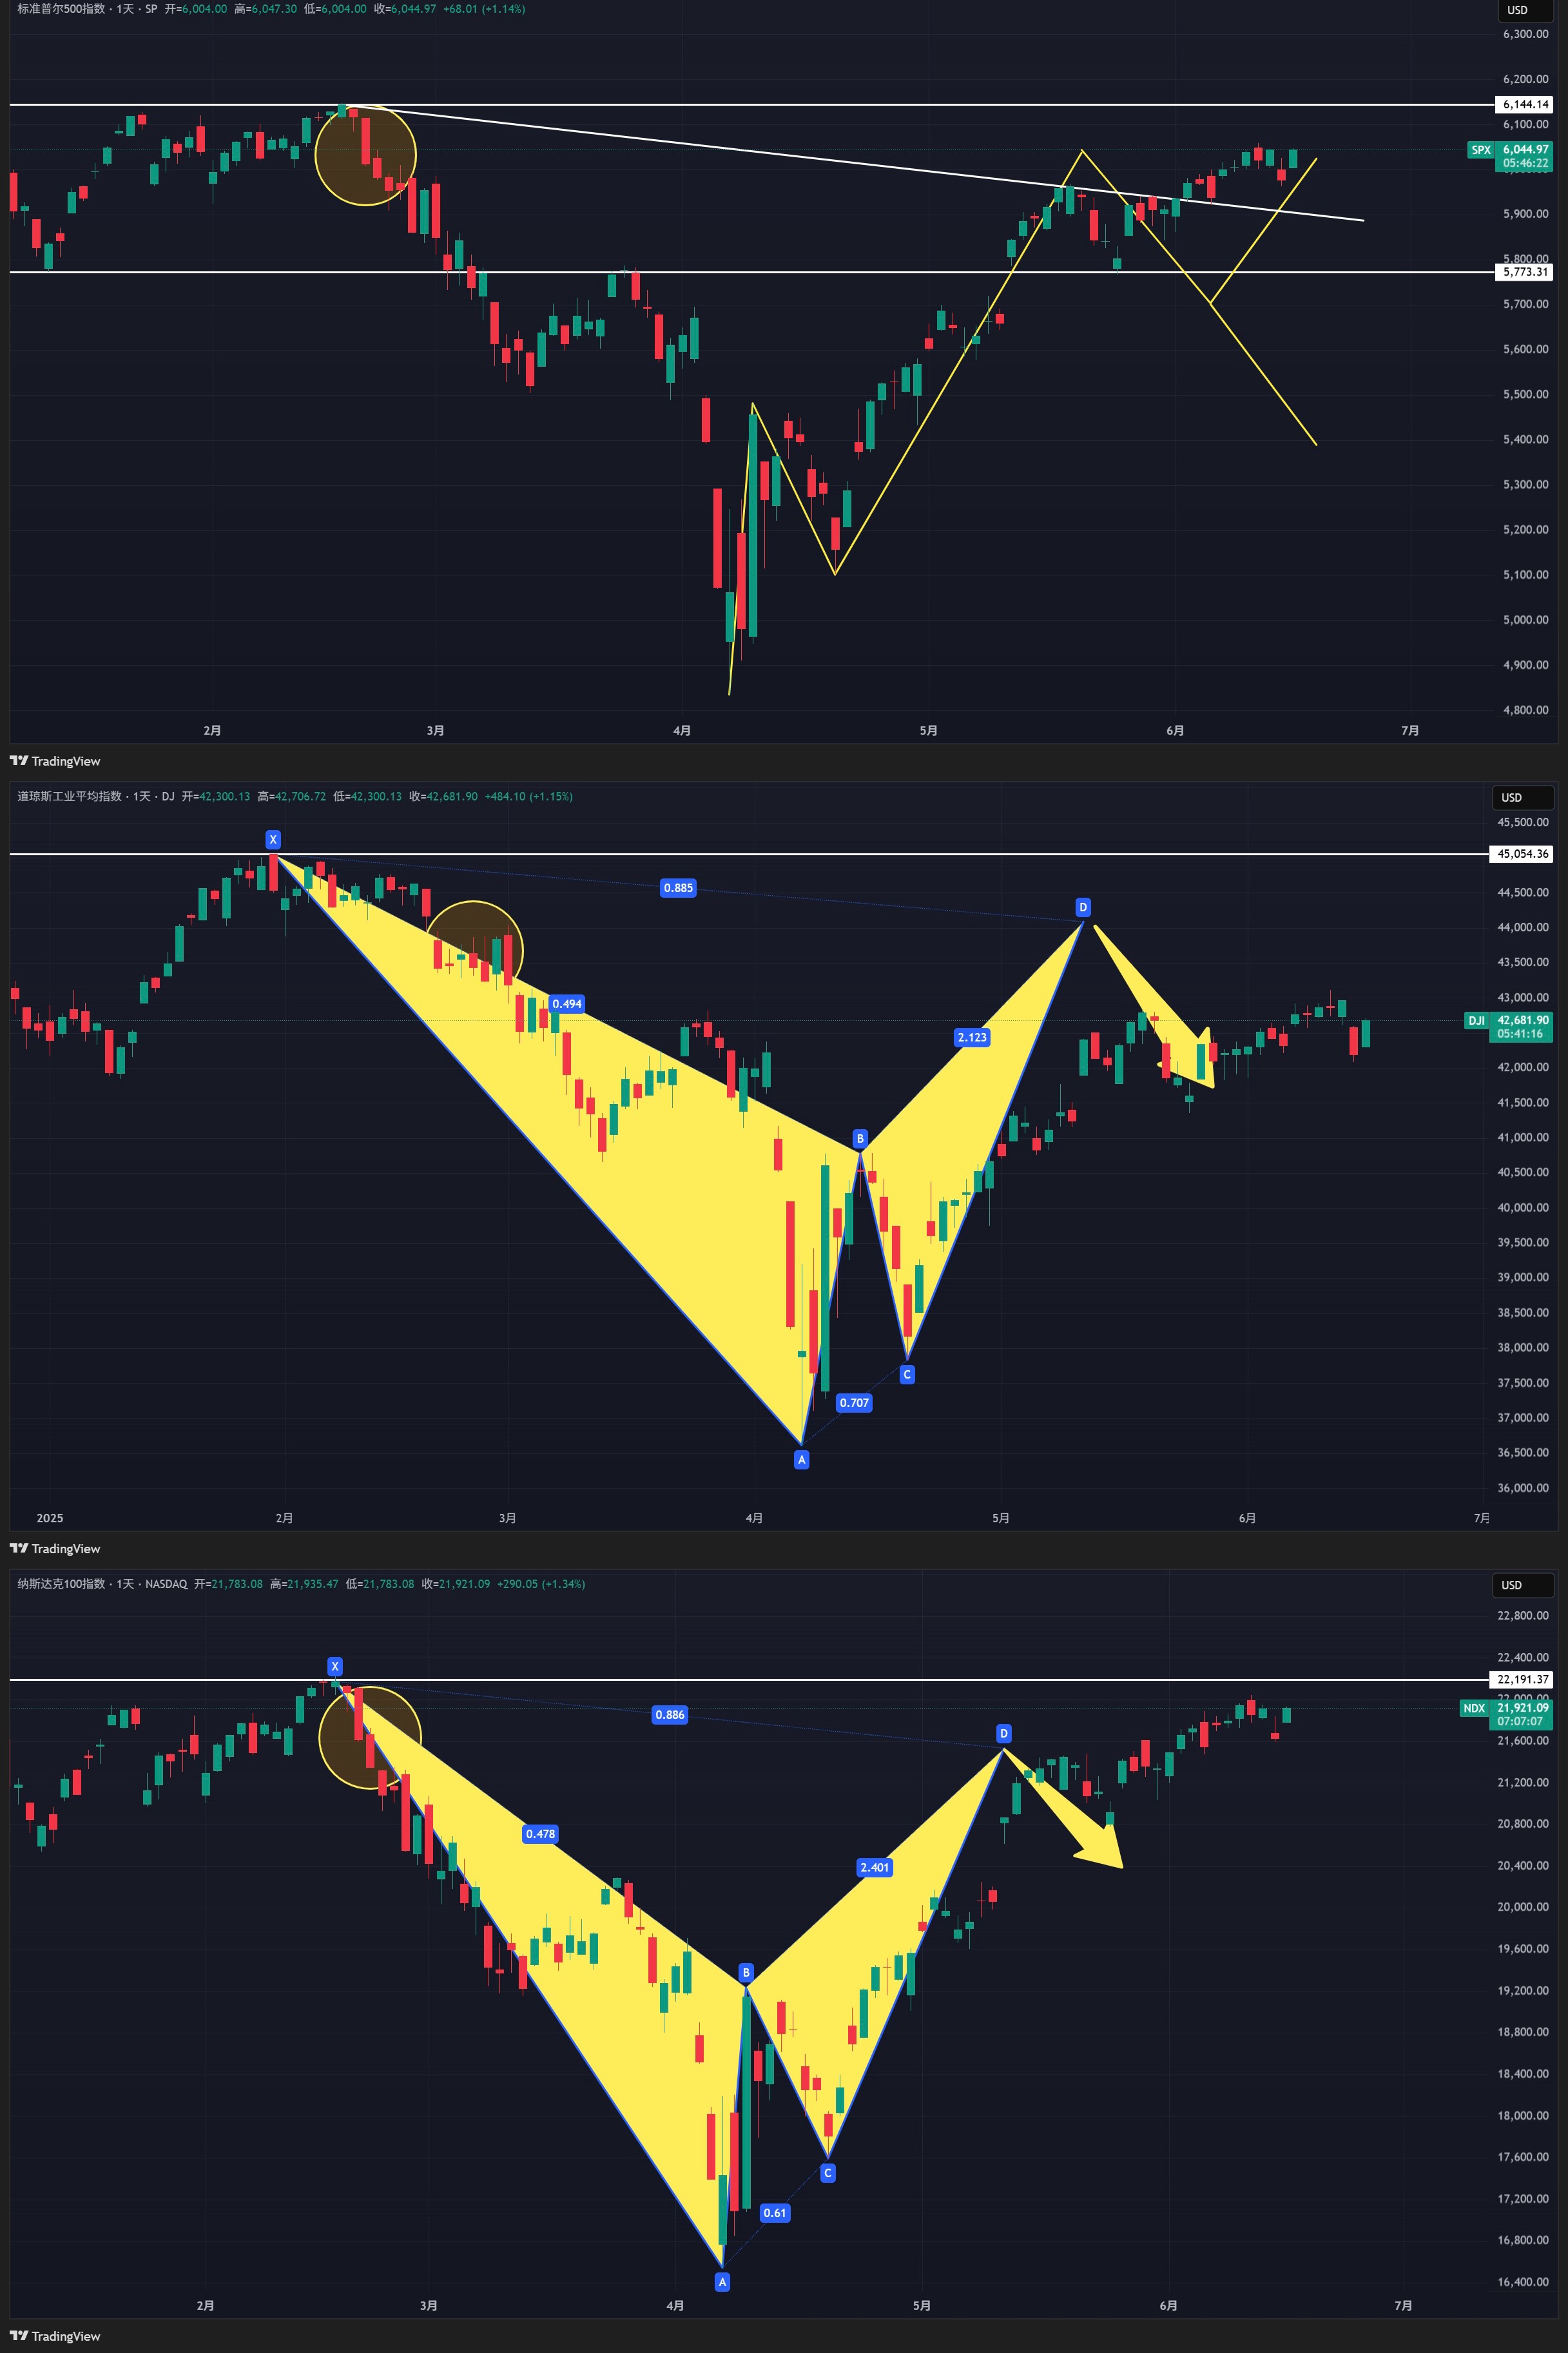
The performance of the US market is approaching previous highs. The Nasdaq and S&P 500 indices may challenge previous highs this week, while the Dow Jones Industrial Average still has some space to reach its previous high. If the US stock indices break through their previous highs, the entire pattern will change.
Bitcoin
The weekly chart continues to oscillate, and the daily chart has formed a converging doji star, with signs of a bullish divergence. Currently, the price is retesting 107,000. I remain bullish in the medium to long term, but short-term is leaning towards oscillation, with opportunities to dip to around 100,000 for gradual buying.
In terms of news, whether it is the escalating conflict between Iran and Israel or the potential for "civil war" in the United States, both have increased uncertainty, which is favorable for Bitcoin and gold.
Support: 100,000—102,000
Resistance: 110,000—112,000

Ethereum
Ethereum has oscillated between 2600 and 2800 for five weeks, with 2800 serving as the bull-bear dividing line. The weekly chart still shows a throw-brick-to-attract-jade pattern, currently oscillating between 2300 and 2800. After a good adjustment, there is still a chance to reach 3300 to 4000, a perspective I have consistently maintained.
Support: 2300
Resistance: 2879—3300—4000

If you like my views, please like, comment, and share. Let's navigate through the bull and bear markets together!!!
This article is time-sensitive and for reference only, updated in real-time.
Focusing on K-line technical research, sharing global investment opportunities. Public account: BTC Trading Prince Fusu

免责声明:本文章仅代表作者个人观点,不代表本平台的立场和观点。本文章仅供信息分享,不构成对任何人的任何投资建议。用户与作者之间的任何争议,与本平台无关。如网页中刊载的文章或图片涉及侵权,请提供相关的权利证明和身份证明发送邮件到support@aicoin.com,本平台相关工作人员将会进行核查。


