Original Author: Mary Liu, Cody Feng
The inflation data for May in the United States shows unexpectedly mild signs, bringing positive signals for risk assets. Specifically, the seasonally unadjusted Consumer Price Index (CPI) year-on-year rate recorded 2.4%, lower than the market's general expectation of 2.5%; the month-on-month rate was only 0.1%, also below the expected 0.2%.
Core inflation data (excluding volatile food and energy prices) also showed a similar slowdown trend: the year-on-year rate recorded 2.8%, lower than the expected 2.9%; while the seasonally adjusted core CPI month-on-month rate was only 0.1%, significantly below the market expectation of 0.3%.
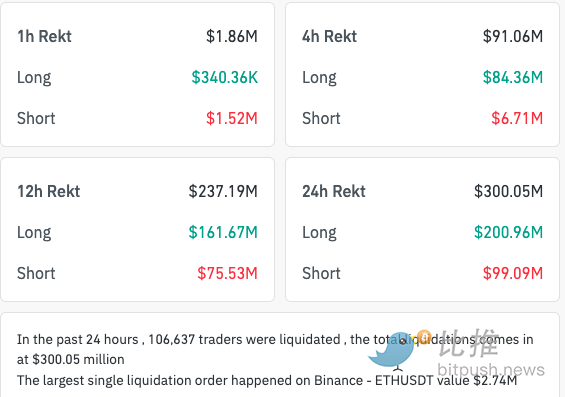
After the report was released, the cryptocurrency market exhibited a trend of rising first and then falling. Bitcoin briefly approached $110,000 during the day, Ethereum (ETH) rose 3% to $2,834, and XRP increased 1.8% to $2.32. The total market capitalization of cryptocurrencies remained around $3.4 trillion in the past 24 hours. According to CoinGlass data, as of the time of writing, the total liquidation amount across the network reached $300 million, with Ethereum's liquidation amount around $100 million and Bitcoin's liquidation amount approximately $37 million.
Whale Activity
While BTC rose and then fell, on-chain data also observed an increase in whale activity.
The on-chain tracking platform Whale Alert discovered on June 11 that a large amount of Bitcoin flowed into the US cryptocurrency exchange Coinbase. According to the data provided by the tracking platform, within a short period of about two hours, several anonymous whales transferred over 3,165 BTC (worth over $347 million) to Coinbase through multiple transactions.

The largest single transaction involved 738 BTC, while several other transactions were also large transfers from anonymous wallets (e.g., 466 BTC, 464 BTC, 463 BTC, etc.).
Notably, 510 BTC (worth about $56.1 million) were transferred from the well-known crypto trading firm Cumberland to Coinbase Institutional, which typically indicates that whales may be attempting to sell their tokens. Although the specific reasons for these transfers have not been confirmed, it could also be an attempt by whales to rebalance their portfolios. However, considering the large volume and high frequency of these transfers, and the involvement of firms like Cumberland, it is likely the actions of large participants, especially institutions.
Possibly influenced by this whale activity, Bitcoin fell below the $110,000 mark at the day's opening, stabilizing around $108,677 at the time of publication.
Market Trends and Technical Analysis
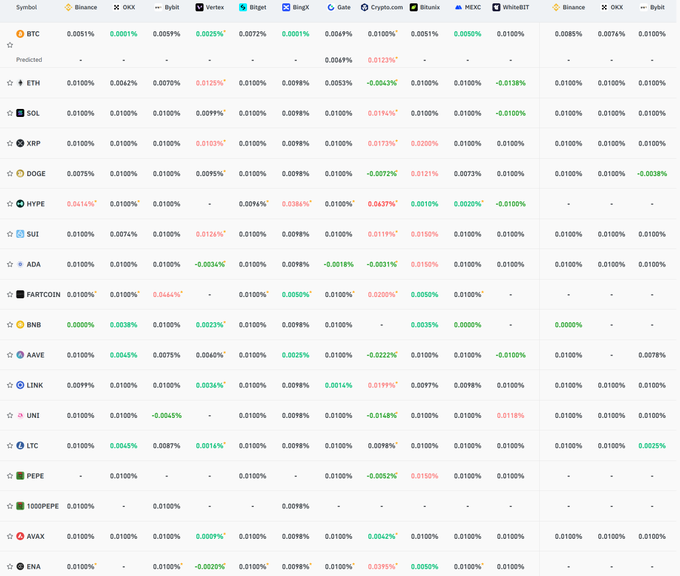
Data shows that the current funding rate in the Bitcoin futures market is very stable or slightly low.
I believe this typically indicates that the current rebound is driven by actual purchases of spot assets by investors, rather than by high-leverage futures trading. With high-leverage positions not dominating the market, the risk of triggering large-scale sell-offs and sharp declines is relatively low, thus increasing the likelihood of continued price increases.
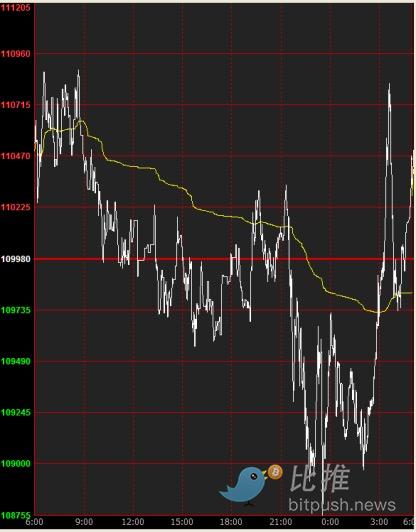
From a technical chart perspective, Bitcoin opened with a gap up of about 1% yesterday, priced around 110,375. After opening, BTC fluctuated around this price for about 180 minutes, then began to slowly decline, reaching an intraday low of 108,720 around 11:33. Around 2:02 PM, BTC quickly surged, ultimately closing at approximately 110,455. The day ended with a bullish doji candlestick with a long lower shadow, showing an increase of about 1.02%.
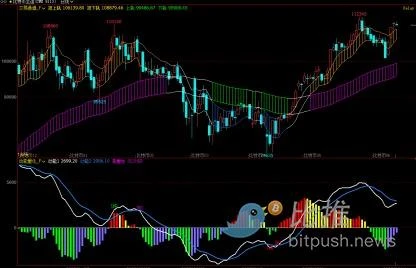
Monitoring through the daily trading channel model, Bitcoin is currently operating above the red and green protective channel, indicating that the mid-term trend remains strong. Sentiment indicators have also slowly recovered with the rise in coin prices, suggesting that market confidence is returning.
From the 1-hour candlestick chart, the trading model monitoring shows that the short-term coin price is operating above the white bullish and bearish line, and the sentiment indicator is in a high zone, about to form a top divergence pattern. This suggests that the probability of increased market volatility in the short term is high, and there may be a pullback to the 108,720 level (the intraday low), which needs to be closely monitored to see if this low will be broken.

I believe that through the analysis of the 1-hour candlestick data, multiple indicators are in a high zone, increasing the probability of intraday fluctuations, and it is crucial to observe whether the 108,720 low will be broken. Through the analysis of the daily candlestick data, BTC is operating within the red and green protective channel, and mid-term long positions can continue to be held.
免责声明:本文章仅代表作者个人观点,不代表本平台的立场和观点。本文章仅供信息分享,不构成对任何人的任何投资建议。用户与作者之间的任何争议,与本平台无关。如网页中刊载的文章或图片涉及侵权,请提供相关的权利证明和身份证明发送邮件到support@aicoin.com,本平台相关工作人员将会进行核查。


