This Week's Preview (6.9-6.15),* Trump announces that China and the U.S. will hold talks in London;* BTC ETF** sees net outflow, *ETH* continues 15 days of net inflow**
Table of Contents:
Large token unlocking data for this week;
Overview of the crypto market, quick read on the weekly performance of popular coins/fund flows by sector;
Bitcoin spot ETF dynamics;
BTC liquidation map data interpretation;
Key macro events this week and important forecasts and interpretations for the crypto market.
1. Large token unlocking data for this week;
Coinank data shows that tokens such as APT, STRK, and IMX will see significant unlocking this week, including:
Aptos (APT) will unlock approximately 11.31 million tokens at noon on June 12, accounting for 1.79% of the current circulating supply, valued at about $52.7 million;
Starknet (STRK) will unlock approximately 127 million tokens at 8 AM on June 15, accounting for 3.79% of the current circulating supply, valued at about $16.6 million;
Immutable (IMX) will unlock approximately 24.52 million tokens at 8 AM on June 13, accounting for 1.33% of the current circulating supply, valued at about $12.8 million;
Movement (MOVE) will unlock approximately 50 million tokens at 8 PM on June 9, accounting for 1.96% of the current circulating supply, valued at about $7.1 million;
BounceBit (BB) will unlock approximately 42.89 million tokens at 8 AM on June 12, accounting for 10.47% of the current circulating supply, valued at about $4.6 million;
Delysium (AGI) will unlock approximately 69.03 million tokens at 8 AM on June 11, accounting for 4.00% of the current circulating supply, valued at about $3.8 million;
Onyxcoin (XCN) will unlock approximately 296 million tokens at 8 AM on June 15, accounting for 0.88% of the current circulating supply, valued at about $4.3 million;
Cookie DAO (COOKIE) will unlock approximately 13.88 million tokens at 8 AM on June 13, accounting for 2.54% of the current circulating supply, valued at about $2.9 million;
io.net (IO) will unlock approximately 3.22 million tokens at 8 PM on June 11, accounting for 1.98% of the current circulating supply, valued at about $2.5 million.
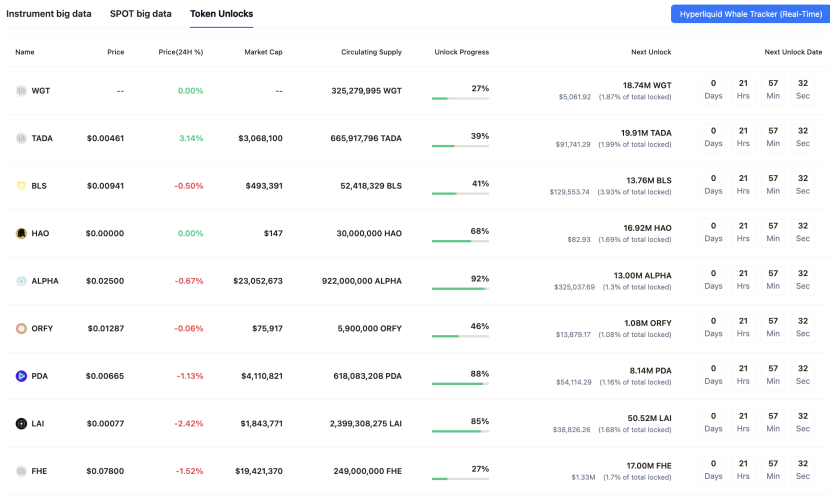
We believe that this unlocking event involves multiple altcoins, with a total value exceeding $80 million, which may exert downward pressure on the market in the short term. APT, STRK, and IMX, as key unlocking targets, have a relatively low proportion of new supply (APT 1.79%, STRK 3.79%, IMX 1.33%), but historical data indicates that such events are often viewed as "bearish signals," as early investors may sell to cash out, exacerbating market volatility. For example, the STRK unlocking of Starknet was alleviated due to planned adjustments, but the release of 127 million tokens this time may still suppress price upward potential. Additionally, tokens like BB have a higher unlocking ratio (e.g., BB reaches 10.47%), posing more significant risks that could trigger localized selling pressure. From a macro perspective, the overall token unlocking scale in June is substantial (evidence shows over $650 million), and given the current lack of liquidity in altcoins, investors should be wary of short-term pullback risks and pay attention to the market's absorption capacity post-unlocking. It is recommended to monitor real-time price changes to avoid chasing high prices.
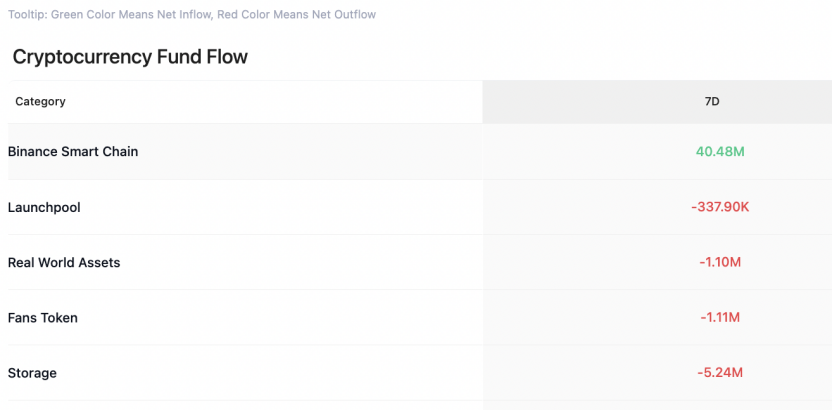
2. Overview of the crypto market, quick read on the weekly performance of popular coins/fund flows by sector
CoinAnk data shows that due to the overall downtrend in the market, over the past week, only the Binance Smart Chain achieved a net inflow of funds, while Launchpool, RWA, fan tokens, Storage, and BRC20 experienced small outflows.
In the past 7 days, the top gainers among coins (selected from the top 200 by market cap) are RVN, TITAN, AB, ICX, and SPX, which have shown relatively strong gains, and this week, strong coins should continue to be prioritized for trading opportunities.
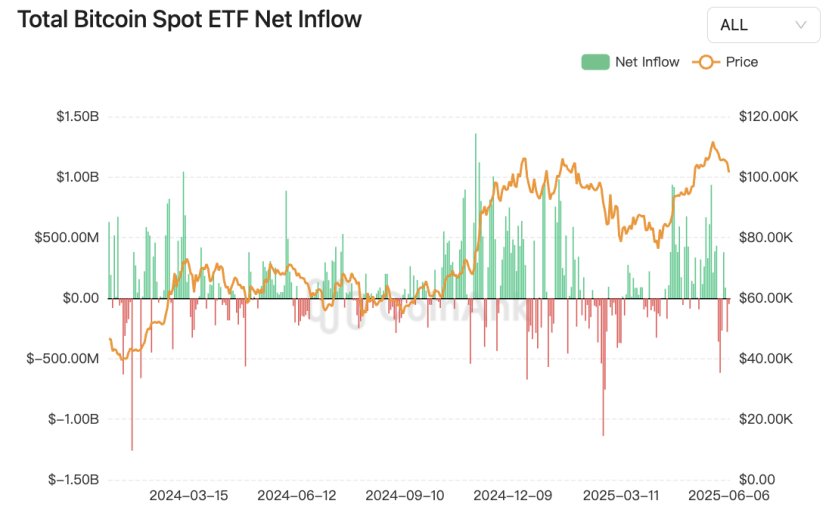
3. Bitcoin spot ETF fund dynamics.
CoinAnk data shows that last week, the U.S. Bitcoin spot ETF saw a net outflow of $131.6 million, including: BlackRock's IBIT with a net inflow of $81.1 million; Fidelity's FBTC with a net outflow of $167.7 million; and ARKB with a net outflow of $24.5 million.
The total on-chain holdings of U.S. spot Bitcoin ETFs have surpassed 1.1 million BTC, currently reaching about 1.184 million BTC, accounting for 5.96% of the current BTC supply, with the on-chain holding value reaching approximately $125.8 billion.
The U.S. spot Ethereum ETF has seen continuous inflows for 15 days. Since May 16, this wave of continuous inflows has accumulated to $837.5 million, which is about 25% of the total net inflow of $3.32 billion since the launch of the spot Ethereum ETF in July 2024. If this trend continues in the coming week, an additional inflow of $162.5 million will bring the total continuous inflow to $1 billion.
In contrast, the inflow momentum of the spot Bitcoin ETF was broken on May 29, when there was an outflow of $346.8 million. Since then, the fund flows have been fluctuating, alternating between inflows and outflows.
We believe that the recent cryptocurrency ETF market is showing significant differentiation. The fund flow of the Bitcoin spot ETF has experienced a volatile reversal: last week, the overall net outflow was $131.6 million, reflecting the cautious sentiment in the market, similar to the record single-week outflow of $3.2 billion set in August 2024. However, it is noteworthy that BlackRock's IBIT still achieved a net inflow of $81.1 million, highlighting the tendency of institutional funds to seek refuge in leading products. Currently, the U.S. Bitcoin ETF holdings amount to 1.184 million BTC (accounting for 5.96% of the total supply), an increase of 87% from the holding size of 632,000 BTC at the beginning of 2025, indicating a continued strengthening of the long-term capital accumulation effect.
In contrast, the Ethereum spot ETF shows strong momentum: the continuous net inflow over 15 days has reached $837.5 million, accounting for 25% of the historical total net inflow of $3.32 billion for this category. If this growth rate is maintained, it may break the $1 billion milestone this week. This sustained ability to attract funds validates Standard Chartered's predictive model, which suggests that the Ethereum ETF could attract $15-45 billion in funds within 12 months of approval. It is particularly noteworthy that the differentiation in fund flows may reflect a shift in market expectations: after the single-day outflow of $346.8 million from the Bitcoin ETF on May 29, it entered a volatile cycle, while the stable inflow of the Ethereum ETF may indicate that investors are turning towards the staking yield potential of ETH and the $8,000 price target.
In-depth data reveals two major trends: first, the proportion of Bitcoin ETF holdings has surged from 3.2% at the beginning of 2025 to 5.96%, indicating that institutional holdings are accelerating the locking of circulating chips; second, the record number of consecutive inflow days for the Ethereum ETF stands in stark contrast to the funding disconnection of the Bitcoin ETF, potentially pushing the ETH/BTC exchange rate into a new equilibrium range.
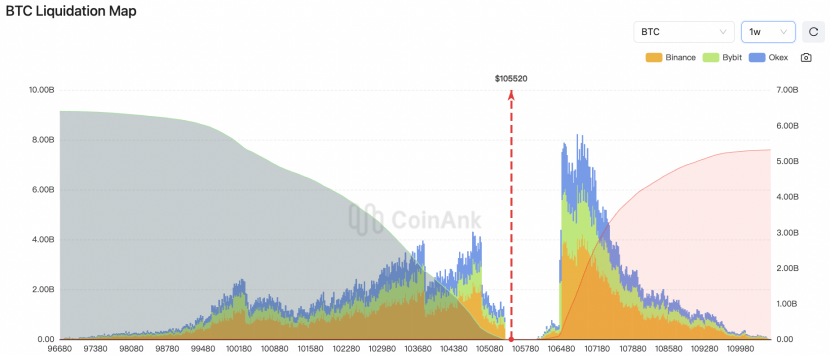
4. BTC liquidation map data.
CoinAnk liquidation map data shows that if BTC breaks $110,000, the cumulative short liquidation intensity on mainstream CEXs will reach $5.27 billion. Conversely, if Bitcoin falls below $100,300, the cumulative long liquidation intensity on mainstream CEXs will reach $5.37 billion.
We believe that the current Bitcoin market is facing a critical price threshold game, with significant leverage risks amplified on both sides. If BTC breaks $110,000, it will trigger a short liquidation intensity of up to $5.27 billion, potentially causing a "short squeeze" effect—concentrated short covering will create a liquidity wave, further pushing prices up and strengthening the upward trend. Conversely, if it falls below $100,300, the $5.37 billion long liquidation intensity indicates a dense leverage long position below, and once the support level is breached, it may trigger a chain liquidation of "longs killing longs," leading to short-term liquidity exhaustion and amplifying downside risks.
Several deep features should be noted: currently, risk exposure is expanding, and compared to earlier data (e.g., the breakthrough of $104,000 in January 2025 only triggered $260 million in short liquidations), the current liquidation scale is growing exponentially, reflecting a simultaneous increase in market leverage and volatility sensitivity; liquidation intensity is not an exact amount but is measured by comparing the density of adjacent price liquidation clusters to gauge the market's reaction intensity after price reaches those levels; regarding the phenomenon of threshold drift, key liquidation thresholds are moving upward with the price center (e.g., the breach of $80,000 in April corresponded to $4.5 billion in long liquidations, which has now risen to the $100,000 range in June), indicating a dynamic adjustment of the market risk structure.
Currently, Bitcoin is in a high-leverage sensitive zone, with $110,000 and $100,000 forming key defensive lines for bulls and bears, and any directional breakthrough could exacerbate short-term volatility due to forced liquidation waves.
5. Key macro events this week and important forecasts and interpretations for the crypto market.
CoinAnk data shows:
June 9: Trump: will hold talks with China in London;
The U.S. Senate may vote on the GENIUS stablecoin bill as early as June 9;
The U.S. SEC will hold a crypto-themed roundtable;
June 10: The U.S. House of Representatives plans to review the CLARITY Act on crypto market structure;
June 11: The U.S. will release May CPI data at 20:30.
We believe that the current macro situation presents a dual game of policy and data:
Geopolitical and policy intensification: Trump's plan to hold high-level talks with China in London coincides with the U.S. Congress accelerating the advancement of crypto asset legislation (Senate vote on the GENIUS stablecoin bill, House review of the CLARITY Act), reflecting a strategic intention to advance digital financial regulation and trade policy in tandem. The SEC's concurrent holding of a crypto-themed roundtable highlights the proactive involvement of regulatory agencies in emerging financial forms.
Inflation data as a market watershed: The May CPI forecast shows a slight year-on-year increase in overall inflation to 2.4% (previous value 2.3%), with core inflation remaining at 2.8%, suggesting that the deflation process may be stalling. The Cleveland Fed model indicates that core goods inflation may peak this fall, but the "suspension of reciprocal tariffs" has lowered and delayed peak forecasts. This data will directly test the market's optimistic expectations for interest rate cuts; if actual data exceeds expectations, it may trigger a reassessment of the monetary policy path.
Market sentiment structurally differentiating: Although U.S. stocks have reached a three-month high (led by tech stocks), stock funds have seen outflows for three consecutive weeks, reflecting investors taking profits amid policy uncertainty. Gold has seen increased volatility but closed higher, with central bank purchases (e.g., China has increased holdings for seven consecutive months) and geopolitical risks still providing support. Trump's renewed pressure on the Federal Reserve to cut rates by 100 basis points highlights the tension between political forces and monetary authorities.
In summary, the core variables this week lie in the interaction between actual CPI data and the legislative process: if inflation rises above expectations, it may strengthen the Federal Reserve's wait-and-see stance, exacerbating asset volatility; while progress on crypto legislation relates to the global competitiveness of the U.S. dollar stablecoin.
免责声明:本文章仅代表作者个人观点,不代表本平台的立场和观点。本文章仅供信息分享,不构成对任何人的任何投资建议。用户与作者之间的任何争议,与本平台无关。如网页中刊载的文章或图片涉及侵权,请提供相关的权利证明和身份证明发送邮件到support@aicoin.com,本平台相关工作人员将会进行核查。


