Understanding when to let go is a kind of wisdom in life. A person has only two hands and one mouth, and there are only so many things they can grasp and enjoy. The saying goes, "Weak water has three thousand streams, but I only take one ladle to drink." Human energy and ability are limited; there has never been a true omnipotent being. Only by learning to let go can one concentrate their energy and abilities on options to strive for breakthroughs and maximize comparative advantages!
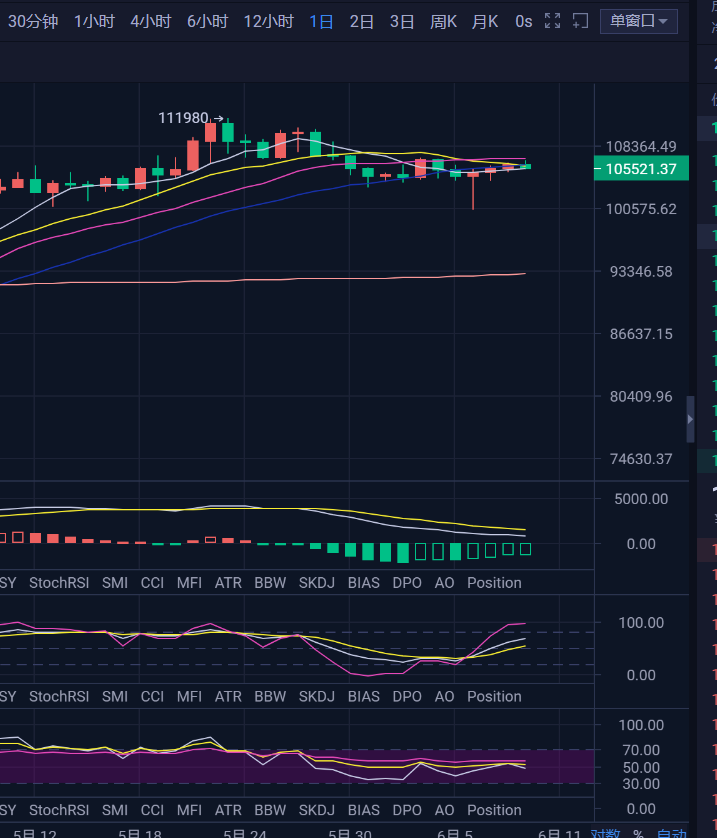
The market, after going around in circles over the weekend, has returned to its original oscillation position, which is somewhat unexpected. After the market dipped on Friday, our analysis suggested two possible trends: one was to continue downward to lower positions, thereby liquidating the bullish liquidity below; the second was to return to the oscillation area of 103000-107000, with a key position being above 103000. However, in our operations, we still chose to operate based on the first trend expectation. Ultimately, the market returned above 103000 and closed that day with stable support, forming a downward closing structure, which led to the market oscillating over the weekend and recovering the drop from Friday. This also resulted in our operation failing, as the market did not continue to dip as we had hoped, forcing us to exit with losses.
Returning to the current market, starting with liquidity, Friday's drop completed the liquidation of the previously concentrated bullish positions, but the subsequent market did not continue to liquidate downward. Accompanied by short positions closing and bullish bottom-fishing, the market rose again, reaching above 106000 yesterday, touching the previous rebound high. Currently, the area of concentrated short positions is still around 108000, while bullish positions are mainly piled up around 96500. In the short term, yesterday's rebound briefly had the potential to continue upward to liquidate short liquidity, but ultimately lacked some strength. Under such a trend, two key points need to be noted. First, if the market continues upward but fails to break through, the likelihood of forming a double top structure in the short term becomes significant, or it may continue to rise and fall according to the current pattern. If it breaks below the short-term support of 104800, it would also signify the end of the recent rebound.
On the technical front, it seems that a large-scale top divergence structure is beginning to form on the weekly chart. Currently, the price is operating near the MA7 line. In the short term, whether it can maintain above the MA7 line this week is crucial. Additionally, from a time cycle perspective, if a weekly-level adjustment occurs, the node is likely around the end of June or early July. Other weekly indicators are at relatively high levels, and a correction is certainly expected, but it is still a bit early.
On the daily chart, aside from Friday's closing, the market has basically been operating with low volatility. Although the market has rebounded in the past two days, there has not been much volume, and the rebound has not broken through the previous high. Under such a rebound that falls short of expectations, it is not wise to be overly bullish, as it has returned to operate within the oscillation area. Currently, the market should be treated as oscillating between the low point around 100000 and the high point around 107000. In terms of daily indicators, there is a mix of bullish and bearish signals, presenting a chaotic and disorderly state, suggesting that it could break upward or continue downward, making the reference value relatively limited.
On the four-hour level, after the pullback last Friday, a "V-shaped" reversal structure has emerged. During the rebound, it has clearly been under pressure from the MA120 line, and is currently facing pressure again. Since the previous pullback broke below the MA120 long-term moving average, the market has struggled to stay above this level, forming a dividing line. In terms of MACD, it seems that the bullish rebound cycle is also nearing its end, with bullish volume shrinking, and it is about to enter a bearish cycle. Other indicators remain in a downward divergence state, indicating a bearish tendency on the four-hour chart.
In summary, as the market has not truly broken out, it is more reasonable to expect oscillation in the 100000-107000 range. Since the price is currently at the high end of this range, the short-term outlook should be bearish. Additionally, the rebound above 103000, accompanied by a decline in spot premiums, indicates that futures bulls are reopening positions while bears are closing theirs. Therefore, in the short term, consider looking for opportunities to short, seeking a pullback to around 103500, which is the midpoint of the current new range.
In terms of operations, the analysis above has already outlined how to proceed. If we break it down further, for the short-term market, my personal expectation is to first continue the weak pullback during the day, likely to around 104500-104800, followed by a certain rebound to the 106000-106500 range, and then another pullback to 103500 or slightly lower.
Ethereum has recently shown some weakness, but in terms of the ETH/BTC exchange rate, it is still relatively strong, overall oscillating in the range of 2300-2800. The trend mainly follows Bitcoin and has not been able to establish an independent market in the short term. Currently, based on the midpoint of the larger range at 2550, the market has not been able to break through this midpoint in the short term, so operations should focus on oscillating between 2550-2300.
【The above analysis and strategies are for reference only. Please bear the risks yourself. The article is subject to review and publication, and market conditions change in real-time. The information may be outdated, and specific operations should be based on real-time strategies. Feel free to contact us for discussions on market conditions.】

免责声明:本文章仅代表作者个人观点,不代表本平台的立场和观点。本文章仅供信息分享,不构成对任何人的任何投资建议。用户与作者之间的任何争议,与本平台无关。如网页中刊载的文章或图片涉及侵权,请提供相关的权利证明和身份证明发送邮件到support@aicoin.com,本平台相关工作人员将会进行核查。


