Zhou Yanling: 6.9 Bitcoin and Ethereum Latest Trend Prediction Analysis and Trading Strategy
Although there was hardly any market movement over the weekend, some signs can still be observed. The so-called international news stimuli have merely caused the coin price to hover around the critical threshold of 100,000 for a week. The deep V reversal in the last two days of last week fully reflects the pressure from the top-bottom conversion. As it stands, the Bitcoin bears still hold more advantages for next week, while the support below needs to continue testing the strength of the 100,000 integer level. If this position is touched again, a rapid decline may occur. However, this does not mean that the long-term bull market is over; the ultimate dividing line for the bull market is around 93,000. No matter how fierce this pullback is, as long as it does not drop below 93,000, the long-term outlook remains bullish. Therefore, friends who previously held low-position long positions or spot assets need not worry excessively; the overall situation has not been completely reversed.
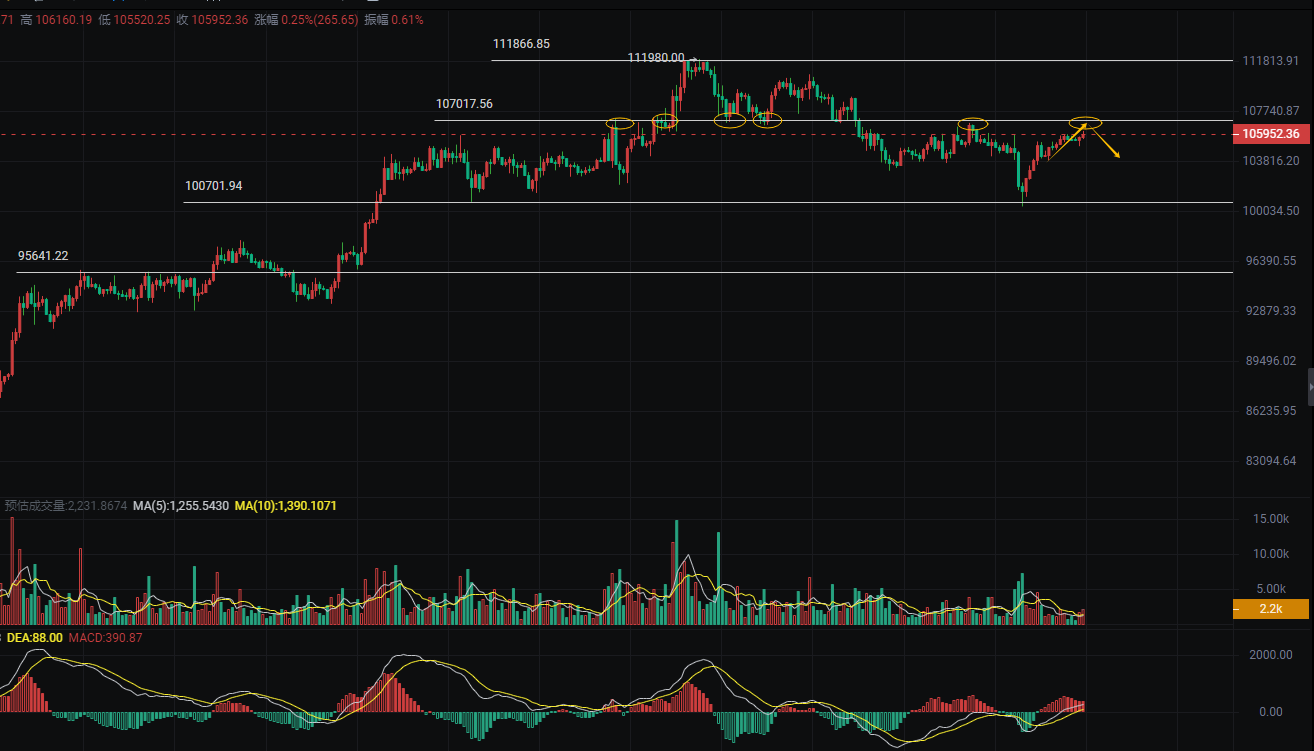
Next, let's take a look at the specific indicator analysis. The daily level shows that the short-term coin price has been rising continuously, forming multiple bullish candles, but the recent high has failed to break through the previous resistance level near 107,000, indicating signs of consolidation. The hourly level shows a clear upper shadow in the range of 104,000 to 106,000, indicating strong selling pressure above, while the lows are gradually rising, maintaining a slightly strong trend in the short term. The MACD technical indicator on the hourly chart is above the zero axis, with a shortening histogram and weakening momentum, possibly entering a consolidation or pullback phase; the daily MACD red bars continue to expand, indicating a bullish short-term trend. The RSI on the hourly chart is at 61.93, close to the overbought area but not yet overheated, while the daily RSI is neutral to strong, showing optimistic market sentiment. The 7-period EMA (105,768) and the 30-period EMA (105,448) on the hourly chart maintain a golden cross state, providing effective support; the 120-period EMA (104,955) is far from the current price, indicating an upward long-term trend. The overall EMA system on the daily chart is arranged in a bullish manner.
Zhou Yanling 6.9 Bitcoin Trading Strategy:
Short at 107,000-106,200, stop loss above 108,000, target 105,000-104,300
Long at 103,700-104,500, stop loss below 102,600, target 106,000-107,000
Zhou Yanling 6.9 Ethereum Trading Strategy:
Short at 2,600-2,570, stop loss above 2,650, target 2,400-2,440
Long at 2,430-2,460, stop loss below 2,380, target 2,520-2,560
[The above analysis and strategies are for reference only. Please bear the risks yourself. The article review and publication may have delays, and the strategies may not be timely. Specific operations should follow Yanling's real-time strategies.]

This content is exclusively shared by senior analyst Zhou Yanling (WeChat public account: Zhou Yanling). The author has been engaged in financial market investment research for over ten years, currently mainly analyzing and guiding BTC, ETH, DOT, DOGE, LTC, FIL, EOS, XRP, BCH, ETC, BSV, and other cryptocurrency contracts/spot operations. For more real-time community guidance, consultation on position recovery, and learning trading skills, you can follow the teacher's public account: Zhou Yanling to find the teacher.
免责声明:本文章仅代表作者个人观点,不代表本平台的立场和观点。本文章仅供信息分享,不构成对任何人的任何投资建议。用户与作者之间的任何争议,与本平台无关。如网页中刊载的文章或图片涉及侵权,请提供相关的权利证明和身份证明发送邮件到support@aicoin.com,本平台相关工作人员将会进行核查。


