The daily chart indicates that bitcoin is navigating a cooling period after reaching highs near $112,000 earlier in May. Despite this decline, the downtrend is accompanied by decreasing volume, hinting at weakening selling pressure. Support appears to be forming in the $103,500 to $104,000 range, with buyers potentially eyeing a reentry if bullish candlestick signals emerge around $104,000–$105,000. Meanwhile, resistance lies ahead at $108,000, $110,000, and $112,000, offering short-term profit targets for long positions. This suggests a cautious yet opportunistic stance from traders watching for signs of reversal.

BTC/USD daily chart via Bitstamp on June 2, 2025.
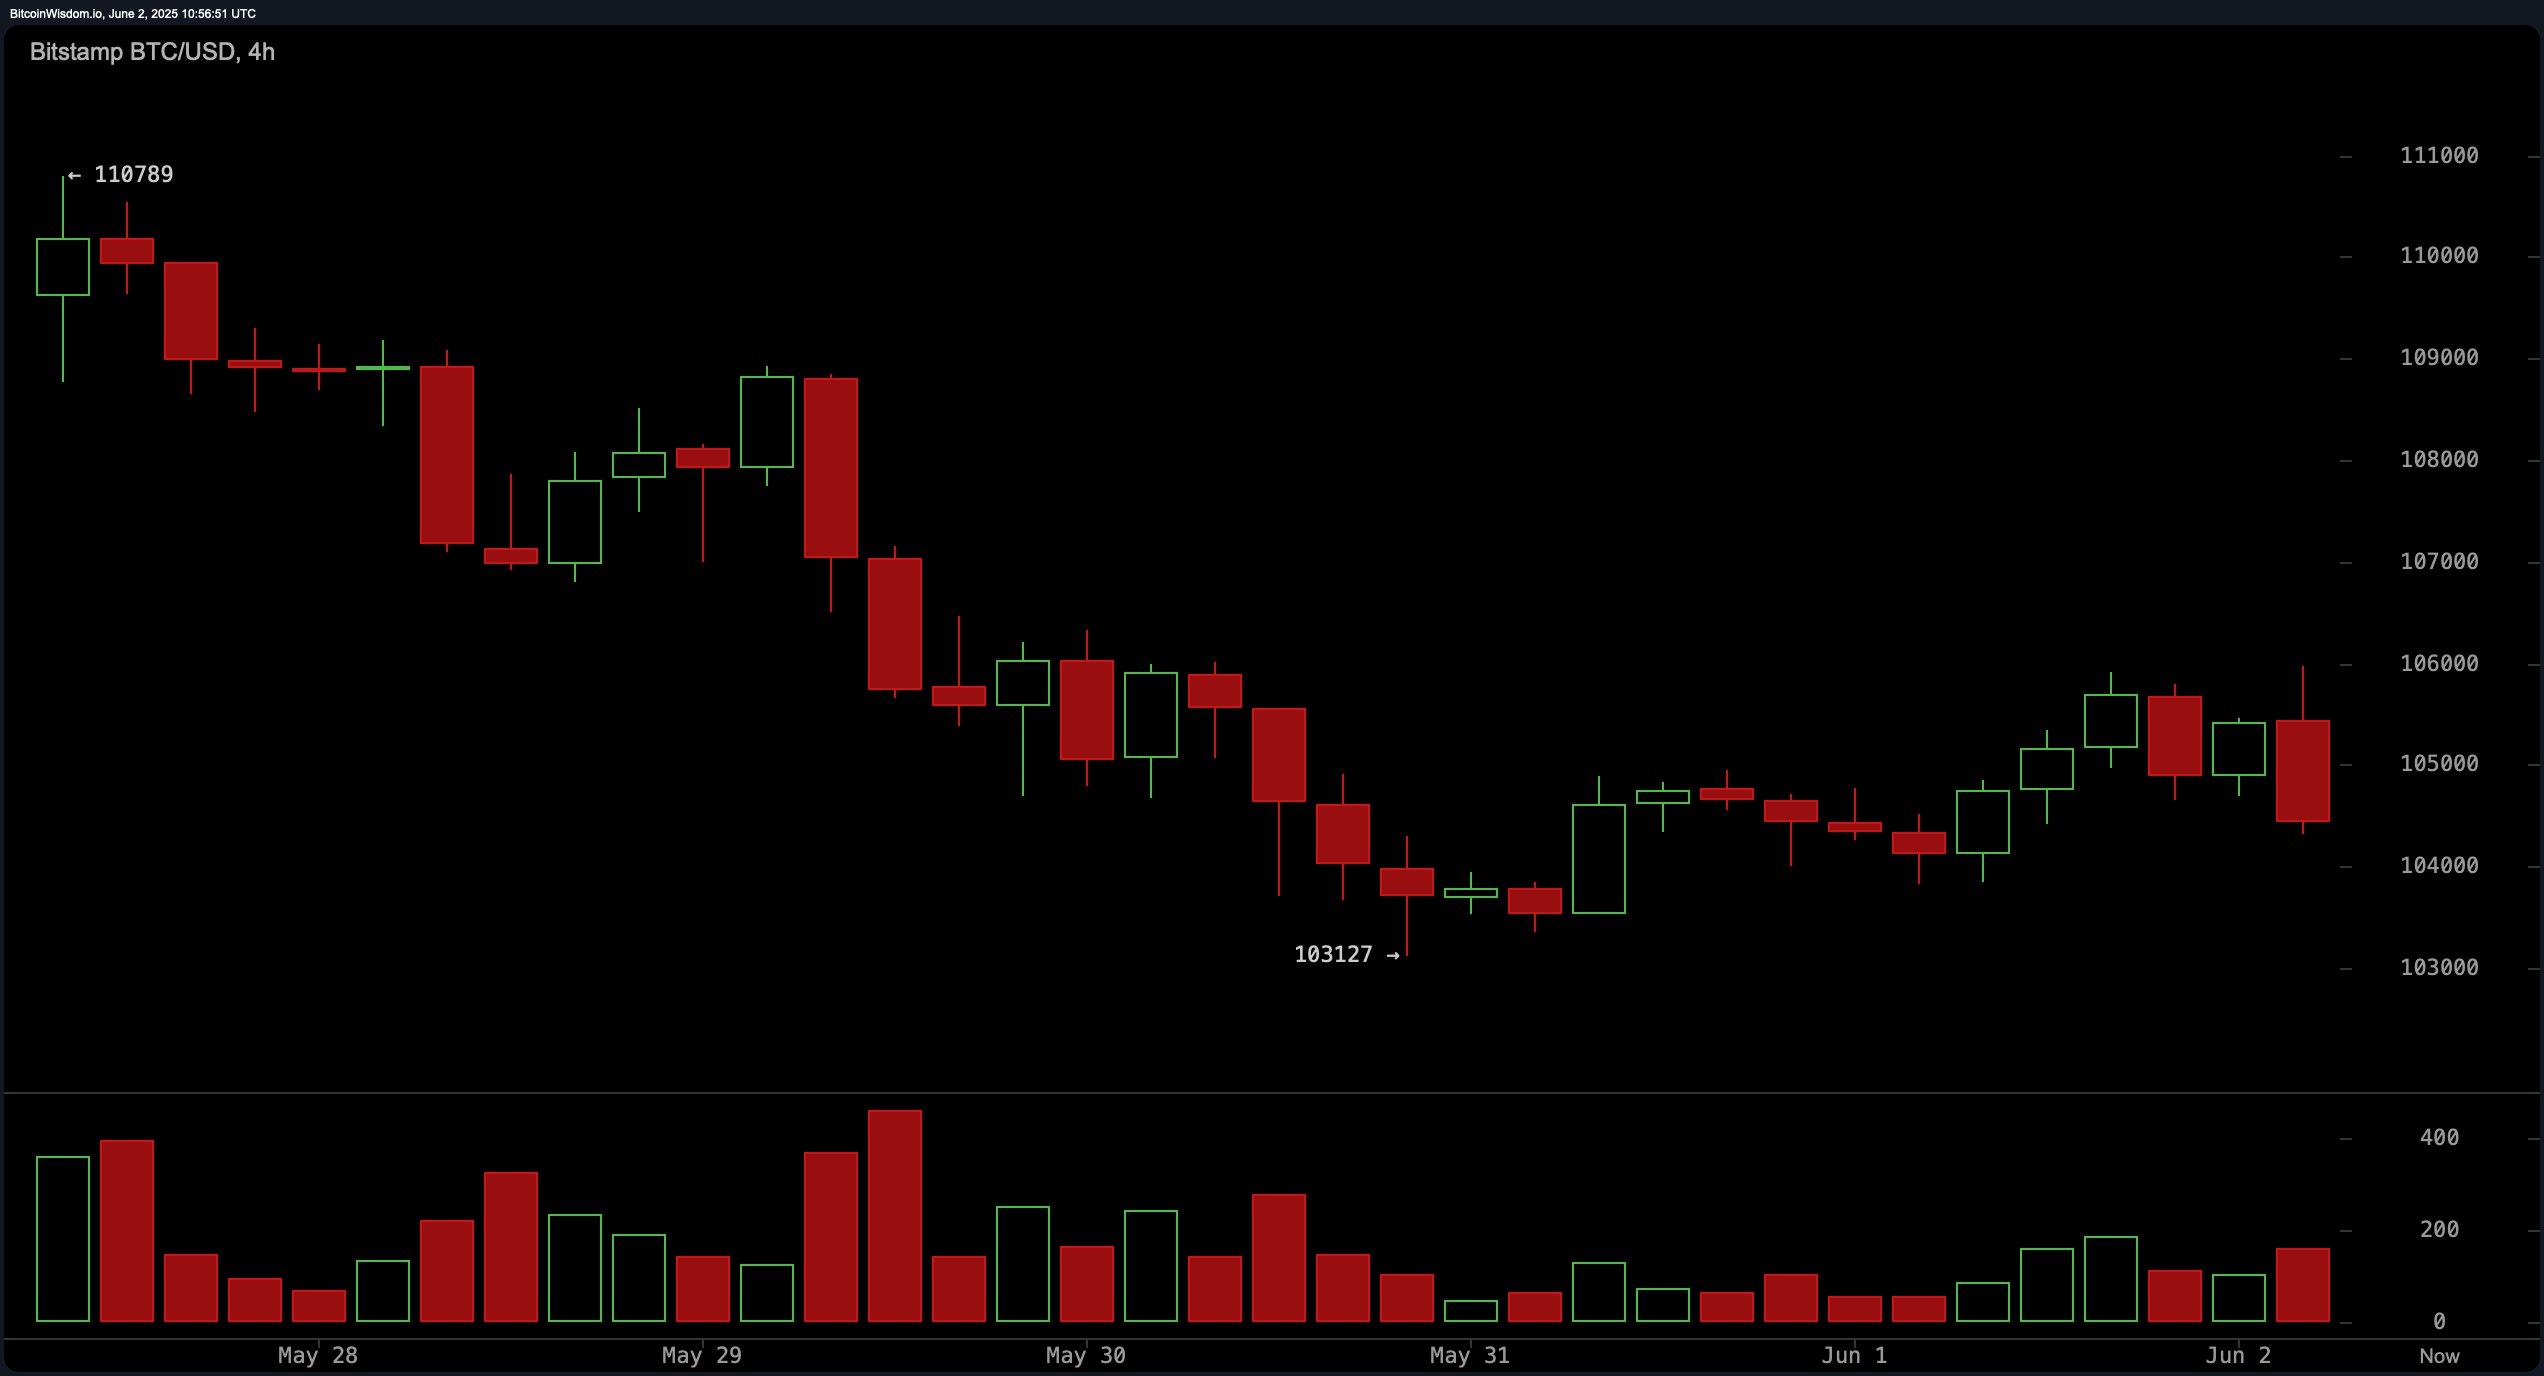
On the four-hour chart, bitcoin is in a clear downtrend, failing to breach resistance between $105,500 and $106,000. The recent bearish engulfing pattern near this range strengthens the short-term bearish outlook. Momentum indicators reinforce this, with the relative strength index (RSI) at 51 and the average directional index (ADX) at 22, both signaling a neutral tone but hinting at direction loss. Traders are advised to consider short entries near resistance on signs of rejection, aiming for exits near the $103,500 support zone or lower if breakdowns accelerate.

BTC/USD 4-hour chart via Bitstamp on June 2, 2025.
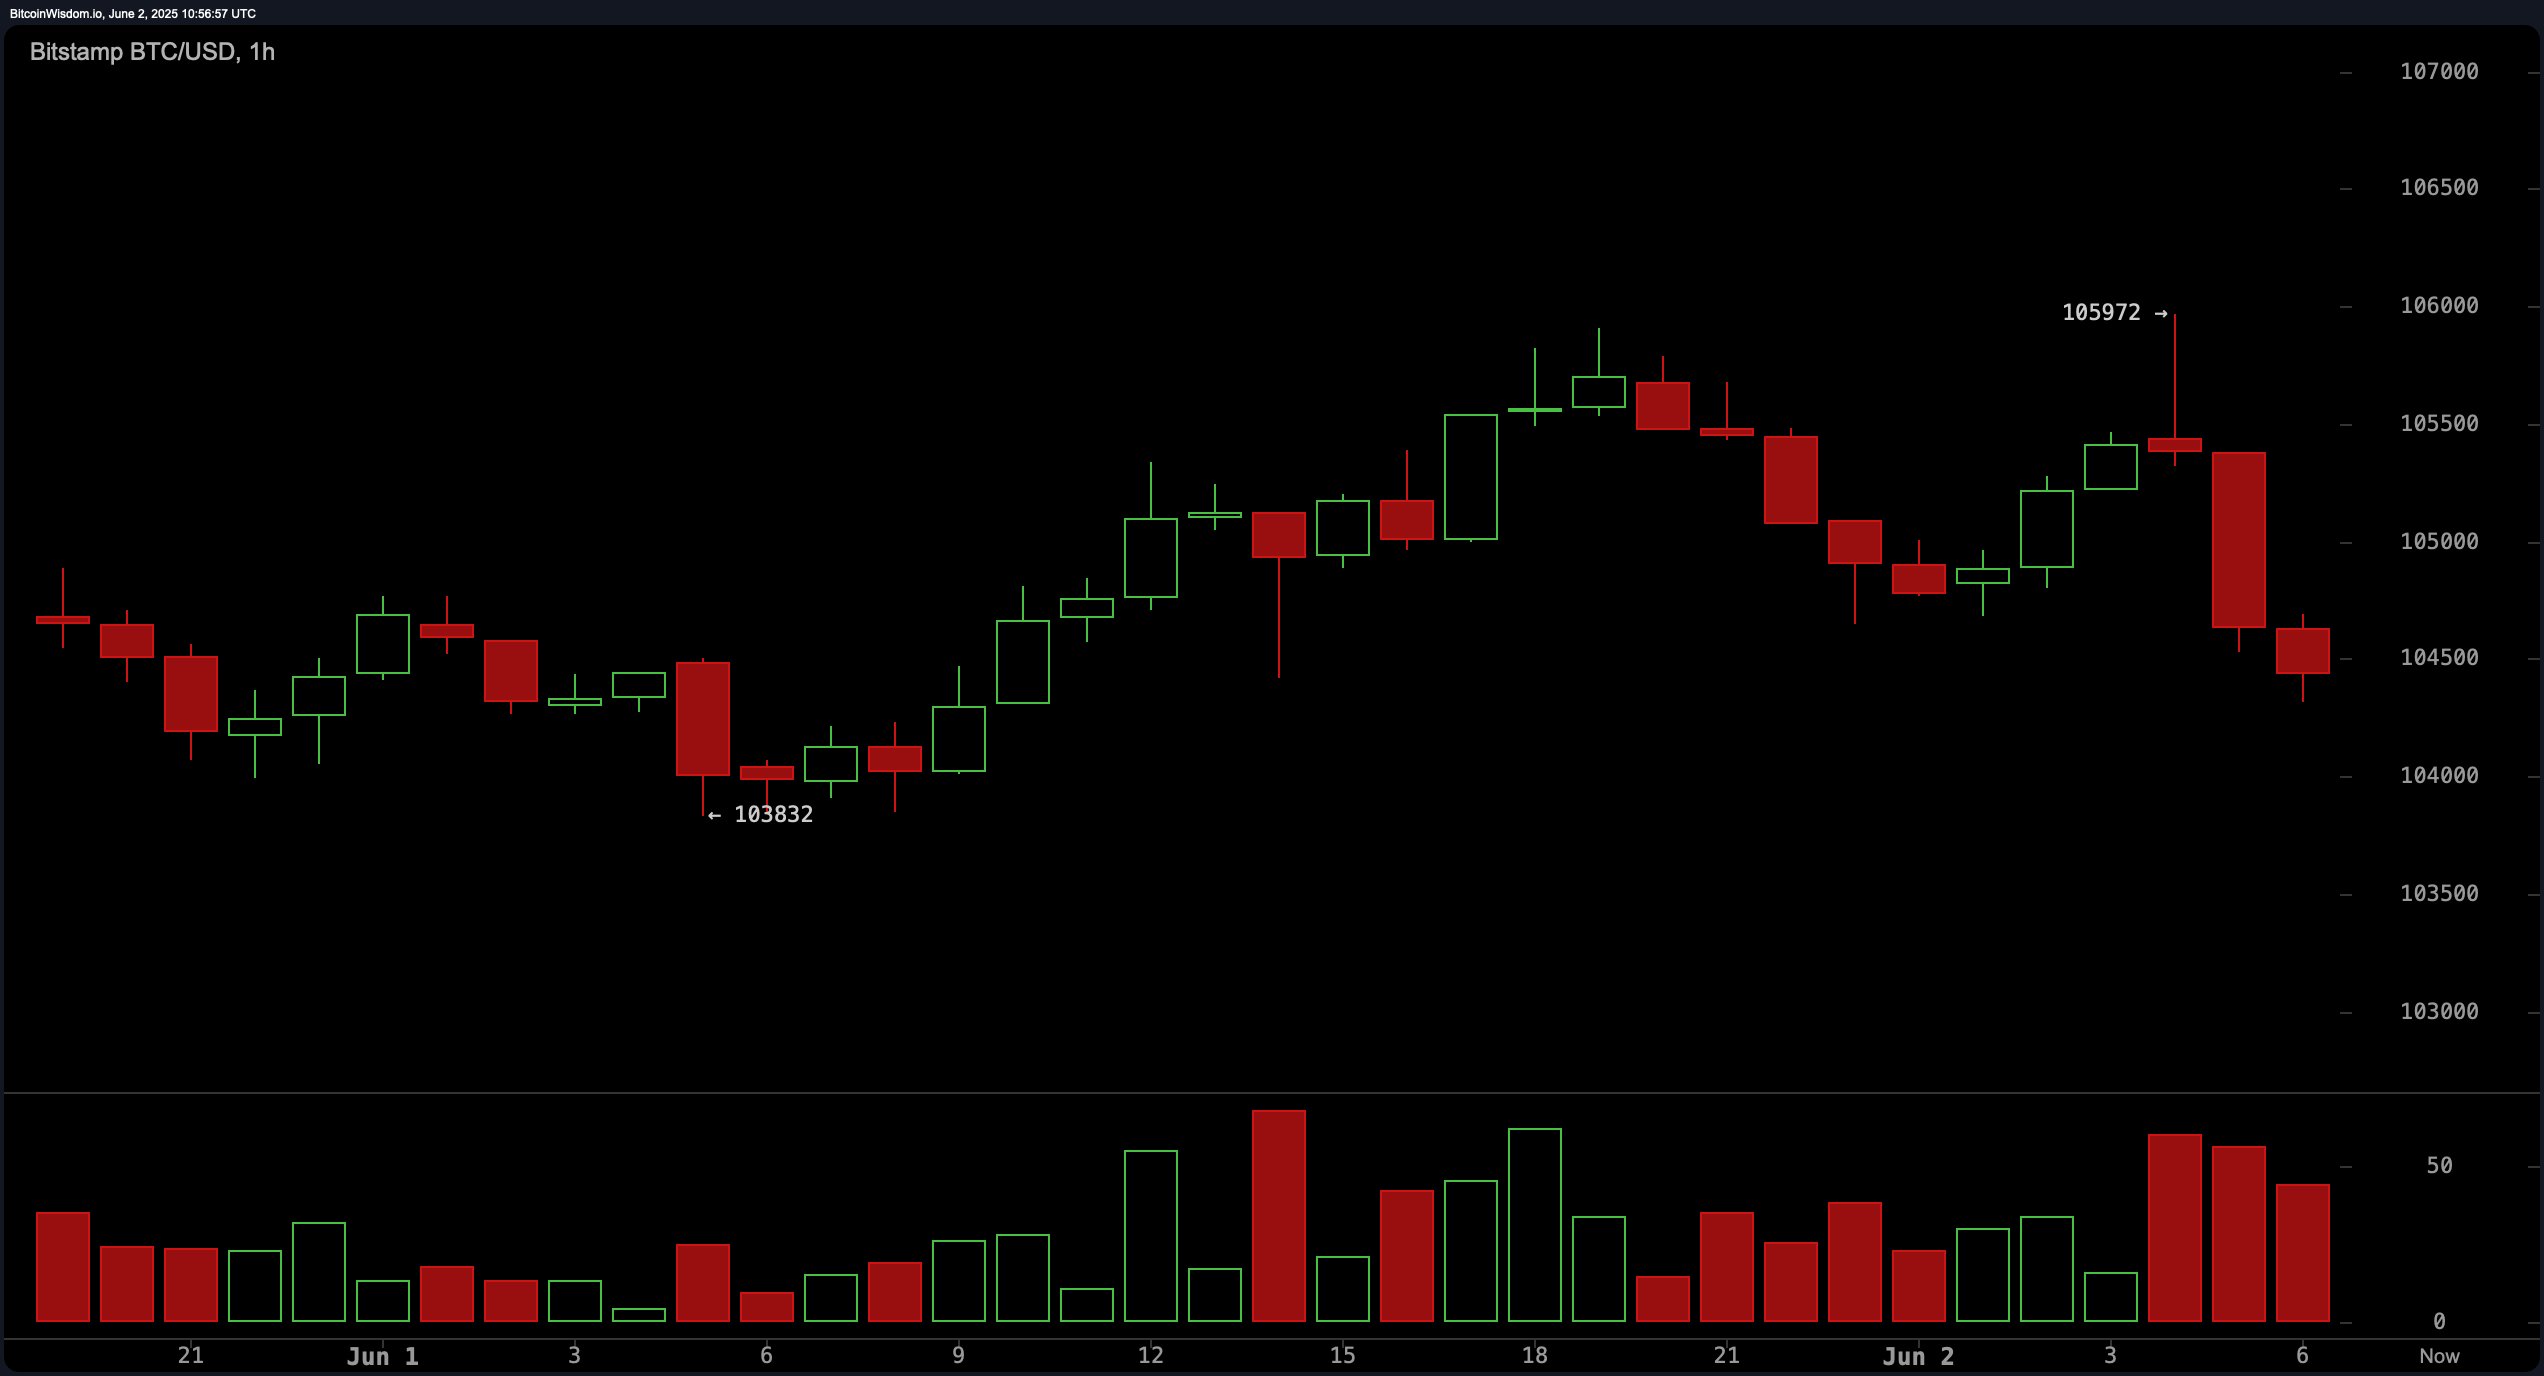
The one-hour BTC/USD chart presents a near-term bearish pattern with a double top formation peaking around $105,900 and a neckline near $104,400. Rejection at $105,972 coupled with strong red volume highlights persistent selling pressure into rallies. While immediate support between $103,800 and $104,200 may attract scalpers, any breach of this zone on increased volume could lead to rapid declines toward $102,800–$103,000. Momentum (10) reading at −2,835 suggests a short-term oversold condition, offering potential for intraday bounce trades under tight risk controls.

BTC/USD 1-hour chart via Bitstamp on June 2, 2025.
Oscillator analysis remains largely neutral, with the RSI, stochastic %K, commodity channel index (CCI), average directional index, and awesome oscillator all sitting in indecisive territory. The momentum indicator, however, issues a buy signal, diverging from the moving average convergence divergence (MACD), which signals a sell. This divergence reflects the choppy market structure and highlights the current battle between bullish and bearish short-term forces.
Moving averages (MAs) provide a mixed view, with shorter timeframes bearish and longer-term averages still bullish. The exponential moving average (EMA) and simple moving average (SMA) across 10 and 20 periods all issue sell signals, confirming recent weakness. Conversely, the 30, 50, 100, and 200-period EMAs and SMAs suggest a broader uptrend remains intact. The juxtaposition of these signals indicates that bitcoin is at a technical crossroads, consolidating before a decisive move.
Bull Verdict:
Bitcoin remains structurally bullish on higher timeframes, with long-term moving averages still aligned upward and support holding near $104,000. If momentum shifts positively and volume confirms a reversal, a retest of the $108,000–$110,000 resistance zone remains plausible, especially given the waning selling pressure on the daily chart.
Bear Verdict:
Despite long-term strength, the short to mid-term charts favor bears, with lower highs, rejection at key resistance levels, and short-term moving averages all signaling further downside. Unless bitcoin reclaims the $106,000 level convincingly, the risk of a breakdown toward $103,000 or lower remains elevated, especially if volume spikes on a support breach.
免责声明:本文章仅代表作者个人观点,不代表本平台的立场和观点。本文章仅供信息分享,不构成对任何人的任何投资建议。用户与作者之间的任何争议,与本平台无关。如网页中刊载的文章或图片涉及侵权,请提供相关的权利证明和身份证明发送邮件到support@aicoin.com,本平台相关工作人员将会进行核查。


