Crypto Circle News
Crypto Circle News
June 2 Hot Topics:
1. YieldNest completed the airdrop snapshot on May 28, with TGE starting on June 3.
2. Blum: The airdrop snapshot will take place on June 7, and the token BLUM will be launched in June.
3. The IMF requires Pakistan to provide an urgent explanation regarding the allocation of 2000 megawatts of electricity for Bitcoin mining.
4. South Korea's token securities legislation may be passed after the presidential election.
5. Michael Saylor releases Tracker information again, which may disclose BTC accumulation details.
Trading Insights
A good trading strategy is the key to stable profits! 1. After opening a position, focus on the stop-loss level and trend lines, abandoning unrealistic fantasies of bottom fishing and peak escaping. Big money is often nurtured in patient waiting, not born from frequent monitoring and turmoil. 2. Stop-loss and holding profits. Be decisive during stop-loss moments; do not hesitate. During the holding phase, remain steady as a rock, and keep your position firm. Setting a discipline to cut losses at 5% is far more effective than studying 100 technical indicators. Understand that the extent of losses is under your control, while profits are influenced by the market. 3. Key trader awareness: ① Position management is prioritized over getting caught up in buy/sell points; position management is the foundation of stable trading, and reasonable allocation can effectively resist risks. ② It is better to execute a single strategy consistently over three months than to frequently change trading tactics; focused execution often yields better results. ③ In market profit patterns, 20% of the market contributes to 80% of the profits. During the remaining time, learn to lie low and patiently wait for profitable market conditions. The market is like a strict examiner, treating various trading arrogance and impatience, but will always reward those who follow the rules and execute diligently. Overly pursuing perfect trades often backfires; beginners may go further in the market by sticking to mechanical operations. Remember, consecutive small losses are not to be feared; catching a trend can turn the tide. The worst is to hold onto fantasies when it’s time to cut losses and to panic and shake when it’s time to hold profits!
LIFE IS LIKE
A JOURNEY ▲
Below are the real trading signals from the Big White Community this week. Congratulations to the friends who followed along; if your operations are not going smoothly, you can come and test the waters.
The data is real, and each order has a screenshot from the time it was issued.
**Search for the public account: *Big White Talks Coins*
BTC
Analysis
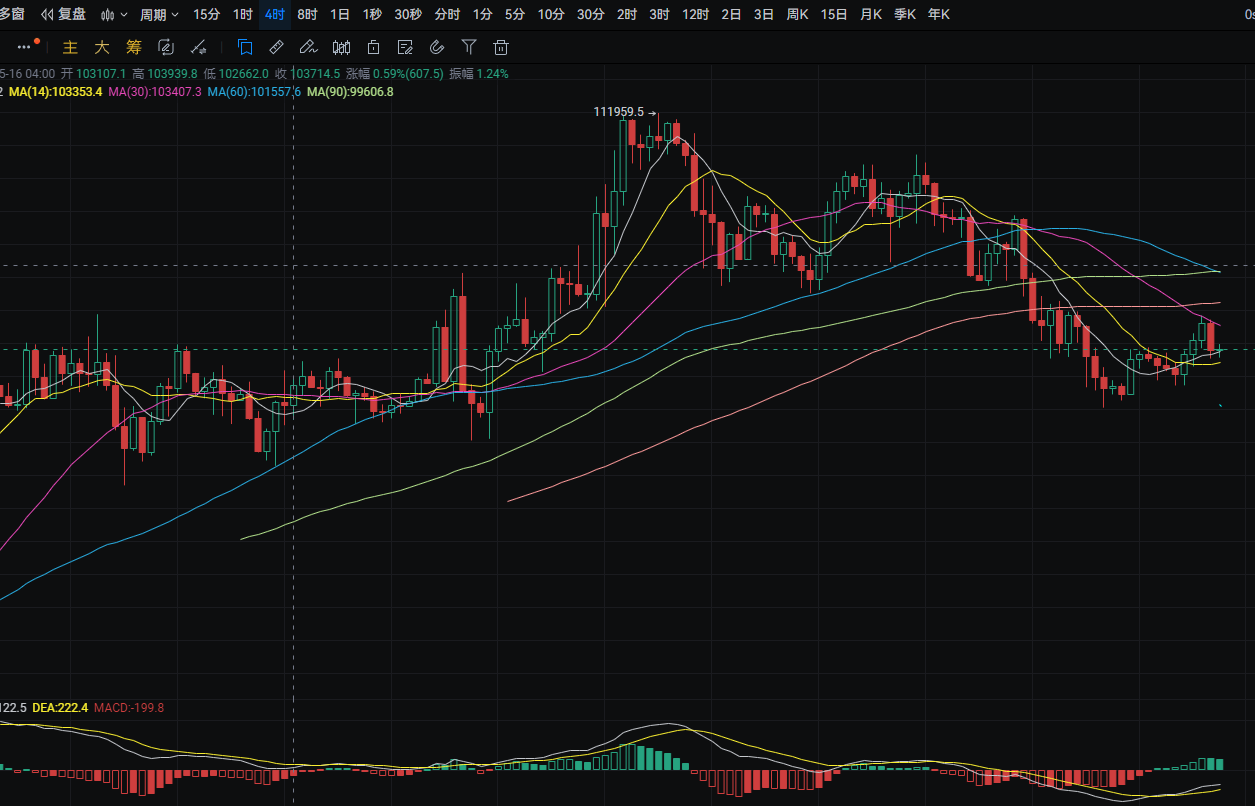
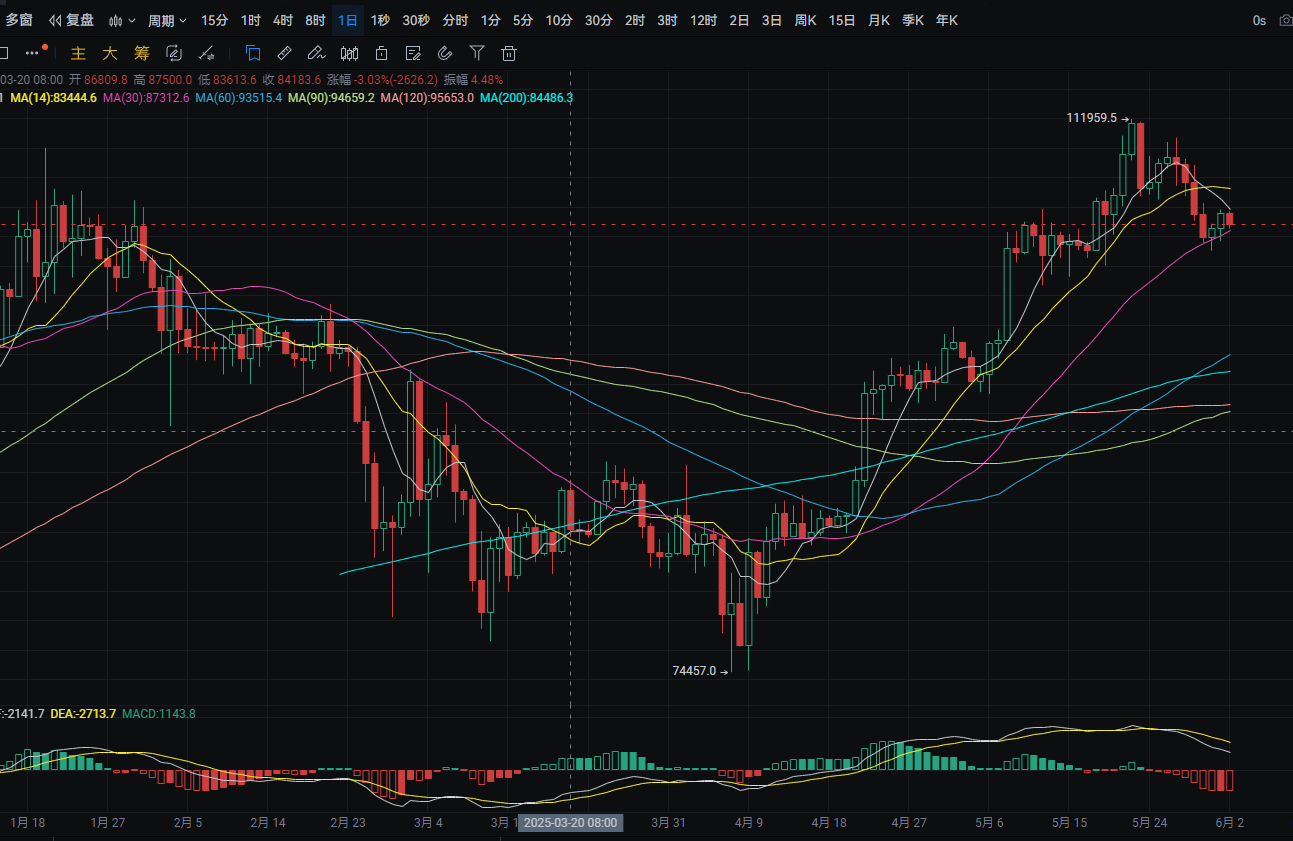
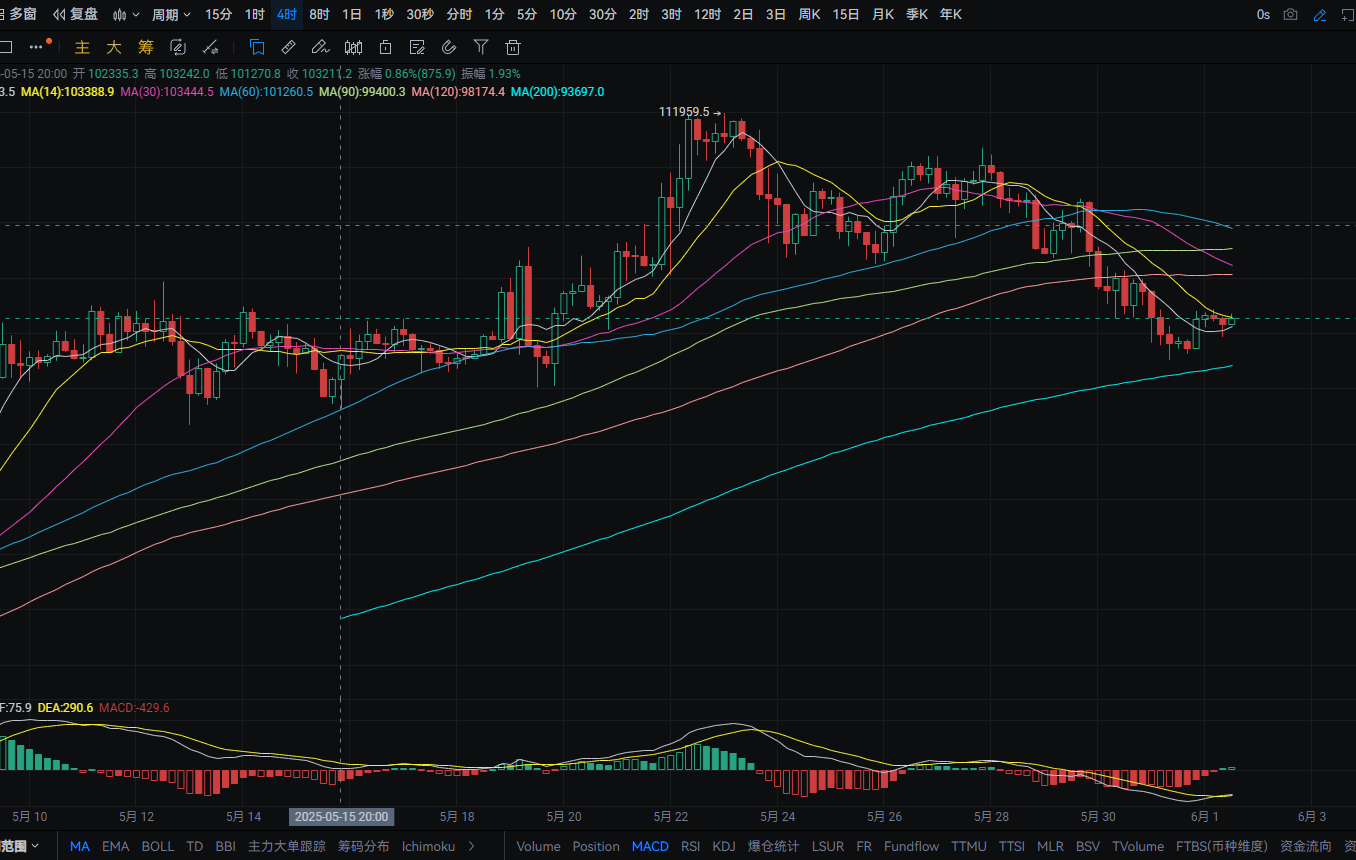
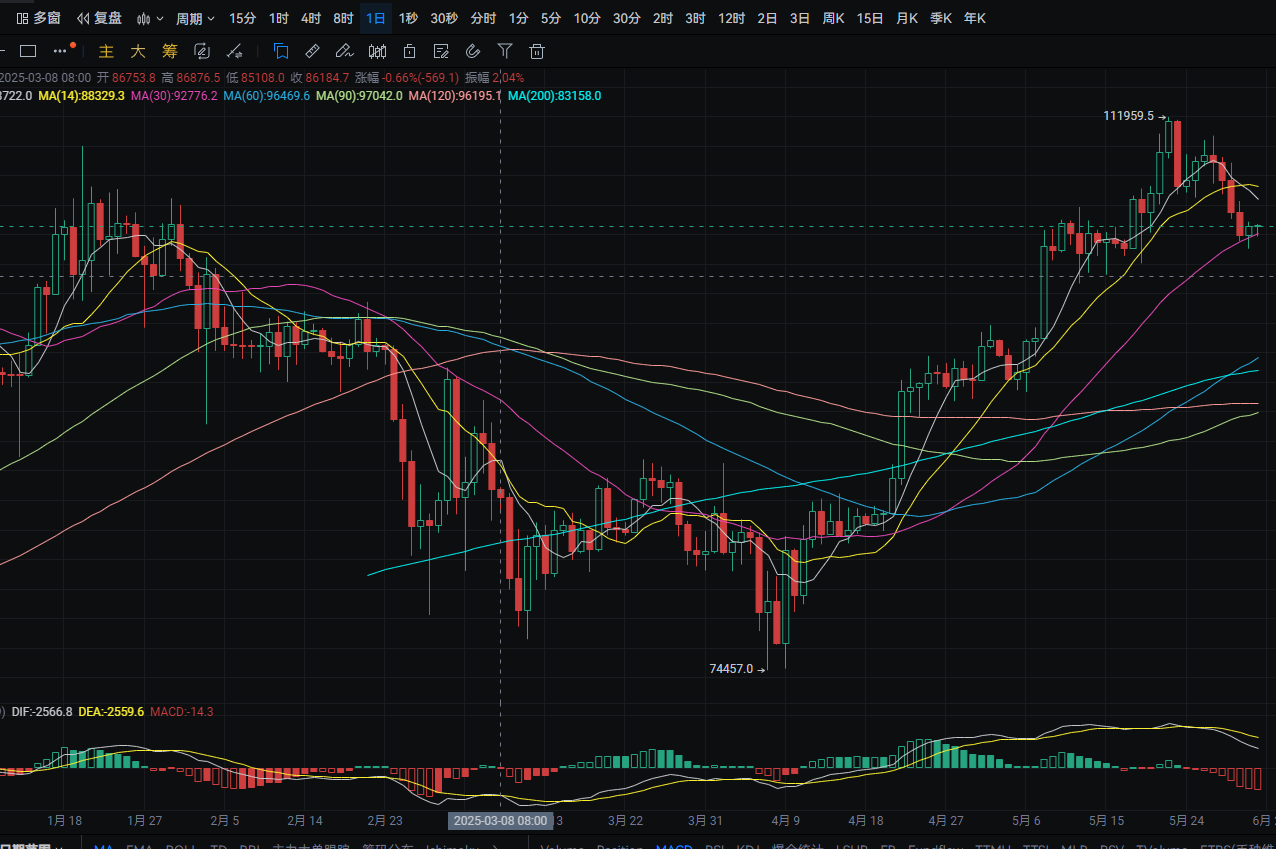
Bitcoin's daily line rose from a low of around 103,700 to a high of around 105,800 yesterday, closing around 105,600. The support level is near MA30; if it breaks, it can be seen around 103,350. A pullback can be bought near this level. The resistance level is at 106,450; if broken, it can be seen near MA14. MACD shows an increase in bearish momentum. The four-hour support level is near 104,000; if broken, it can be seen near MA200. A pullback can be bought near this level. The resistance level is near MA30; if broken, it can be seen near MA120. MACD shows an increase in bullish momentum, forming a golden cross.
ETH
Analysis
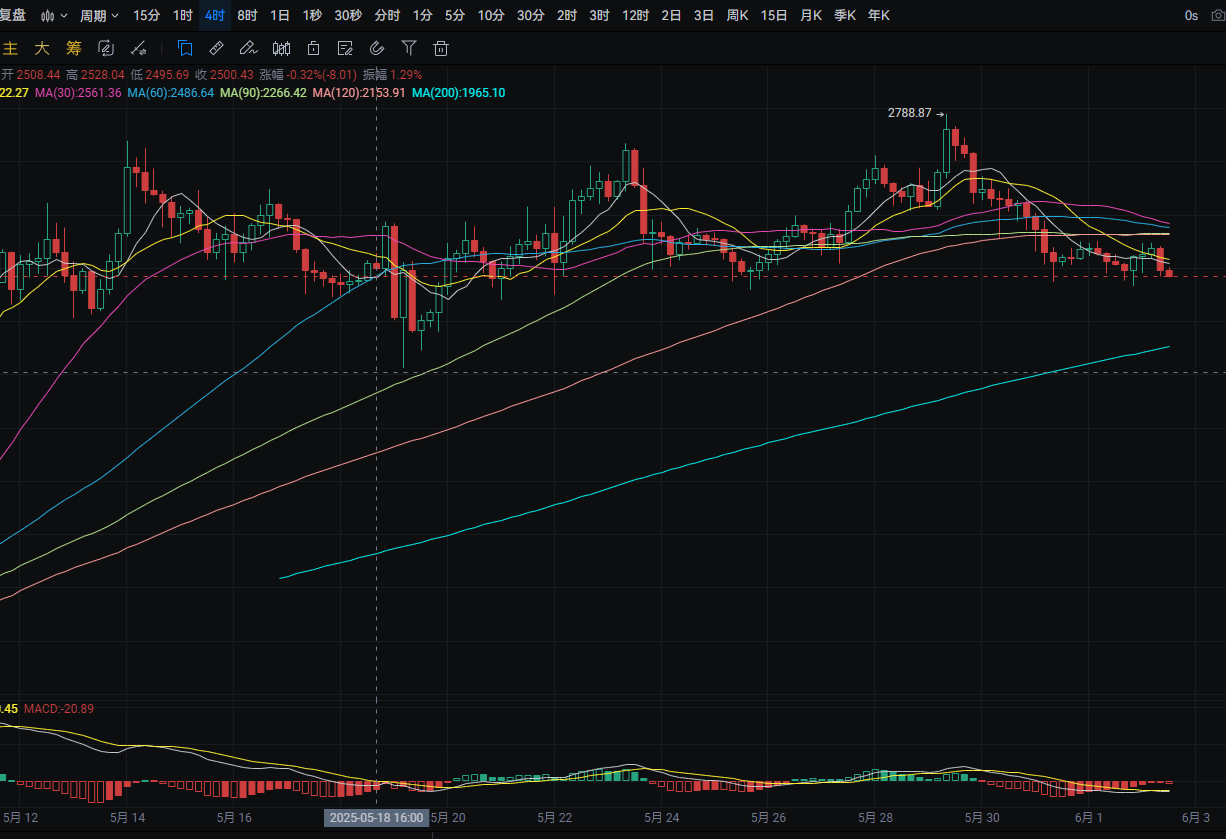
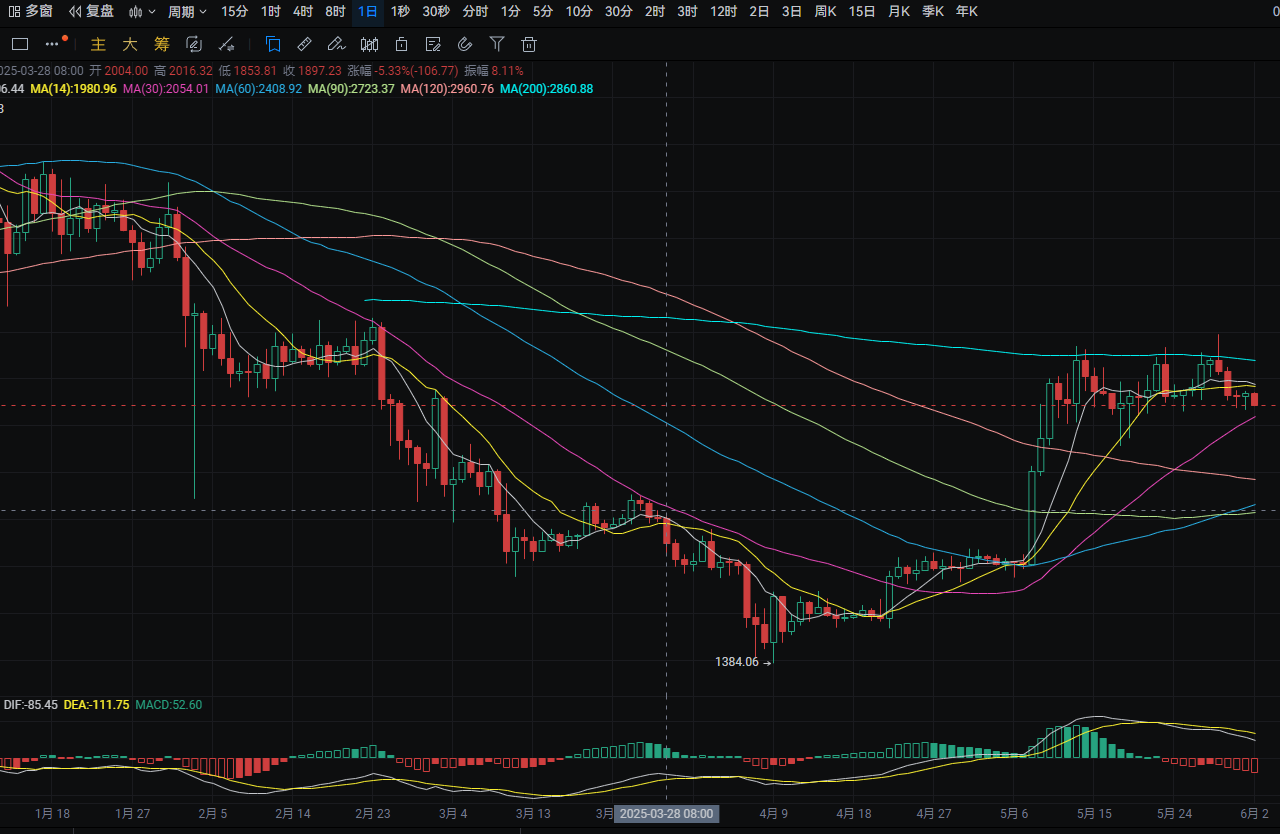
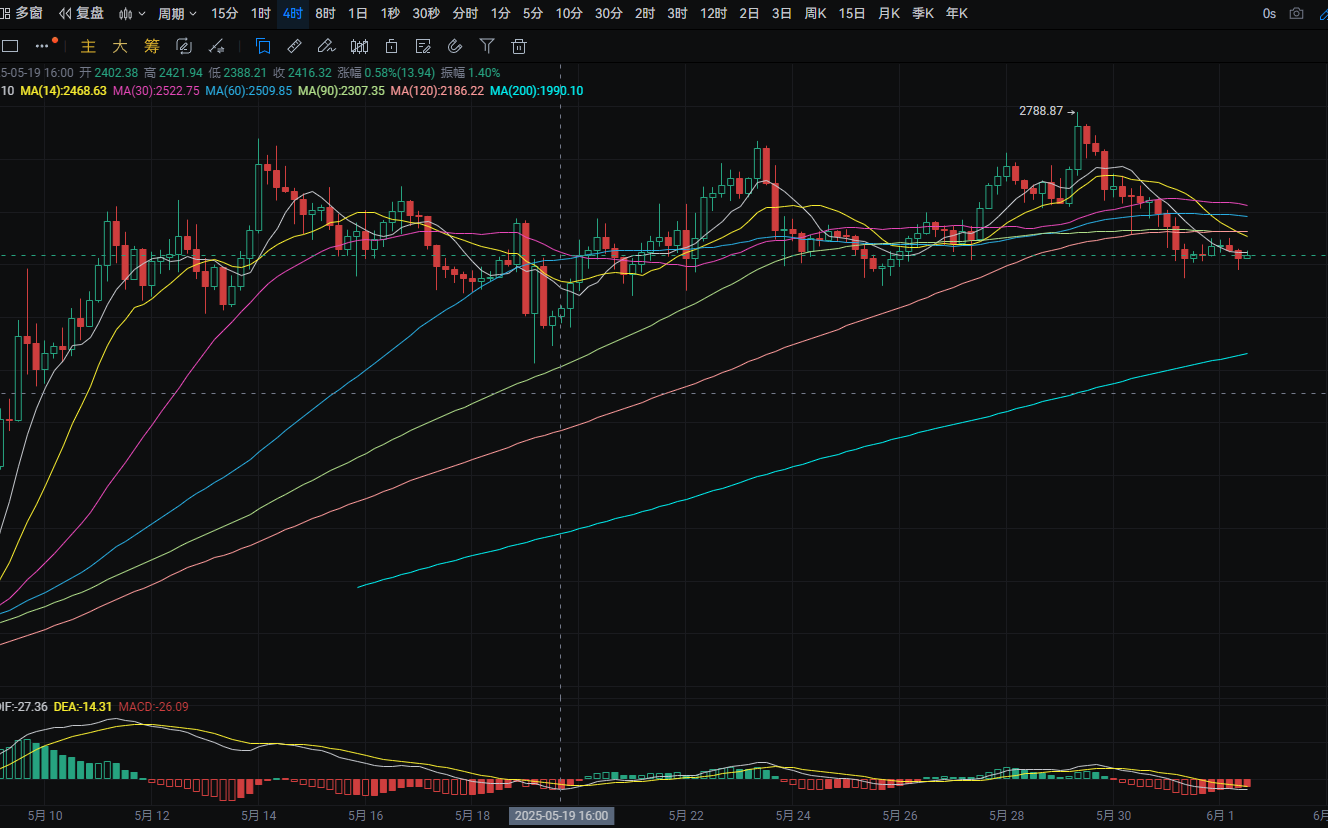
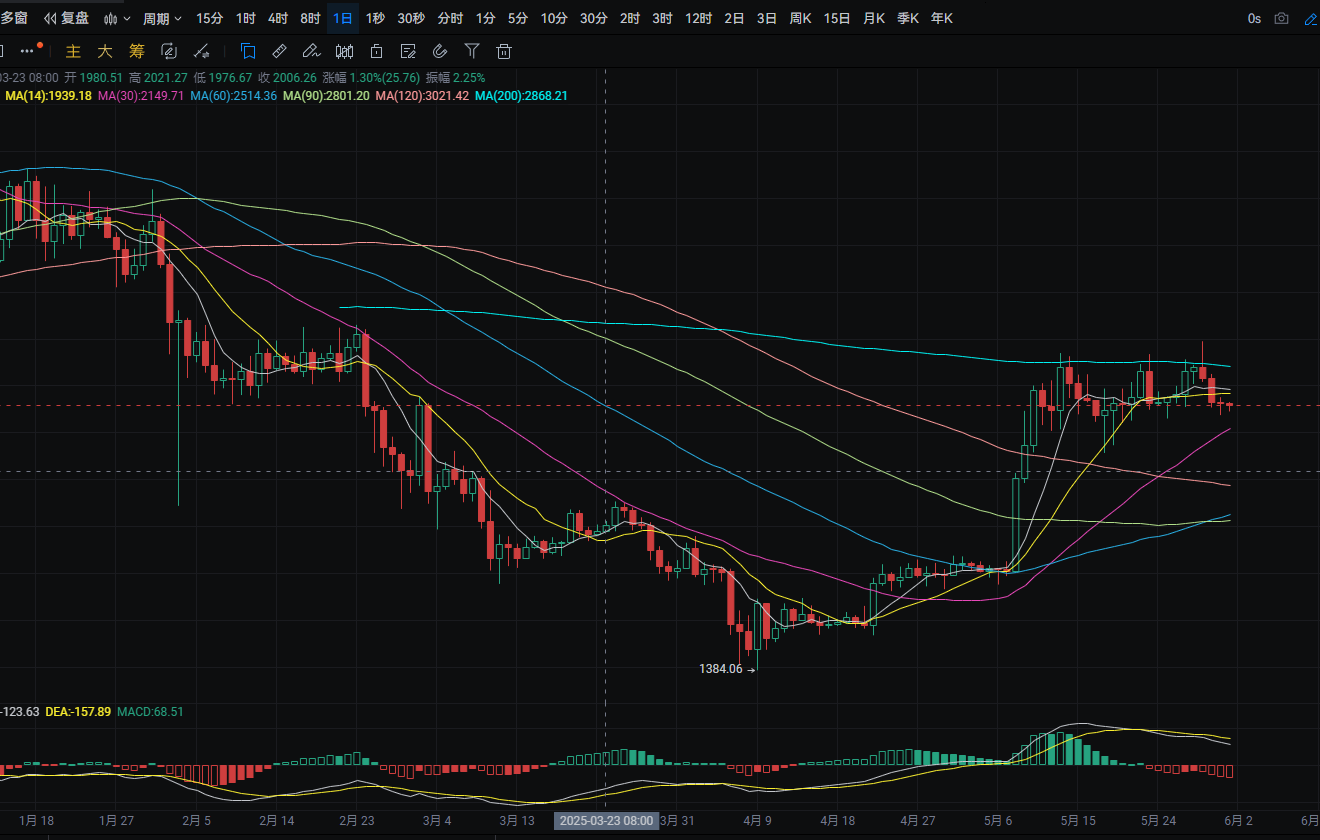
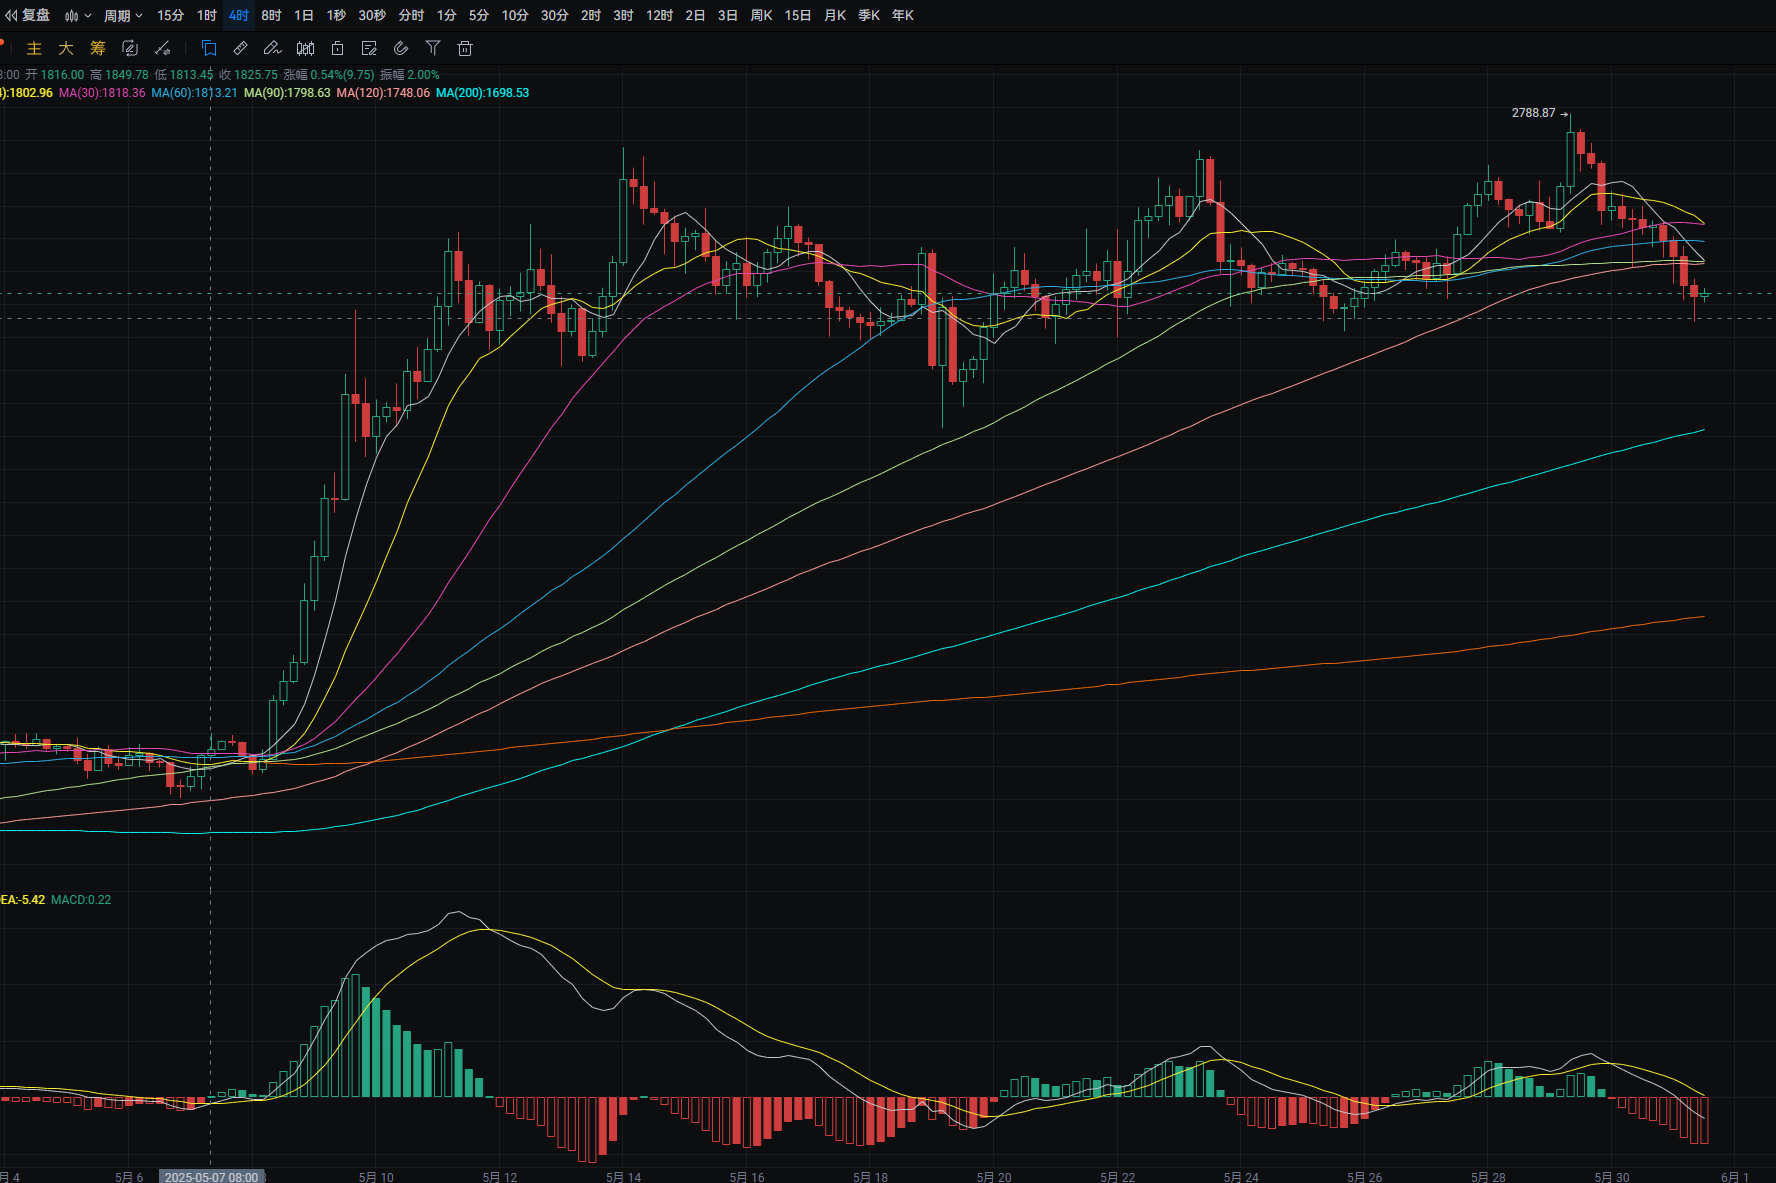
Ethereum's daily line rose from a low of around 2,465 to a high of around 2,545 yesterday, closing around 2,540. The support level is near MA30; if broken, it can be seen around 2,415. A pullback can be bought near this level. The resistance level is near the MA7 moving average; if broken, it can be seen near MA200. A rebound to this level can be shorted. MACD shows an increase in bearish momentum. The four-hour support level is near 2,475; a pullback can be bought near this level. The resistance level is near 2,545; if broken, it can be seen near MA30. A rebound to this level can be shorted. MACD shows a flat oscillation. A short-term buy can be made near 2,457-2,416, with a rebound target of around 2,540-2,583.
Disclaimer: The above content is personal opinion and for reference only! It does not constitute specific operational advice and does not bear legal responsibility. Market conditions change rapidly, and the article has a certain lag. If you have any questions, feel free to consult.
1. The SEC questions the legality of the Ethereum and Solana staking ETFs submitted by REX.
2. The IMF questions Pakistan's Bitcoin mining electricity plan and demands urgent clarification of its legality.
3. Slow Mist's Yu Xian: The main users of Ethereum's new mechanism EIP-7702 are theft gangs.
4. EU Commission spokesperson: The EU is ready to take countermeasures against the US's tariff increases.
5. Michael Saylor claims that the Bitcoin balance sheet strategy has exploded globally, while Wall Street remains skeptical.
Trading Insights
If you're stuck in a downtrend, don't fidget! Avoid these 6 things: 1. Staring at K-lines for support; the more you look, the more you fall into an emotional trap. 2. Scouring for positive articles to comfort yourself; fantasies won't save you from a downtrend. 3. Hanging out in communities and shouting "to the moon" with fellow holders; collective numbness is more dangerous. 4. Searching for bullish opinions on Twitter; you'll only be disturbed by noise. 5. Begging for big shots to comment; others' judgments are not as good as your own decisiveness. 6. Anxiety leads to becoming a "hater"; emotional trading is the most damaging to capital.
Timely stop-loss is not giving up; it's preserving strength for the next wave!
LIFE IS LIKE
A JOURNEY ▲
Below are the real trading signals from the Big White Community this week. Congratulations to the friends who followed along; if your operations are not going smoothly, you can come and test the waters.
The data is real, and each order has a screenshot from the time it was issued.
**Search for the public account: *Big White Talks Coins*
BTC
Analysis
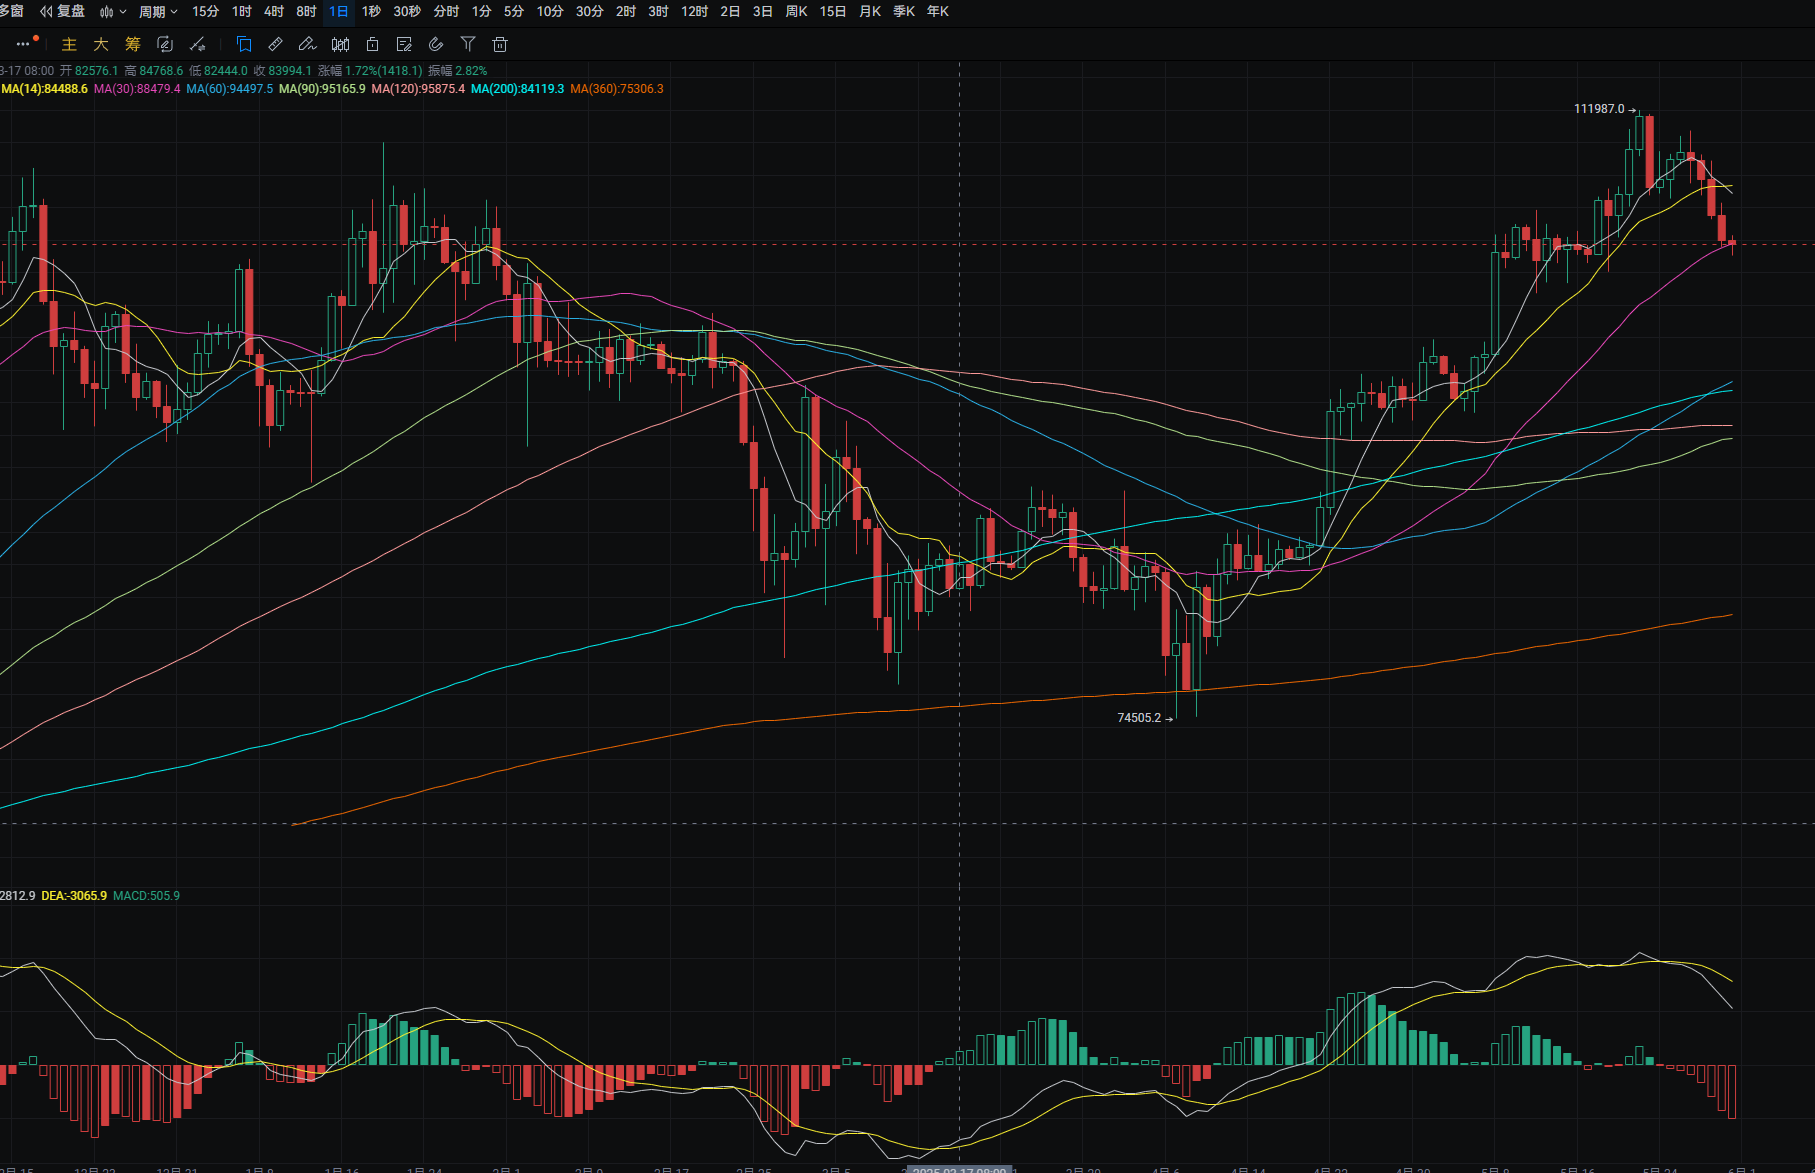
Bitcoin's daily line rose from a low of 103,050 to a high of around 104,900 yesterday, closing around 104,550. The support level is near 103,050; if broken, it can be seen around 102,000. A pullback can be bought near this level. The resistance level is near the MA7 moving average; if broken, it can be seen around 107,750. A rebound to this level can be shorted. MACD shows an increase in bearish momentum. The four-hour support level is near 103,650; if broken, it can be seen near MA200. A pullback can be bought near this level. The resistance level is near MA120; if broken, it can be seen near MA90. A rebound to this level can be shorted. MACD shows an increase in bullish momentum, with signs of forming a golden cross.
ETH
Analysis
Ethereum's daily line fell from a high of around 2,550 to a low of around 2,475 yesterday, closing around 2,525. The support level is near 2,475; if broken, it can be seen near MA30. A pullback can be bought near this level. The resistance level is near the MA7 moving average; if broken, it can be seen near MA200. A rebound to this level can be shorted. MACD shows an increase in bearish momentum. The four-hour support level is near 2,490; if broken, it can be seen around 2,450. A pullback can be bought near this level. The resistance level is near MA120; if broken, it can be seen near MA60. A rebound to this level can be shorted. MACD shows a decrease in bearish momentum.
Disclaimer: The above content is personal opinion and for reference only! It does not constitute specific operational advice and does not bear legal responsibility. Market conditions change rapidly, and the article has a certain lag. If you have any questions, feel free to consult.
May 31 Hot Topics:
1. SharpLink Gaming submits a $1 billion S-3 ASR registration, intending to use the raised funds to increase ETH holdings.
2. Trump plans to raise steel tariffs to 50%, providing political support for US Steel and Nippon Steel transactions.
3. BitMEX intercepts a Lazarus attack, exposing its split structure and security vulnerabilities.
4. Trump Media completes private financing, with $2.32 billion to be used for purchasing Bitcoin.
5. A US judge rejects the defense's request, refusing to order the DOJ to re-examine evidence in the Roman Storm case.
Trading Insights
After years in the crypto circle, I have summarized 8 trading techniques that combine "volume," which will definitely help you! 1. Bottom volume decreases without falling—signal of main force accumulation. ① Principle: In the bottom area, volume decreases while price stabilizes, with weak selling pressure and strong chip locking, allowing the main force to accumulate quietly. ② Application: Pay attention to not rush in; wait for a volume increase before entering. 2. High volume without price increase—warning of main force selling. ① Principle: High volume with stagnant price indicates a large amount of chips being sold, with the main force using high volume to offload. ② Application: Holders should be cautious and consider reducing positions or exiting. 3. Increased volume during price rise—password for trend continuation. ① Principle: Volume increases during a rise, indicating new funds are flowing in, and the bulls are strong, providing upward momentum. ② Application: Operate in the direction of the trend; if the pullback volume does not decrease, you can add to your position or hold. 4. Decreased volume during price drop—indicating bottom formation. ① Principle: Volume decreases during a drop, indicating weak selling willingness and exhaustion of the bears, approaching the bottom. ② Application: Do not blindly cut losses; wait for confirmation signals of the bottom before making decisions. 5. Sharp drop followed by slow rise—opportunity to go long at support. ① Principle: After a sharp drop, a slow rise indicates panic selling, and the bulls are repairing; if the support level holds, you can go long. ② Application: Set stop-loss at the support level, buy on dips, and target previous highs. 6. Sharp rise followed by slow drop—timing to short at resistance. ① Principle: After a sharp rise, a slow drop indicates exhaustion of the bulls; if the resistance level is met and falls back, you can short. ② Application: Set stop-loss at the resistance level, sell on highs, and target lower support levels. 7. Increased volume during price rise—warning of a pullback. ① Principle: After a large increase in volume, profit-taking and liquidation pressure is high, and the price needs to pull back to digest. ② Application: Appropriately reduce positions to lock in profits and wait for a pullback before re-entering. 8. Increased volume during price drop—rebound is imminent. ① Principle: A panic sell-off with increased volume indicates that after emotional release, the bears are exhausted, making it easy to rebound. ② Application: Aggressive traders can wait for stop-loss signals and lightly position for a rebound, setting appropriate stop-loss levels.
LIFE IS LIKE
A JOURNEY ▲
Below are the real trading signals from the Big White Community this week. Congratulations to the friends who followed along; if your operations are not going smoothly, you can come and test the waters.
The data is real, and each order has a screenshot from the time it was issued.
**Search for the public account: *Big White Talks Coins*
BTC
Analysis
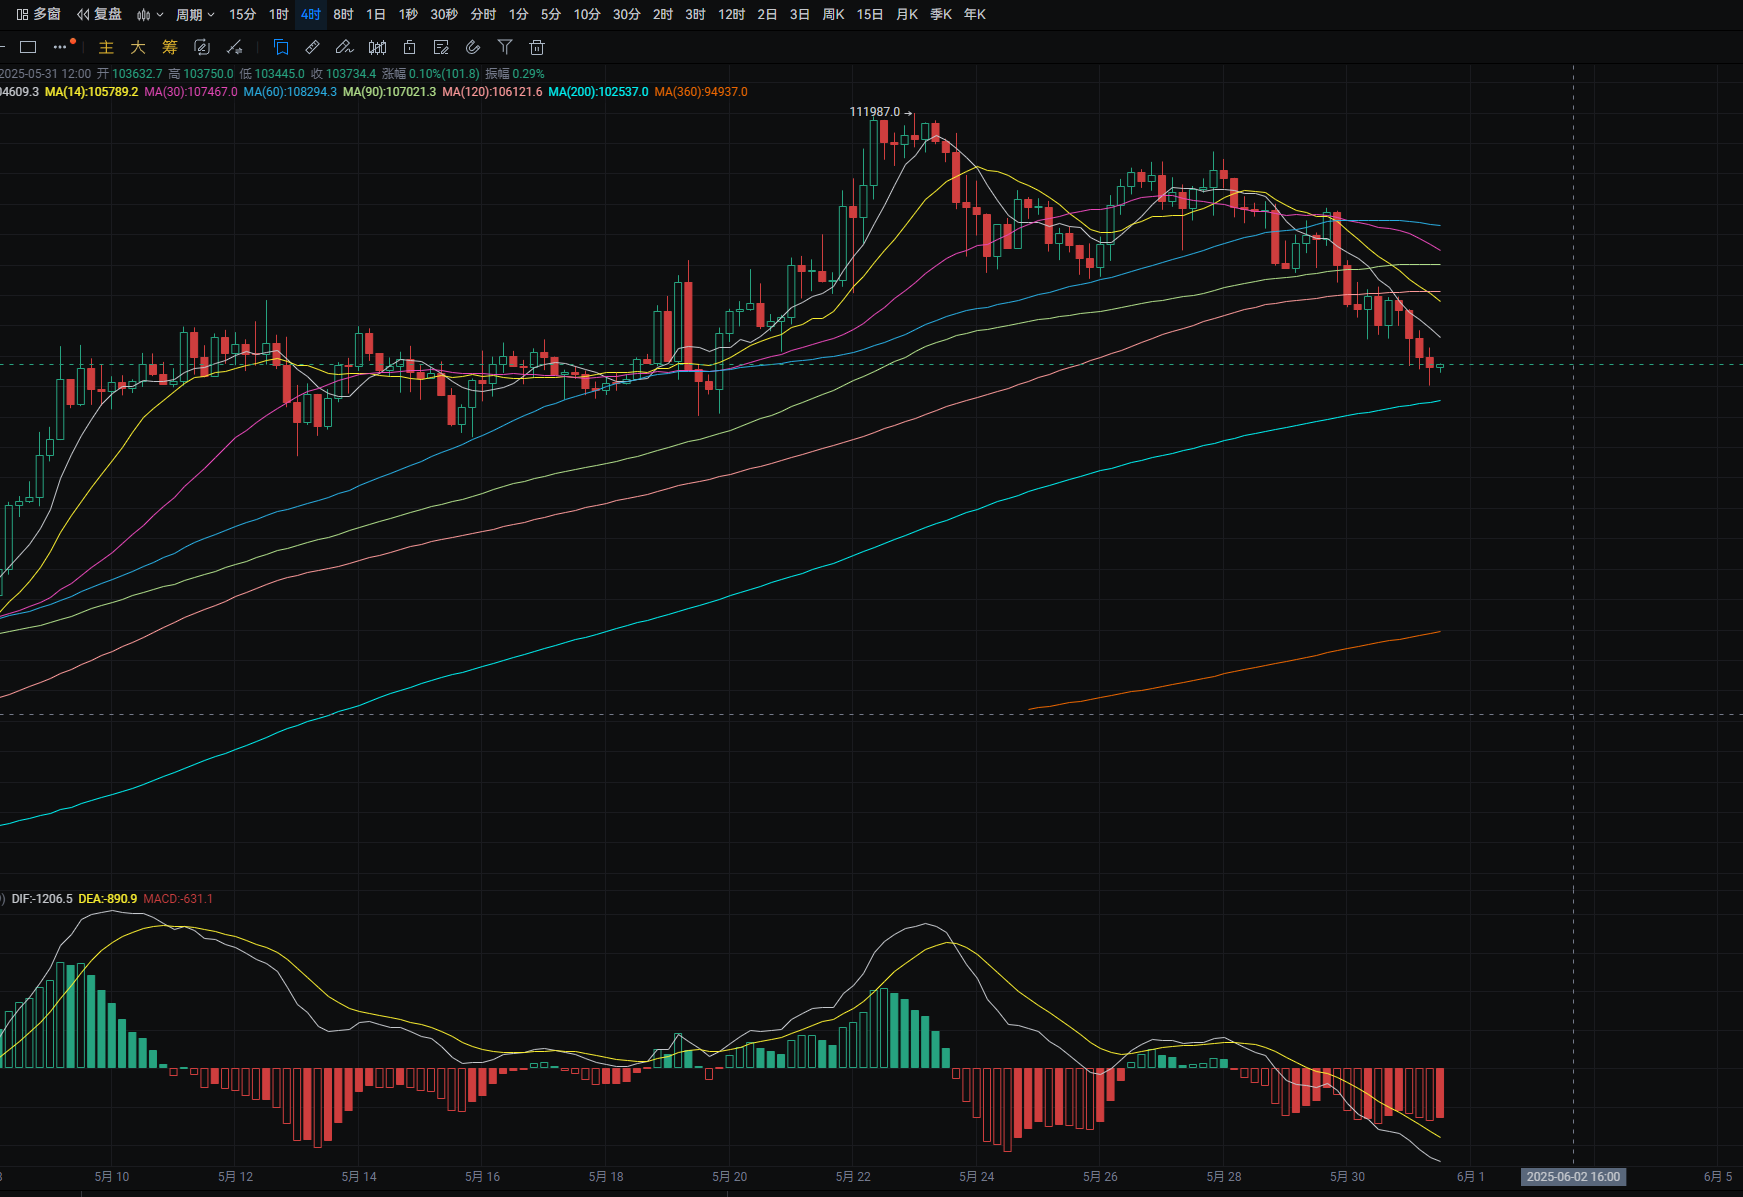
Bitcoin's daily line fell from a high of around 106,300 to a low of around 103,550 yesterday, closing around 103,950. The support level is near 102,350; if broken, it can be seen around 101,450. A pullback can be bought near this level. The resistance level is near 105,500; if broken, it can be seen near the MA7 moving average. MACD shows an increase in bearish momentum. The four-hour support level is near MA200; a pullback can be bought near this level. The resistance level is near the MA7 moving average; if broken, it can be seen near MA120. MACD shows an increase in bearish momentum.
ETH
Analysis
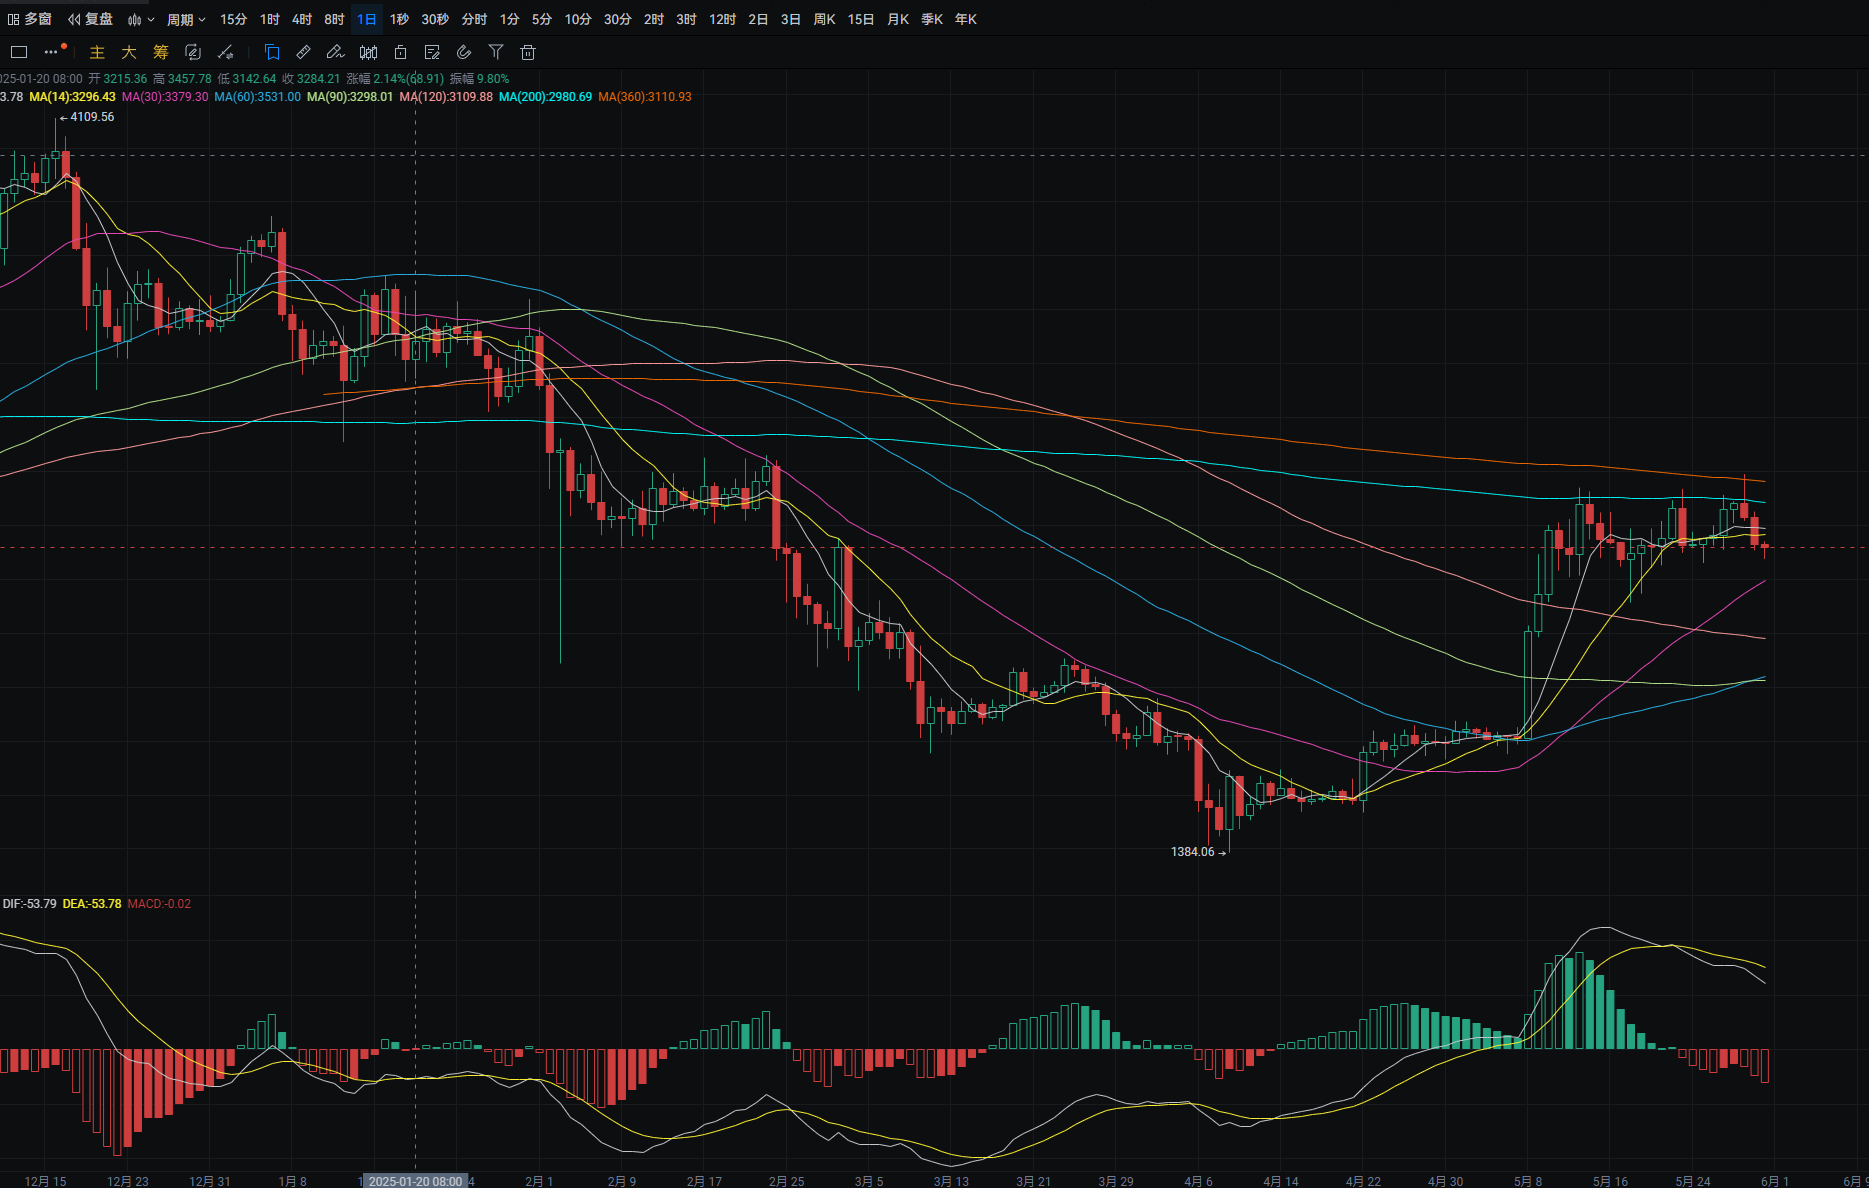
Ethereum's daily line fell from a high of around 2,650 to a low of around 2,505 yesterday, closing around 2,530. The support level is near 2,450; if broken, it can be seen near MA30. A pullback can be bought near this level. The resistance level is near the MA7 moving average; if broken, it can be seen near MA200. A rebound to this level can be shorted. MACD shows an increase in bearish momentum. The four-hour support level is near 2,475; if broken, it can be seen around 2,435. A pullback can be bought near this level. The resistance level is near MA120; if broken, it can be seen near MA30. MACD shows an increase in bearish momentum, forming a death cross.
Disclaimer: The above content is personal opinion and for reference only! It does not constitute specific operational advice and does not bear legal responsibility. Market conditions change rapidly, and the article has a certain lag. If you have any questions, feel free to consult.
免责声明:本文章仅代表作者个人观点,不代表本平台的立场和观点。本文章仅供信息分享,不构成对任何人的任何投资建议。用户与作者之间的任何争议,与本平台无关。如网页中刊载的文章或图片涉及侵权,请提供相关的权利证明和身份证明发送邮件到support@aicoin.com,本平台相关工作人员将会进行核查。


