From May 13 to May 26, 2025, Bitcoin (BTC) broke through 110,000 USDT, reaching a historic high and maintaining an upward trend, while ETH entered a consolidation phase. The contract positions for BTC and Ethereum (ETH) increased, with continuous capital inflow; however, the Long/Short Ratio (LSR) did not strengthen in tandem, and market sentiment remained cautious. The funding rate for ETH fluctuated slightly more than that of BTC, with short-term signals indicating local bearish pressure. The overall liquidation in the contract market was primarily from long positions, reflecting a strong willingness among bulls to chase prices higher during the high-level fluctuations. The quantitative analysis employed the "Bollinger Band Reversal Strategy," which, under optimal parameter selection, yielded an annualized return of over 66% for ETH.
Introduction
This quantitative biweekly report (from May 13 to May 26, 2025) focuses on the market performance of Bitcoin and Ethereum, systematically analyzing key indicators such as long/short ratios, contract positions, and funding rates to provide a quantitative interpretation of the overall market situation. This issue's quantitative strategy module emphasizes the practical application of the "Bollinger Band Reversal Strategy" among the top ten cryptocurrency projects by market capitalization (excluding stablecoins), detailing its strategic logic, signal determination mechanism, and execution framework. Through systematic parameter optimization and historical backtesting, this strategy demonstrates good stability in trend recognition and risk control, with clear execution discipline. Compared to simply holding BTC and ETH, this strategy shows superior advantages in both returns and drawdown control, providing a practical reference framework for quantitative trading.
Summary
Market Overview
To systematically present the current changes in capital behavior and trading structure in the cryptocurrency market, this report examines five key dimensions: the price volatility of Bitcoin and Ethereum, the Long/Short Ratio (LSR), contract positions, funding rates, and market liquidation data. These five indicators encompass price trends, capital sentiment, and risk conditions, providing a comprehensive reflection of the current market's trading intensity and structural characteristics. The following sections will analyze the latest changes in each indicator since May 13:
- Analysis of Bitcoin and Ethereum Price Volatility
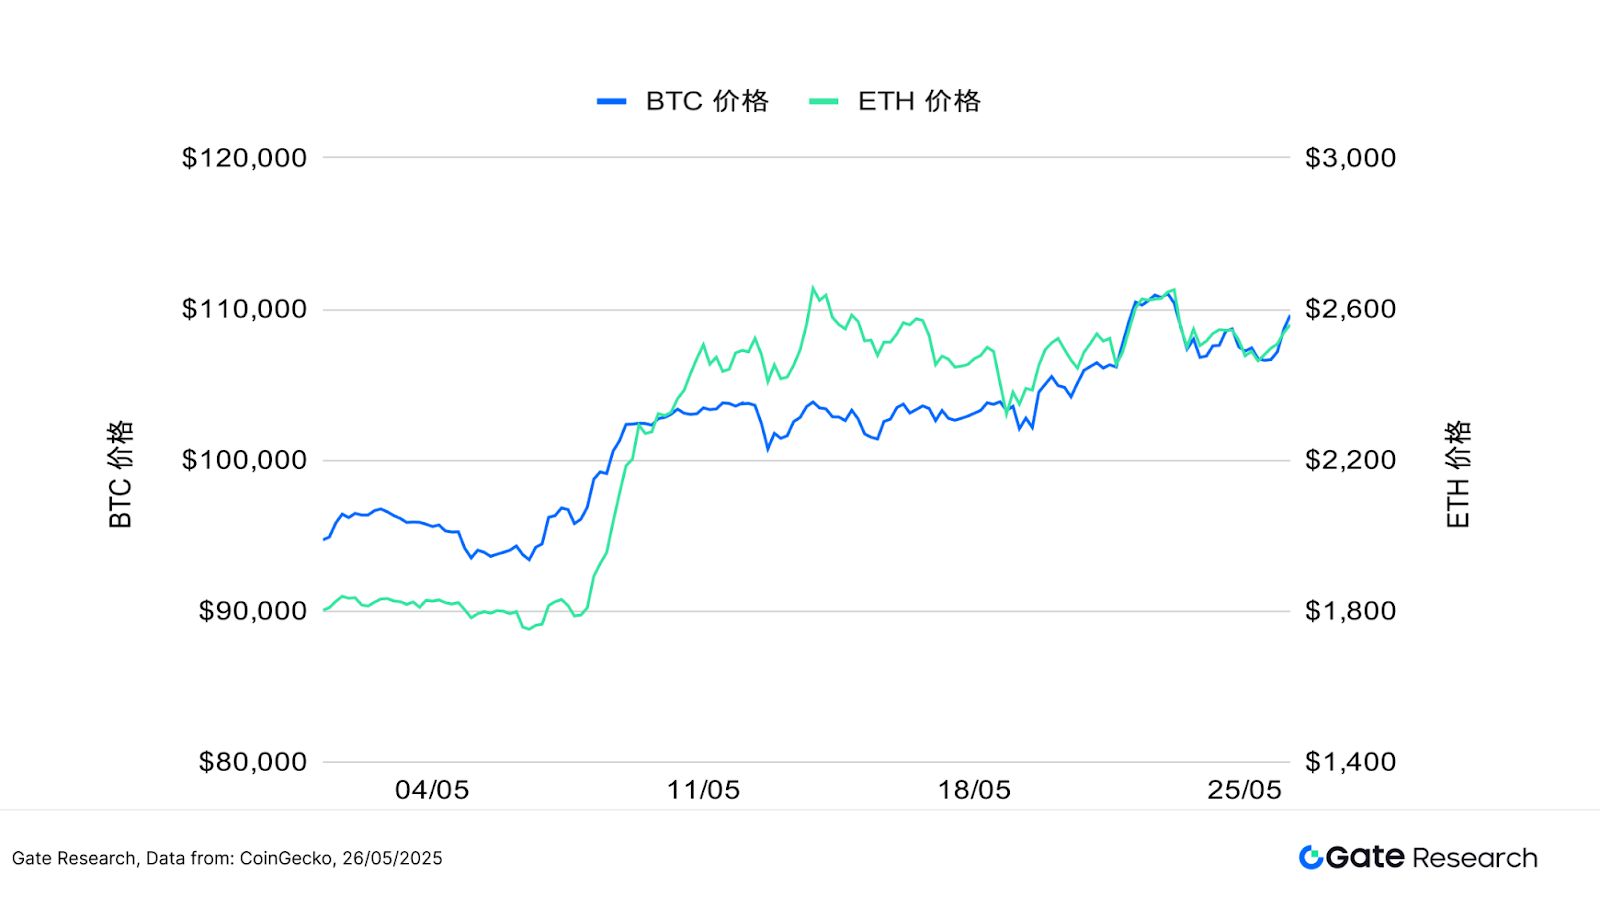
According to CoinGecko data, since May 13, BTC has maintained an upward trend, while ETH has been consolidating. ETH was more active initially, rising to 2,600 USDT first, but then entered a consolidation phase. In contrast, BTC steadily strengthened, with capital gradually flowing back. On May 22, BTC officially broke through the key level of 110,000 USDT, reaching a historic high of 111,814 USDT after three months, indicating a significant increase in market attention and allocation.
Driven by multiple favorable factors, BTC's upward momentum is strong, with a cumulative increase of over 20% this year, and its total market capitalization rising to 2.19 trillion USDT, surpassing Amazon (2.13 trillion) and Google (2.05 trillion), making it the fifth-largest asset by market capitalization globally, only behind Apple. This round of price increase is primarily driven by two factors: first, the easing of trade tensions between the U.S. and China, leading to a decline in market risk aversion; second, Moody's downgrade of the U.S. sovereign credit rating, prompting investors to seek alternative assets outside the dollar, thereby enhancing BTC's allocation attractiveness.
In terms of volatility, since May 13, ETH's volatility has surged multiple times, overall being higher than BTC, indicating stronger short-term market sentiment fluctuations during its price movements, especially showing significant peaks in mid-May. In contrast, BTC's volatility has remained relatively stable, without significant abnormal fluctuations, reflecting its price trend's resilience and structural support.
As seen in the chart, ETH's volatility spiked above 4% in mid-May, significantly higher than BTC during the same period, indicating that ETH experienced greater short-term capital speculation during the breakout. Overall, BTC's volatility distribution is relatively even, while ETH's volatility is concentrated at key points, highlighting its greater sensitivity to external positive factors.
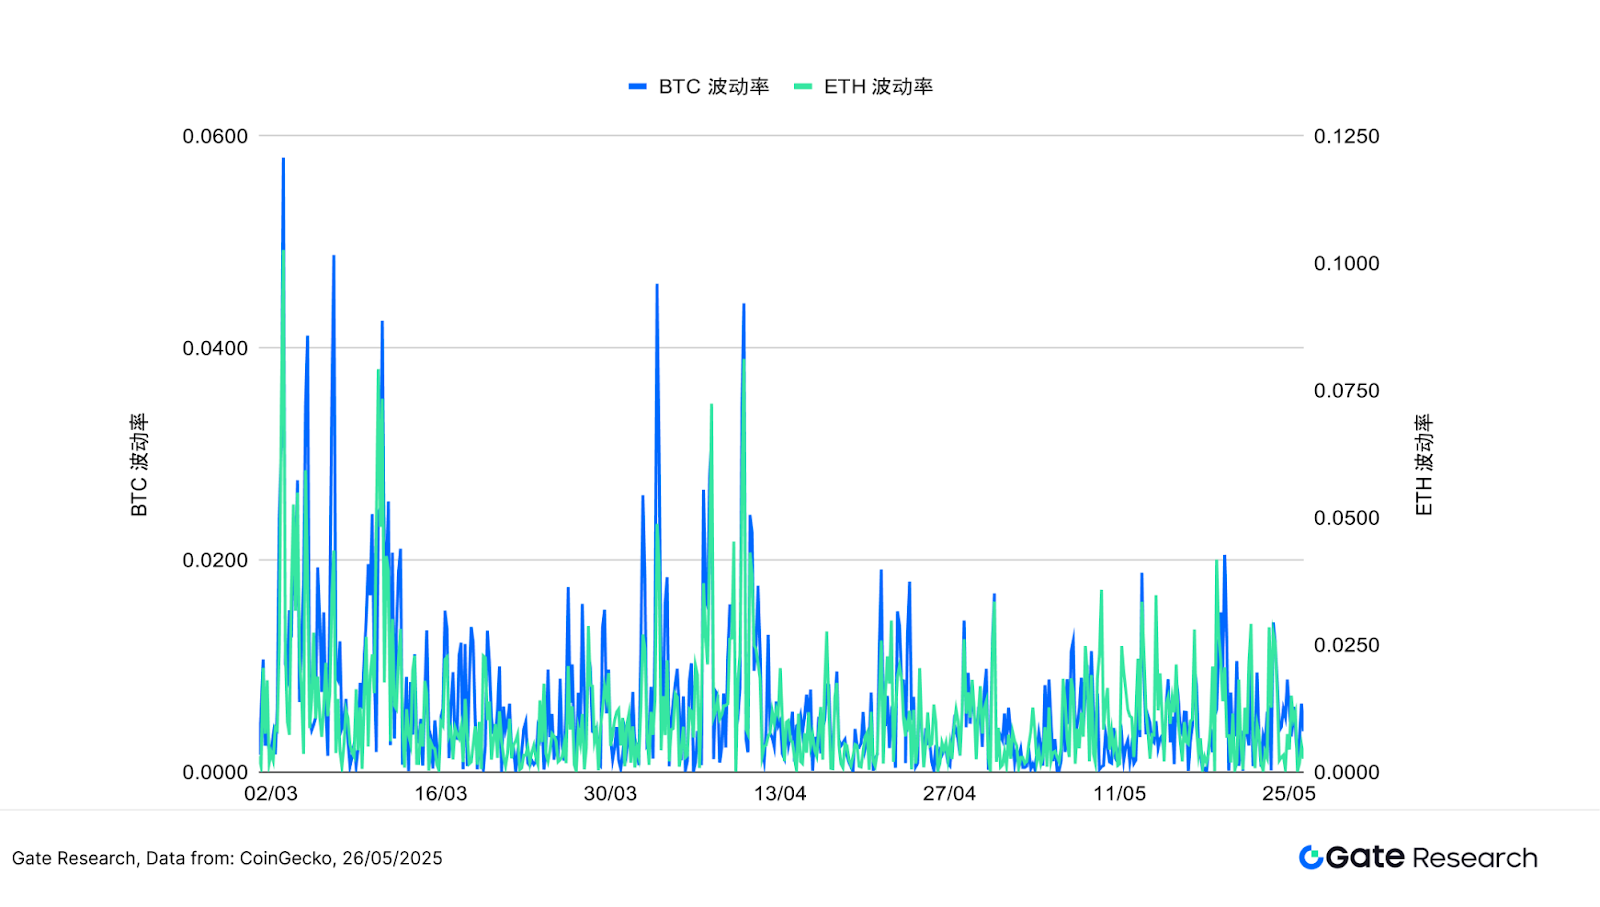
Overall, BTC has performed strongly in this round of market activity, not only reaching a historic high but also maintaining a robust overall trend, with a relatively even volatility distribution, reflecting its characteristics as a safe haven and store of value in the current market environment. In contrast, while ETH briefly rose to 2,600 USDT earlier, its overall increase has been limited, and its subsequent performance has been weaker, with concentrated volatility increases indicating that, although it reacts to external positive news, it struggles to sustain upward momentum, with relatively insufficient capital drive. The divergence in the performance of the two assets reflects a reordering of market asset allocation. In the short term, BTC's price momentum and volatility trends can be seen as key indicators for assessing market risk appetite and liquidity direction, while ETH's performance still needs to be observed for further fundamental catalysts.
- Analysis of Bitcoin and Ethereum Long/Short Trading Size Ratio (LSR)
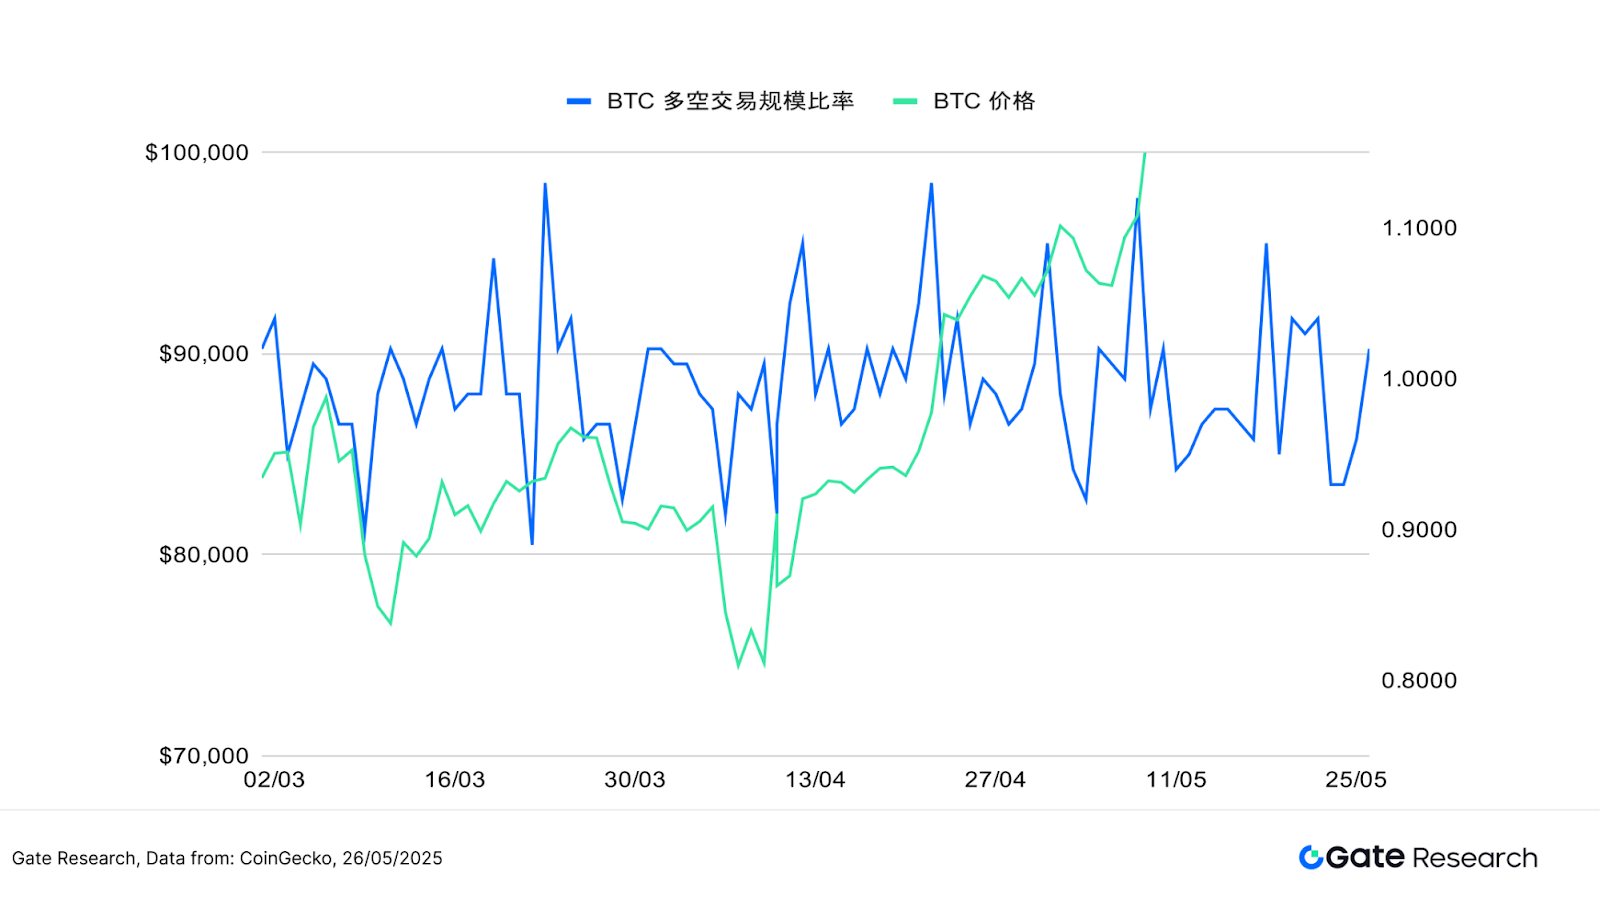
The Long/Short Trading Size Ratio (LSR) is a key indicator measuring the trading volume of long versus short positions in the market, typically used to assess market sentiment and trend strength. When LSR is greater than 1, it indicates that the volume of active buying (long positions) exceeds that of active selling (short positions), suggesting a market inclination towards bullish sentiment.
According to Coinglass data, since May 13, BTC's price has steadily risen, reaching a historic high during intraday trading on May 22. However, the LSR did not rise in tandem, remaining around 1 and even dipping below 1 multiple times, indicating that despite the continuous price highs, there remains significant bearish positioning in the market. Particularly after May 18, as BTC's price continued to climb, the LSR fell below 0.95 at one point, reflecting that some capital was inclined to hedge or position short at high levels, leading to a cautious market sentiment.
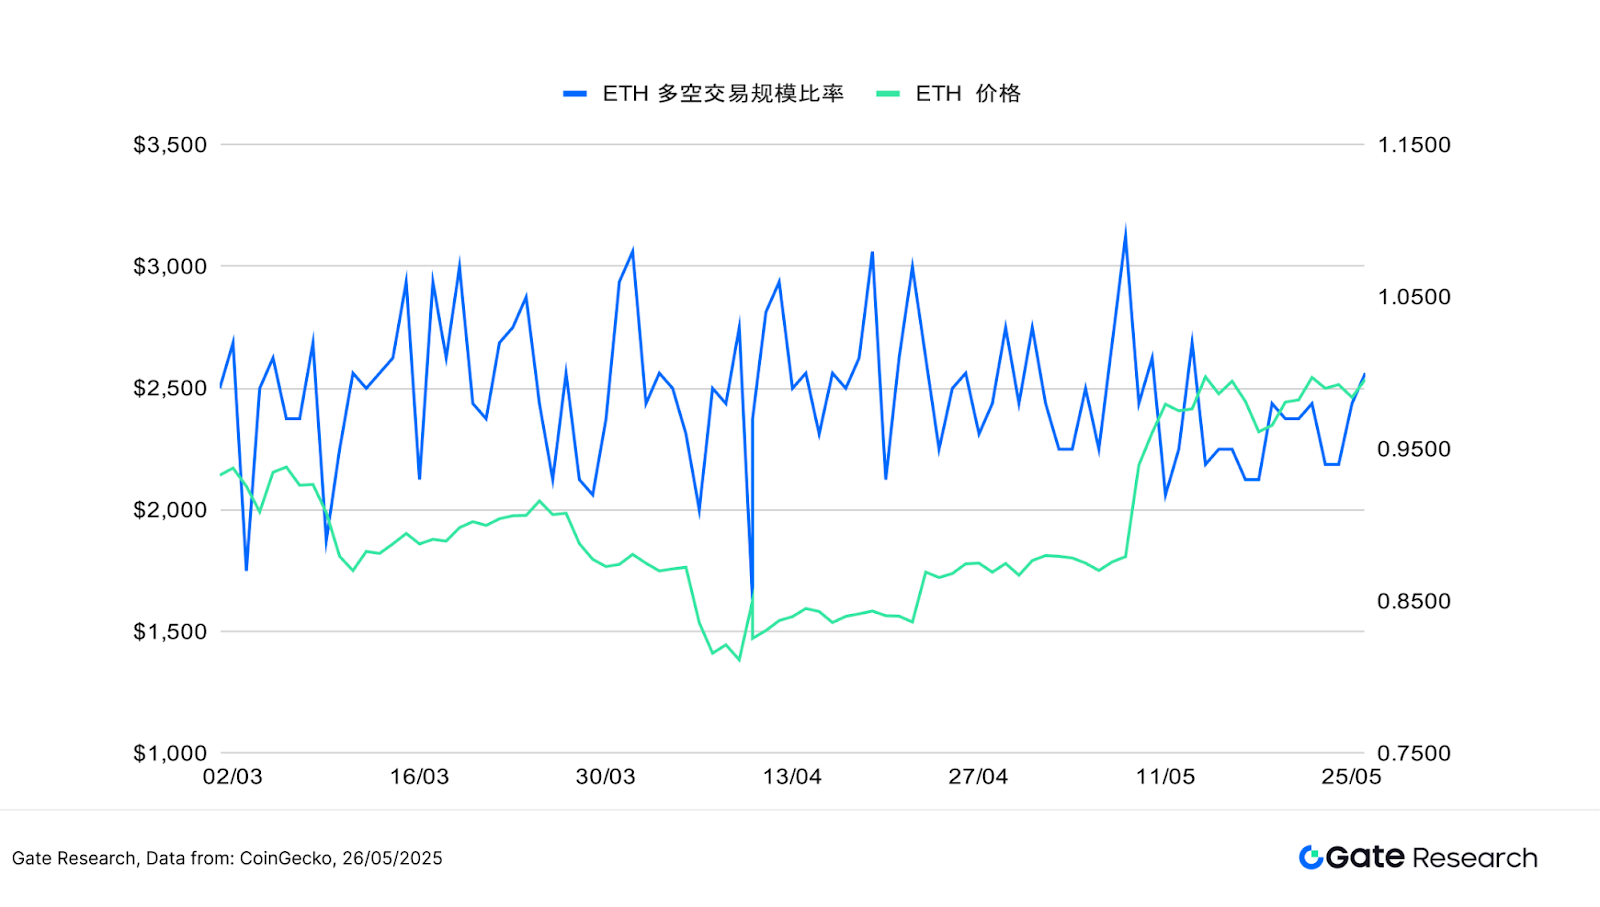
The situation for ETH showed more volatile changes in LSR; although its price rose to 2,600 USDT, the LSR never stabilized above 1, instead exhibiting significant fluctuations, indicating that ETH did not gain sustained bullish dominance during its rise, with strong bearish forces still present in the market and a lack of clear trend consensus.
Overall, although BTC's price has been on an upward trend in the past two weeks, the LSR indicator has not strengthened in tandem, reflecting market doubts about the sustainability of high levels. Investors are maintaining a wait-and-see and hedging attitude during the upward trend, indicating that this round of increases is more driven by short-term sentiment and news, with structural bullish support still needing verification. In the short term, the continued recovery of the LSR will be a key indicator for assessing whether the market can sustain its upward trajectory.
- Analysis of Contract Positions
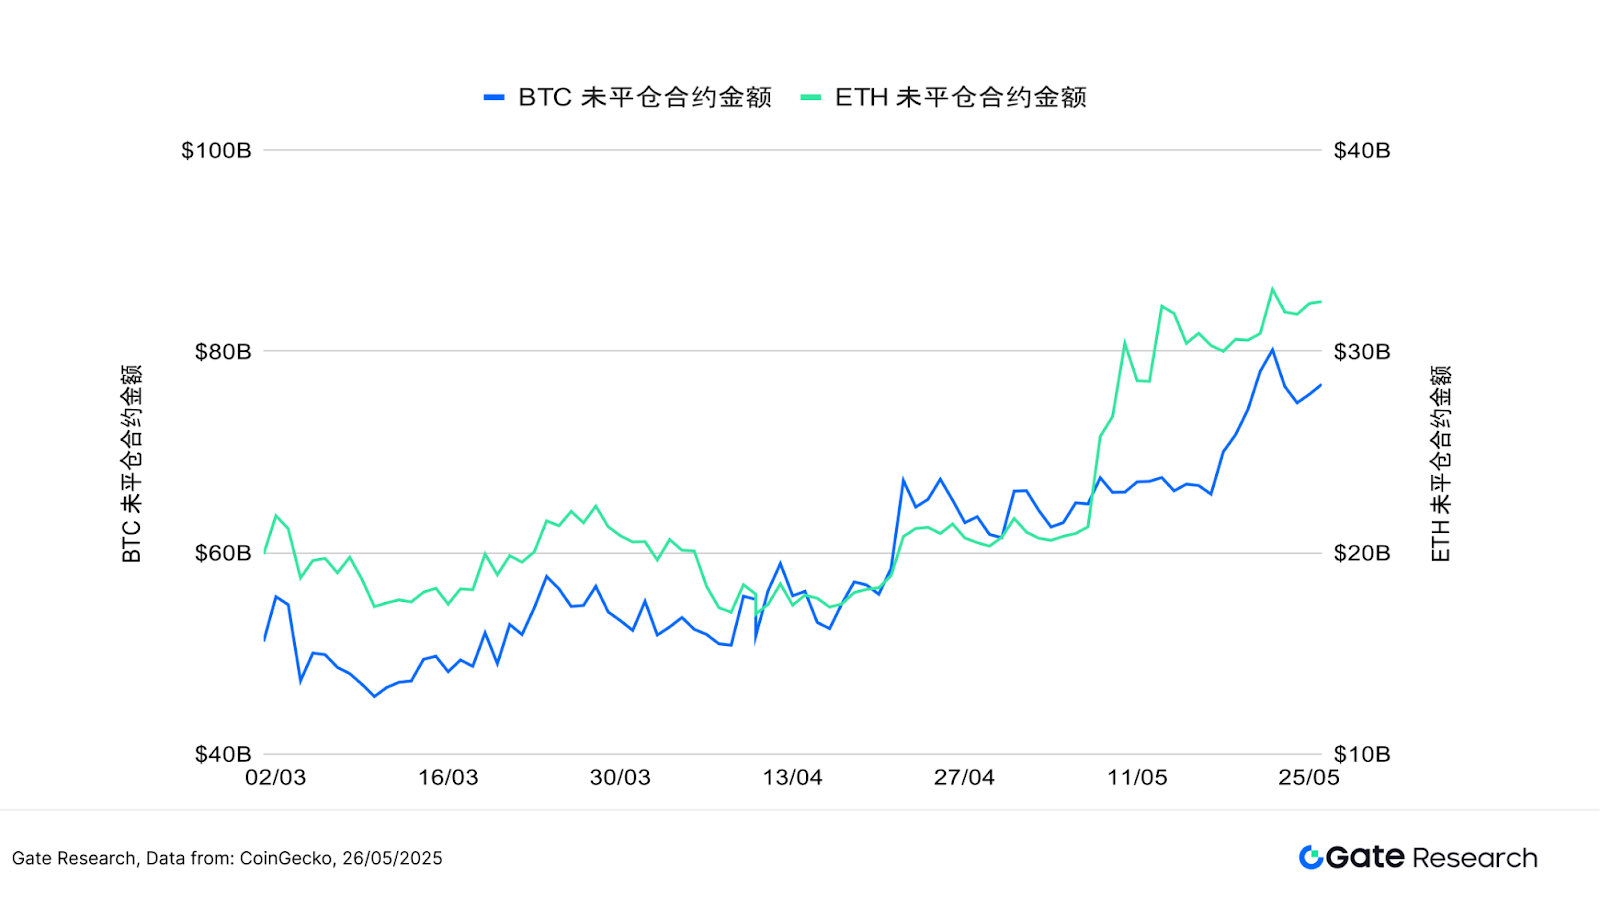
According to Coinglass data, since May 13, the contract positions for both BTC and ETH have continued to grow, indicating an increase in market trading enthusiasm and leverage participation. BTC's contract positions have steadily risen from about 70 billion USDT, breaking through 80 billion USDT around May 20, and although there was a slight pullback afterward, it has remained at a relatively high level, reflecting the continued inflow of capital during the price increase. In contrast, ETH's contract positions have remained relatively stable, rising from about 27 billion USDT to around 32 billion USDT, with smaller fluctuations, indicating a more moderate pace of capital allocation in the ETH contract market.
Overall, although both BTC and ETH's contract positions have risen in tandem, indicating increased market trading activity, the Long/Short Ratio (LSR) has not strengthened correspondingly, reflecting that while capital continues to flow in, market sentiment remains cautious. The upward trend is still accompanied by significant divergences and hedging operations, and the structural bullish trend still requires further confirmation.
- Funding Rates
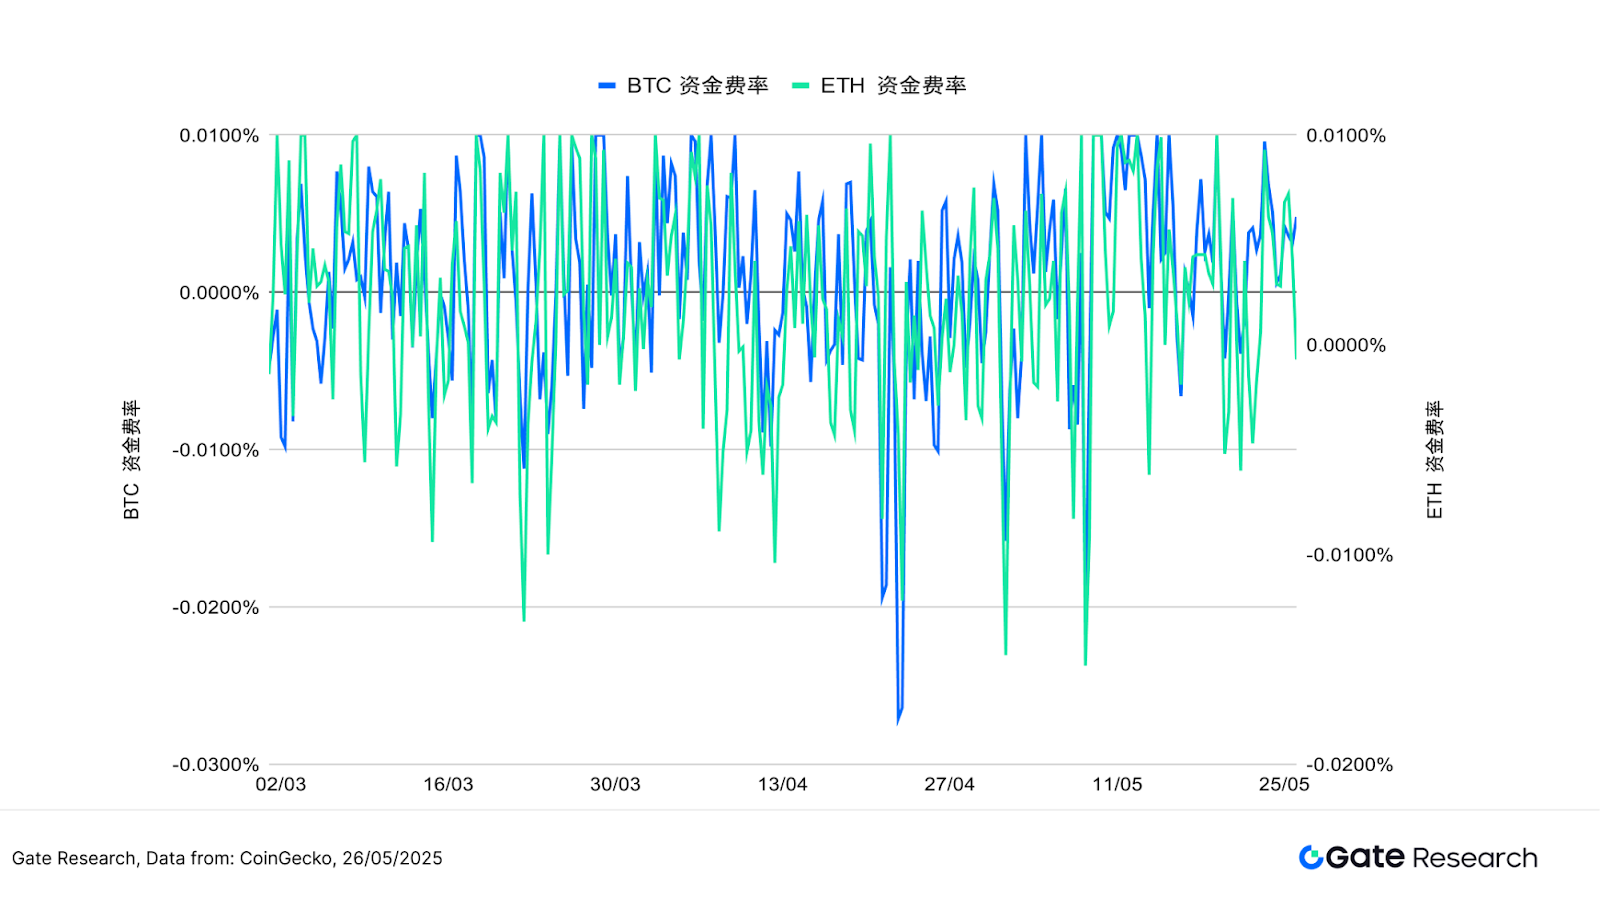
The funding rates for BTC and ETH have generally fluctuated slightly around 0%, frequently switching between positive and negative, indicating that the forces of bulls and bears in the market remain relatively balanced, with sentiment not significantly leaning in one direction. Despite the simultaneous rise in price and contract positions during this period, the funding rates have not significantly increased, mostly operating within the range of 0% to 0.01%.
This trend reflects that while there are certain bullish expectations in the current market, leverage positions remain relatively restrained, with no large-scale chasing of long positions observed, and overall capital sentiment is neutral to slightly bullish. The funding rate for ETH fluctuates slightly more than that of BTC, with short-term signals indicating local bearish pressure, suggesting that the market is maintaining a cautious wait-and-see attitude before key price levels. Overall, the funding rate trend verifies that the current market is still in a moderately optimistic bullish phase and has not entered an overheated state.
- Cryptocurrency Contract Liquidation Chart
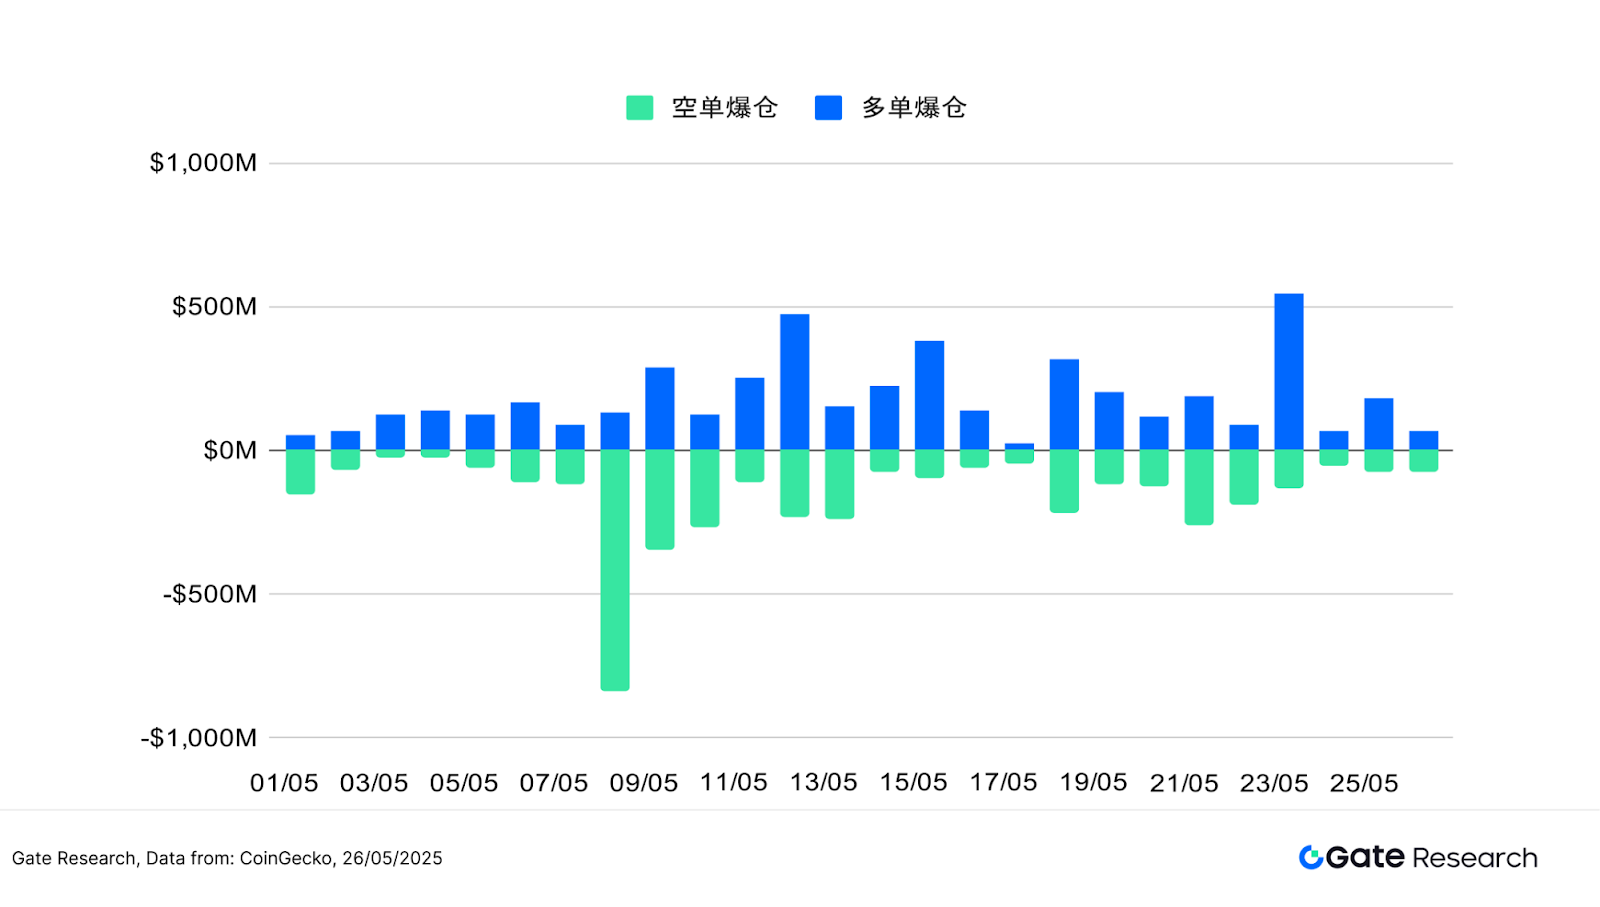
According to Coinglass data, the total amount of long position liquidations in the cryptocurrency market over the past two weeks reached 2.697 billion USDT, significantly higher than the 1.76 billion USDT in short position liquidations, indicating a strong willingness among bulls to chase prices higher during high-level fluctuations, but also making them more susceptible to strong liquidations due to reverse pullbacks. In comparison, the market has shifted from being dominated by previous short liquidations to an increase in recent long liquidations, reflecting that the current market has entered a high-level consolidation phase, with increased risks of chasing prices higher and capital being more sensitive to short-term fluctuations. The contract market remains in an environment of high leverage and high risk, and operations should focus on the potential liquidation pressure from position leverage and amplified volatility.
Overall, although the contract positions for BTC and ETH have continued to rise since May 13, indicating active market trading and increased leverage, and at one point forming a bullish advantage during key price breakthroughs, the LSR has not strengthened in tandem, reflecting that while capital is entering the market, sentiment remains cautious. Liquidation data also shows that even during the upward trend, long positions frequently encounter liquidation at local highs, especially on the day after BTC set a new high on May 23, when the market experienced intensified fluctuations, putting significant pressure on long positions. This phenomenon highlights that although there is capital driving the current market, it remains in a state of high volatility, high leverage, and hedging, with the structural bullish trend still needing further confirmation.
Quantitative Analysis - Bollinger Band Reversal Strategy
(Disclaimer: All predictions in this article are based on historical data and market trends, and are for reference only. They should not be considered as investment advice or guarantees of future market trends. Investors should fully consider risks and make cautious decisions when engaging in related investments.)
- Strategy Overview
The "Bollinger Band Reversal Strategy" is a reversal strategy that combines volatility assessment with trend structure monitoring. The strategy centers around the Bollinger Bands as the core indicator. When the price falls below the lower band, it is seen as a signal of short-term overselling and potential rebound, triggering a long position entry; when the price crosses above the upper band or reaches preset profit-taking and stop-loss thresholds, it is considered the end of the market phase, executing an exit operation.
To enhance the strategy's stability and judgment basis, the system also references multiple simple and exponential moving averages (SMA/EMA) to grasp the long-term trend direction and combines a fixed ratio of profit-taking and stop-loss mechanisms to effectively control risks and lock in profits. The overall strategy is suitable for capturing short-term reversal opportunities in a ranging or high-volatility environment, with a certain degree of tolerance and trading discipline.
- Core Parameter Settings
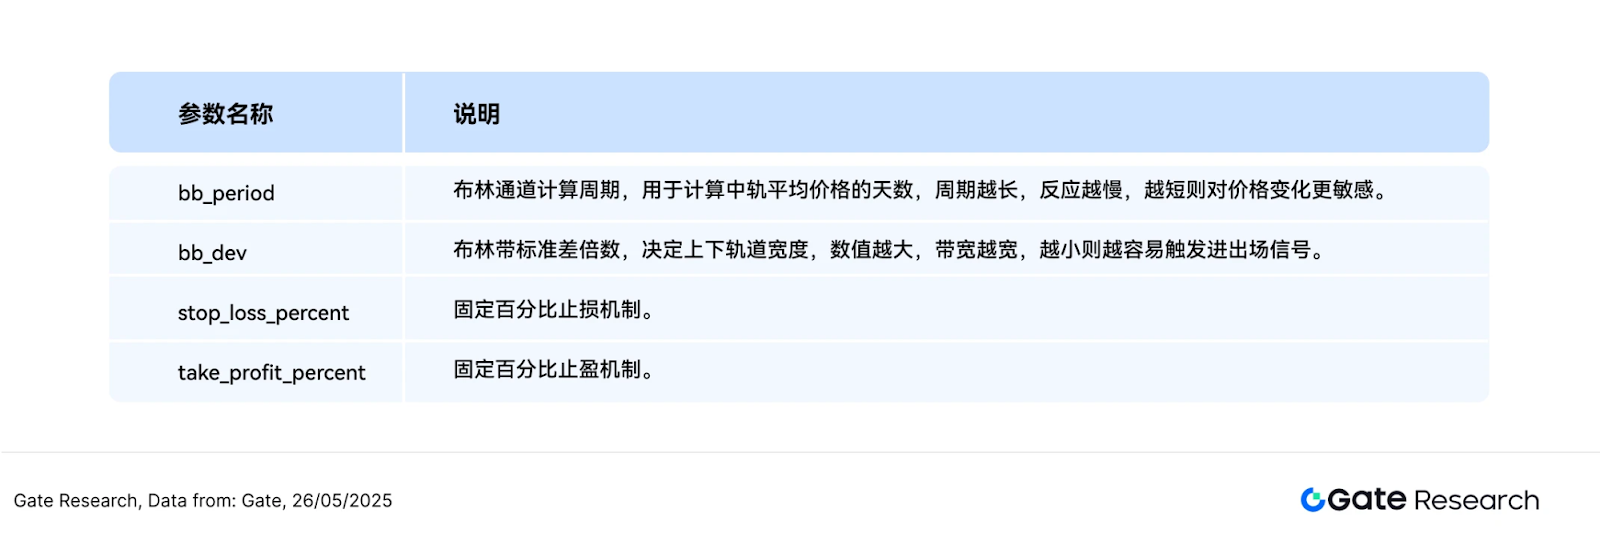
- Strategy Logic and Operation Mechanism
Entry Conditions
Exit Conditions:
Practical Example Chart
The following chart shows the ETH/USDT 1-hour candlestick chart at the most recent entry trigger on May 25, 2025. It can be seen that when the price fell below the lower Bollinger Band, it quickly rebounded, accompanied by increased trading volume and a MACD golden cross. The strategy entered a buy position at this point, successfully capturing the short-term rebound starting point, in line with the entry logic of the Bollinger Band strategy.
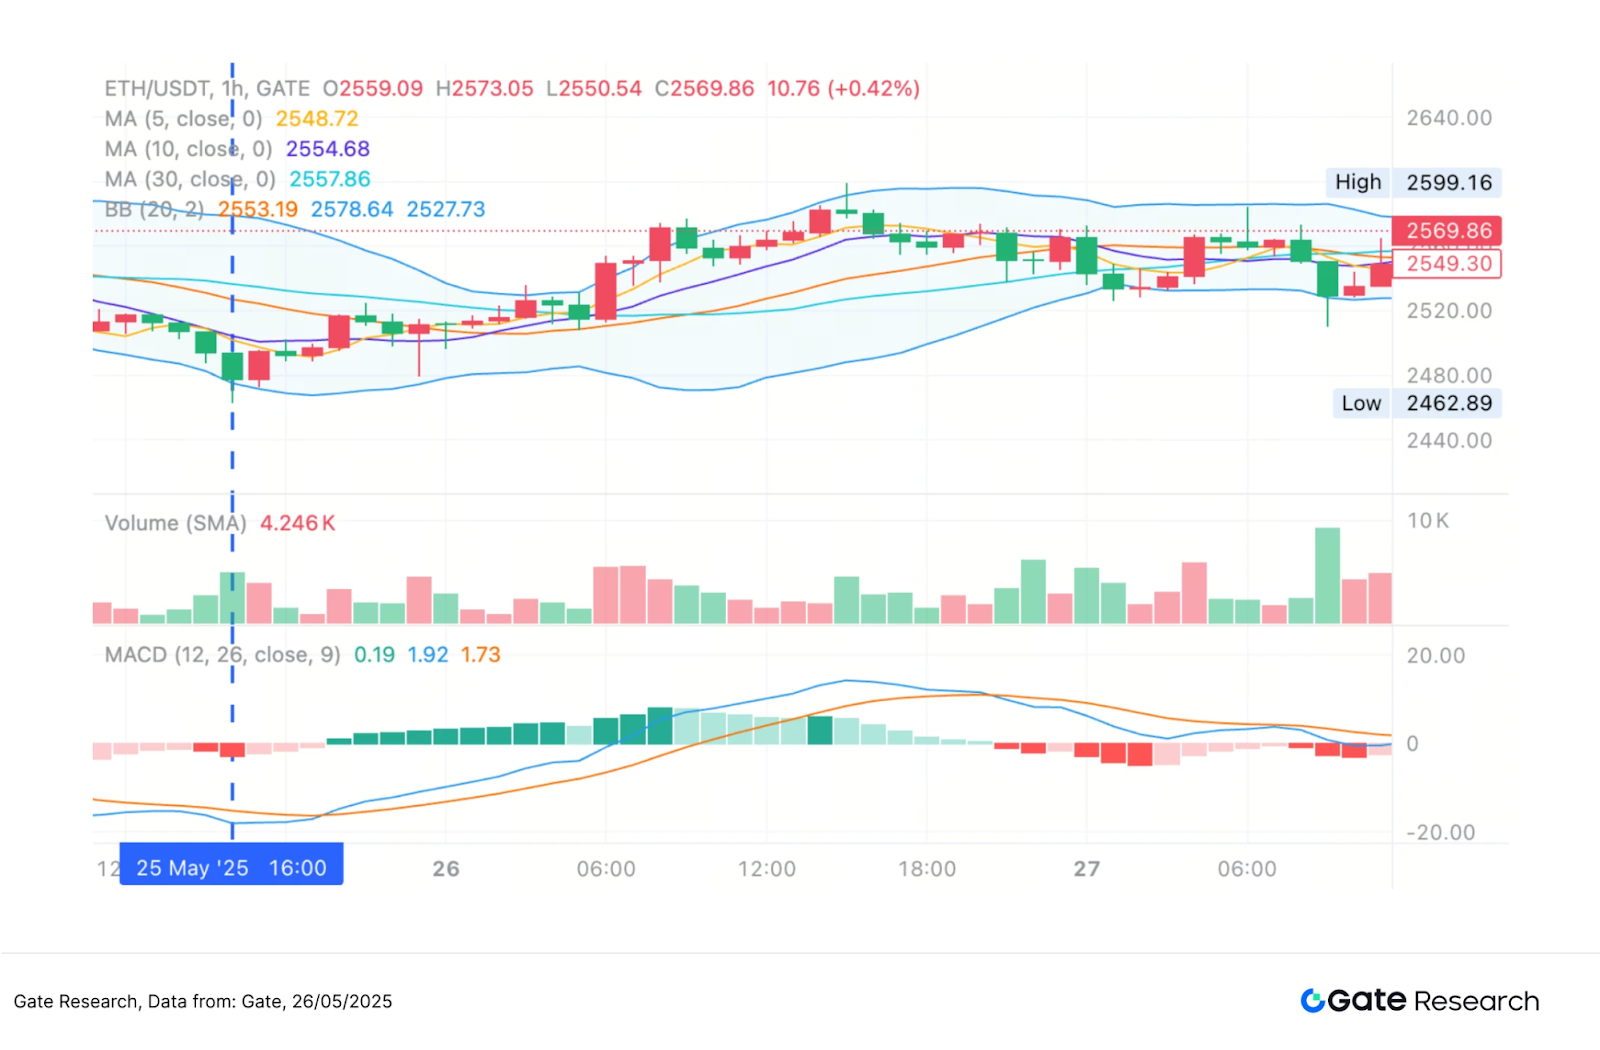
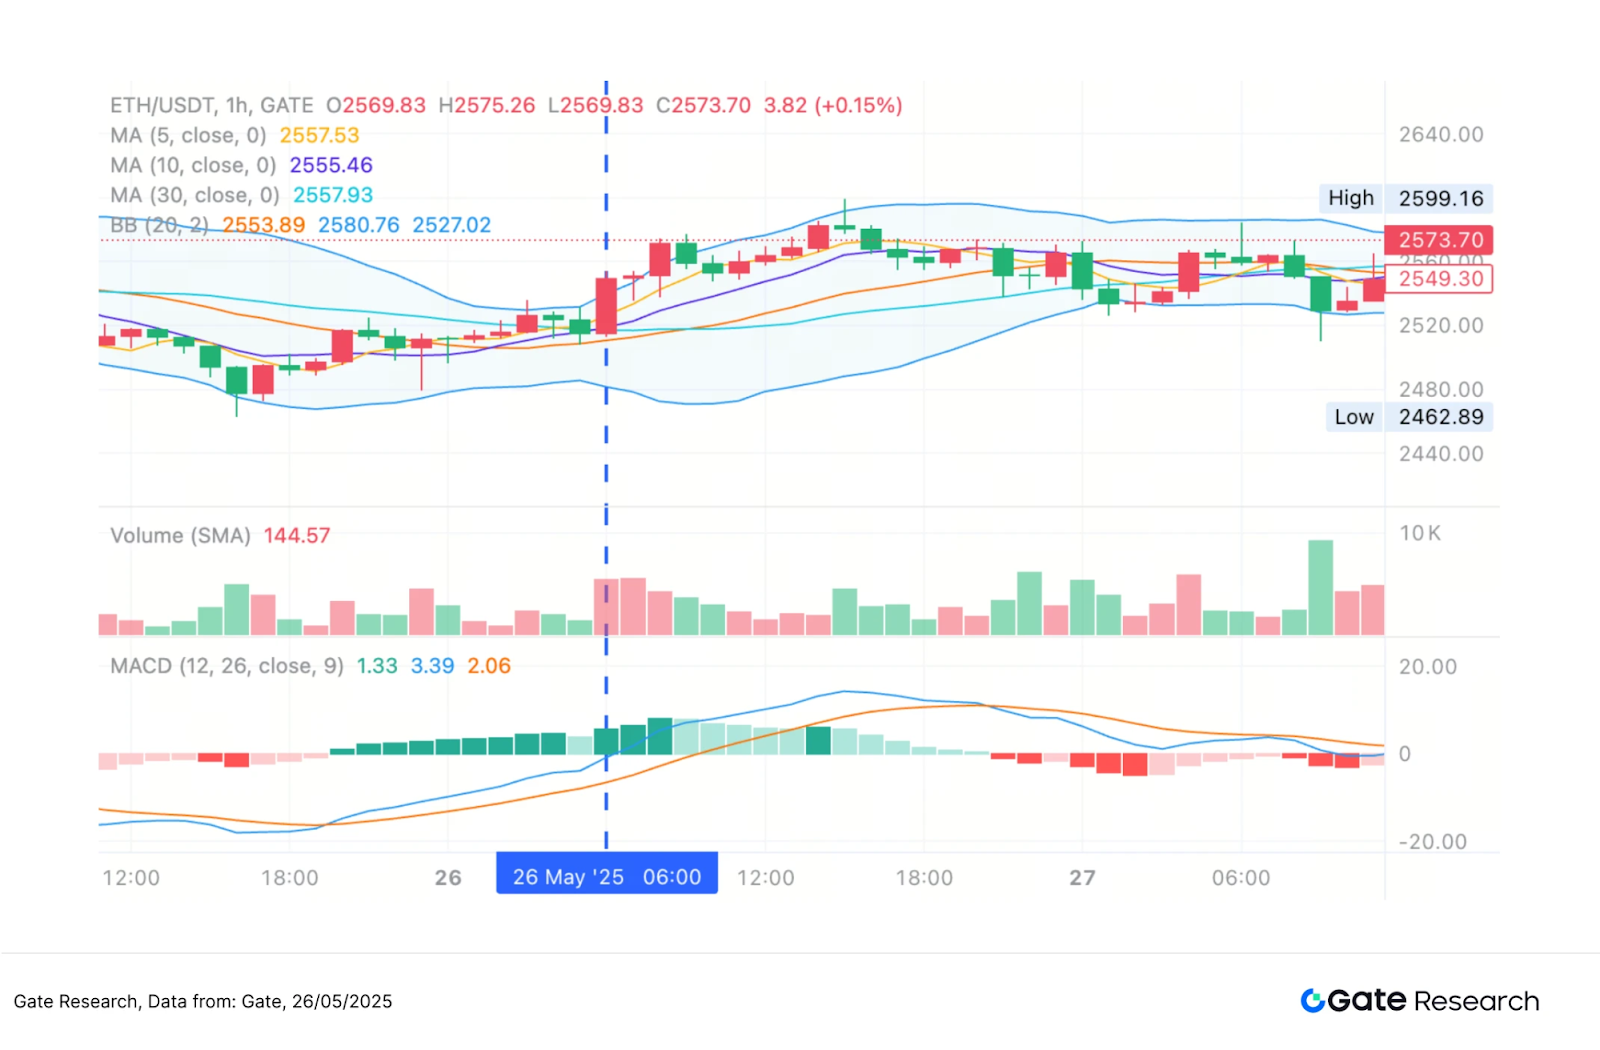
Through the above practical example, we visually present the strategy's entry and exit logic and dynamic profit-taking and stop-loss mechanisms when the price reaches the boundaries of the Bollinger Bands. The strategy utilizes the price breaking below the lower band for low-position layout and combines the breakout of the upper band as an exit signal, effectively capturing short-term rebound opportunities. While controlling drawdown risks, it successfully locks in the main profit range. This case not only verifies the practicality and disciplined execution of the Bollinger Band strategy but also demonstrates its stable performance and risk control ability in high-volatility markets, providing empirical support for subsequent parameter optimization and expanded applications.
- Practical Application Example
The parameter backtesting is set to find the best parameter combinations. We conducted a systematic grid search within the following range:
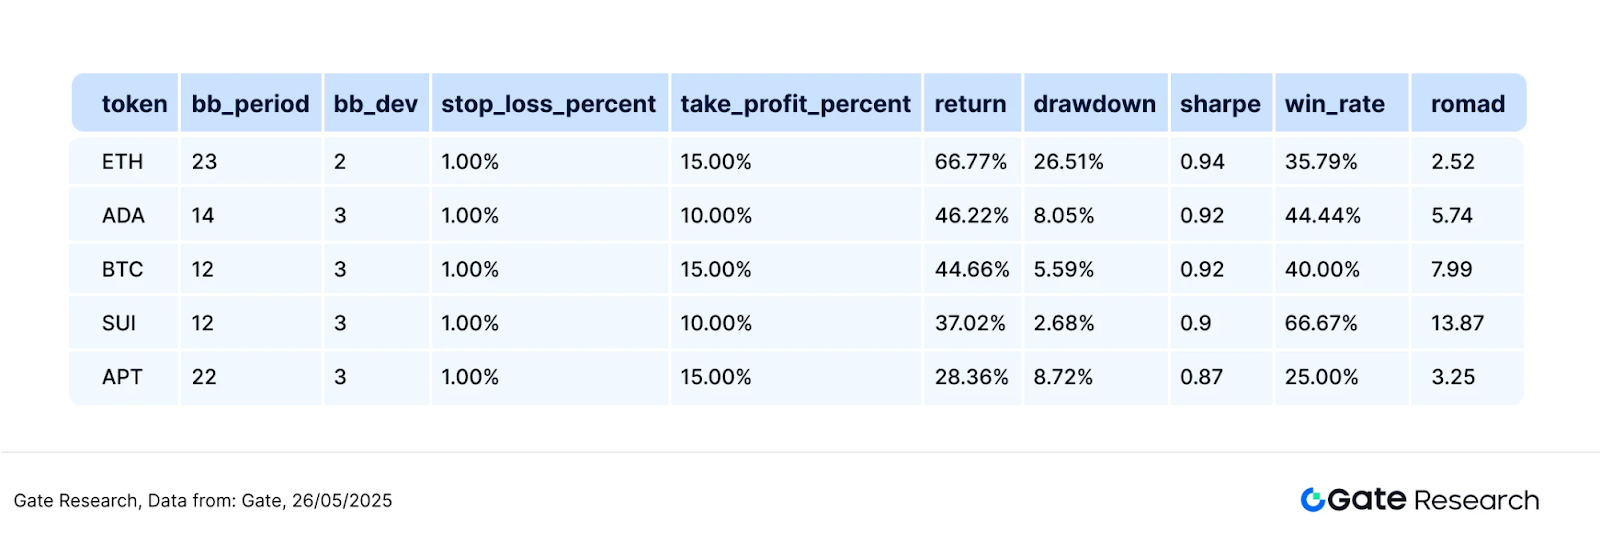
Taking the top ten cryptocurrency projects by market capitalization (excluding stablecoins) as an example, this article backtested the 1-hour candlestick data from January to May 2025, testing a total of 630 parameter combinations and selecting the five with the best annualized return performance. Evaluation criteria include annualized return, Sharpe ratio, maximum drawdown, and ROMAD (return to maximum drawdown ratio), to comprehensively assess the strategy's stability and risk-adjusted performance in different market environments.
The strategy logic indicates that when the program detects the price falling below the lower Bollinger Band, it is seen as a short-term overselling signal, immediately triggering a buy operation. This structure aims to capture rebound opportunities after the price deviates from the mean and uses the upper Bollinger Band as a dynamic profit-taking reference to enhance profit-locking effectiveness. If the price rebounds to the upper band or reaches preset stop-loss or profit-taking ratios, the system will automatically execute an exit action to balance risk and reward.
Taking ETH as an example, the settings used in this strategy are as follows:
This logic combines statistical reversal signals with a fixed ratio risk control mechanism, making it suitable for application in markets with clear ranging or pullback structures.
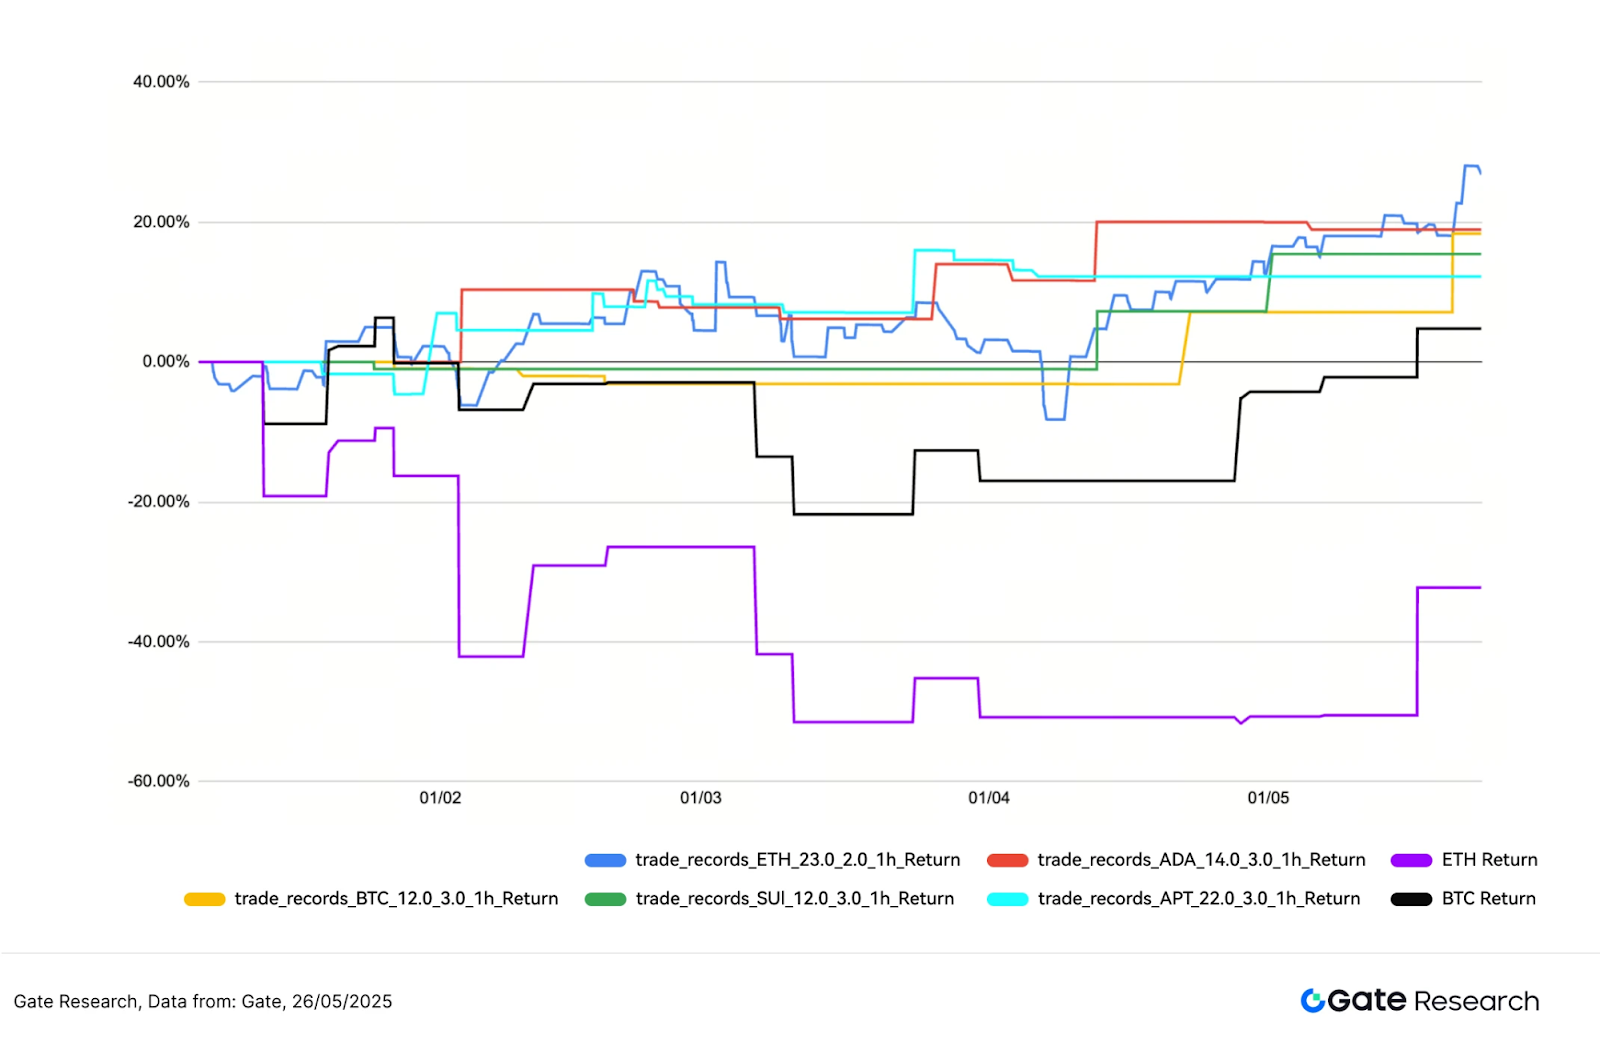
Performance and Result Analysis The backtesting period is from January 1 to May 26, 2025, during which the strategy performed robustly overall. The chart displays the cumulative return trends of the five best-performing parameter combinations at the 1-hour level, with most combinations significantly outperforming the Buy and Hold strategy for BTC and ETH. Among them, the ETH, ADA, and APT strategy combinations showed stable upward returns, with the highest cumulative return exceeding 30% and an annualized return exceeding 66%, while the spot performance of BTC and ETH remained in a ranging or negative territory, especially with ETH's drawdown approaching -50%.
Overall, these five strategies demonstrated good capital management and risk control capabilities during market fluctuations and trend reversal phases, effectively avoiding medium- to long-term drawdowns and capturing swing opportunities. The current strategy combinations achieve a good balance between returns and robustness, making them valuable for practical deployment. In the future, dynamic Bollinger parameters, volume filtering, or volatility screening logic can be further introduced to enhance the strategy's adaptability in different market conditions and expand it to multi-asset and multi-timeframe trading frameworks.
- Trading Strategy Summary
The "Bollinger Band Reversal Strategy" captures short-term rebound trends by entering at the lower band and exiting at the upper band, combined with fixed ratio profit-taking and stop-loss mechanisms, demonstrating good applicability in ranging or early reversal phases.
This backtest focused on the top ten cryptocurrency projects by market capitalization (excluding stablecoins), using 1-hour candlesticks and testing 630 parameter combinations. The results show that the ETH strategy combination (bbperiod=23, bbdev=2.0, takeprofitpercent=10%, stoplosspercent=1%) performed the best, achieving an annualized return of 66%, significantly outperforming the Buy and Hold strategy for ETH (-32%).
It is worth noting that this parameter set has a win rate of only 35%, with a failure rate as high as 65%. However, since the magnitude of profits during winning trades far exceeds losses, the overall return is better than other high-win-rate strategies, indicating that the relationship between return rate and win rate is not necessarily positive, and the key to the strategy lies in the reasonable design of the profit-loss ratio.
The parameter distribution shows that a mid-term Bollinger period, wider bands, and high profit-taking and low stop-loss ratios can effectively amplify swing profits and reduce the risk of premature exits. The overall strategy's entry and exit logic is clear, and risk control is stable, making it suitable for expansion into multi-asset and multi-timeframe trading frameworks. In the future, combining volume, dynamic profit-taking, and trend recognition mechanisms can further enhance the strategy's stability and practical performance.
Conclusion
From May 13 to May 26, 2025, BTC performed strongly, breaking through 110,000 USDT and setting a historic high, reflecting the market's recognition of its safe-haven and value storage properties. In contrast, ETH entered a consolidation phase after a brief rise, with volatility significantly higher than BTC, indicating its greater sensitivity to short-term sentiment and news. Although the contract positions for BTC and ETH have continued to rise, indicating increased trading activity, the long/short ratio (LSR) has not strengthened in tandem, and the market remains cautious and hedging at high levels. Additionally, the amount of long position liquidations significantly exceeded that of short positions, indicating that while there is capital driving the current market, the risks of chasing prices higher for bulls are increasing, and the overall market remains in a phase of high leverage, high volatility, and structural divergence.
The quantitative analysis demonstrates the practicality and stability of the "Bollinger Band Reversal Strategy" in ranging and reversal markets, suitable for high-volatility assets like ETH. The strategy uses the lower Bollinger Band as an overselling entry signal, combined with the upper band and fixed ratio profit-taking and stop-loss mechanisms, effectively balancing reward and risk. In the backtest from January to May 2025, the best parameter combination achieved an annualized return of 66% for ETH, significantly outperforming the Buy and Hold strategy. The parameter performance indicates that mid-term Bollinger periods, wider boundaries, and high profit-taking ratios help enhance strategy effectiveness. Overall, the strategy's entry and exit logic is clear and highly disciplined, making it suitable for execution in high-volatility markets, with potential for further optimization and multi-asset expansion. However, in practical operations, it may still be affected by market fluctuations, extreme conditions, or signal failures, so it is recommended to combine other quantitative factors and risk control mechanisms to enhance the strategy's stability and adaptability, and to make rational judgments and cautious responses.
Related: MetaMask Wallet Plugin Officially Integrates Solana Network | Cantor Fitzgerald Launches $2 Billion Bitcoin Mortgage Program
Original: “Bitcoin (BTC) Hits New High, Bollinger Band Strategy Yields 66% Annualized Return”
免责声明:本文章仅代表作者个人观点,不代表本平台的立场和观点。本文章仅供信息分享,不构成对任何人的任何投资建议。用户与作者之间的任何争议,与本平台无关。如网页中刊载的文章或图片涉及侵权,请提供相关的权利证明和身份证明发送邮件到support@aicoin.com,本平台相关工作人员将会进行核查。


