Original Title: These Six Charts Explain Why Bitcoin's Recent Move to Over $100K May Be More Durable Than January's Run
Original Author: OMKAR GODBOLE
Original Translation: Ismay, BlockBeats
Editor’s Note: This article explains through six charts why Bitcoin's recent surge above $100,000 may be more sustainable than the rally from January. Key indicators such as the financial environment and stablecoin inflows suggest that the foundation for this rise is more solid than the "double top" pattern observed from December last year to January this year.
Key Information:
Bitcoin is currently trading above $100,000, and the market environment indicates that the foundation for this rise is more solid than the "double top" pattern from December last year to January this year;
The current financial environment, stablecoin inflows, and the performance of spot ETFs are all more favorable for Bitcoin's movement than before;
Other key indicators do not show signs of the overheating and speculative sentiment seen from late last year to early this year.
Bitcoin's current price is $106,546.31, having regained the $100,000 mark. Due to the tendency of investors to be influenced by "recency bias," many may believe that this movement will repeat the scenario from December to January—when upward momentum quickly weakened, and the price soon fell back into the six-figure range, eventually dropping to $75,000.
However, the following six charts indicate that the current Bitcoin market appears more robust than during the December to January period, suggesting a higher likelihood of further increases.
"Financial conditions" refer to a range of economic variables including interest rates, inflation, credit availability, and market liquidity, which are typically influenced by macro indicators such as benchmark government bond yields (like the U.S. 10-year Treasury yield) and the U.S. dollar exchange rate.
A tightening financial environment suppresses risk appetite in financial markets and the real economy, while a loose environment encourages more risk-taking behavior. As of now, the current financial environment, as seen from the 10-year U.S. Treasury yield and the dollar index, is clearly more accommodative than in January, favoring Bitcoin's sustained rise.
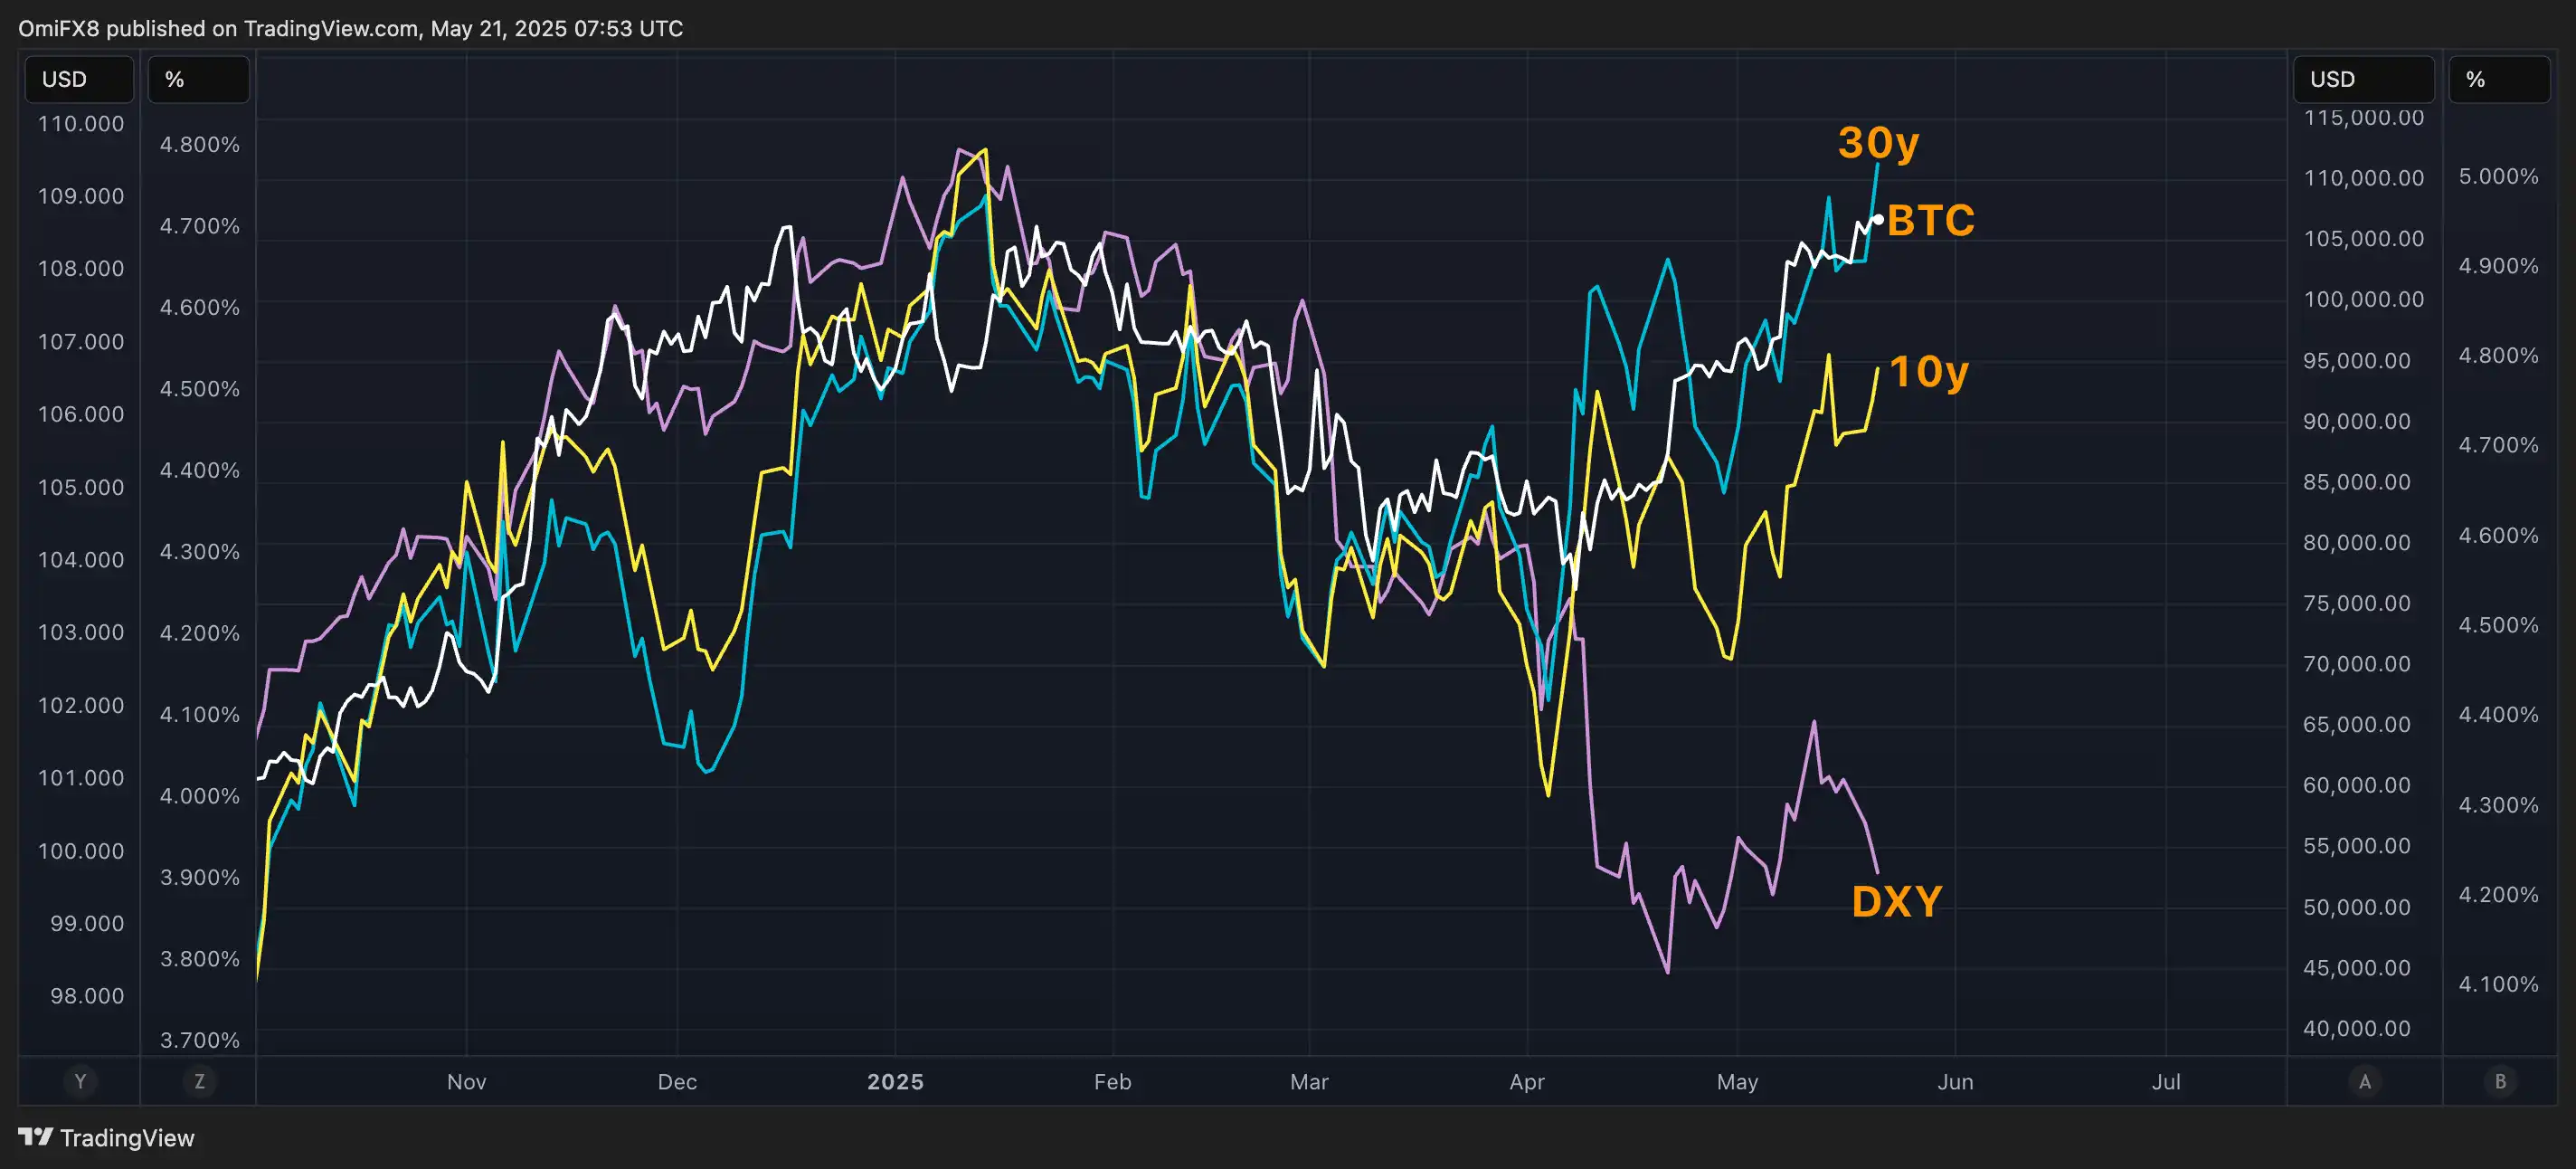
At the time of reporting, the dollar index, which measures the dollar against a basket of major currencies, was at 99.60, down 9% from the January peak of 109.00. The U.S. 10-year Treasury yield was at 4.52%, a decrease of 30 basis points from the January high of 4.8%.
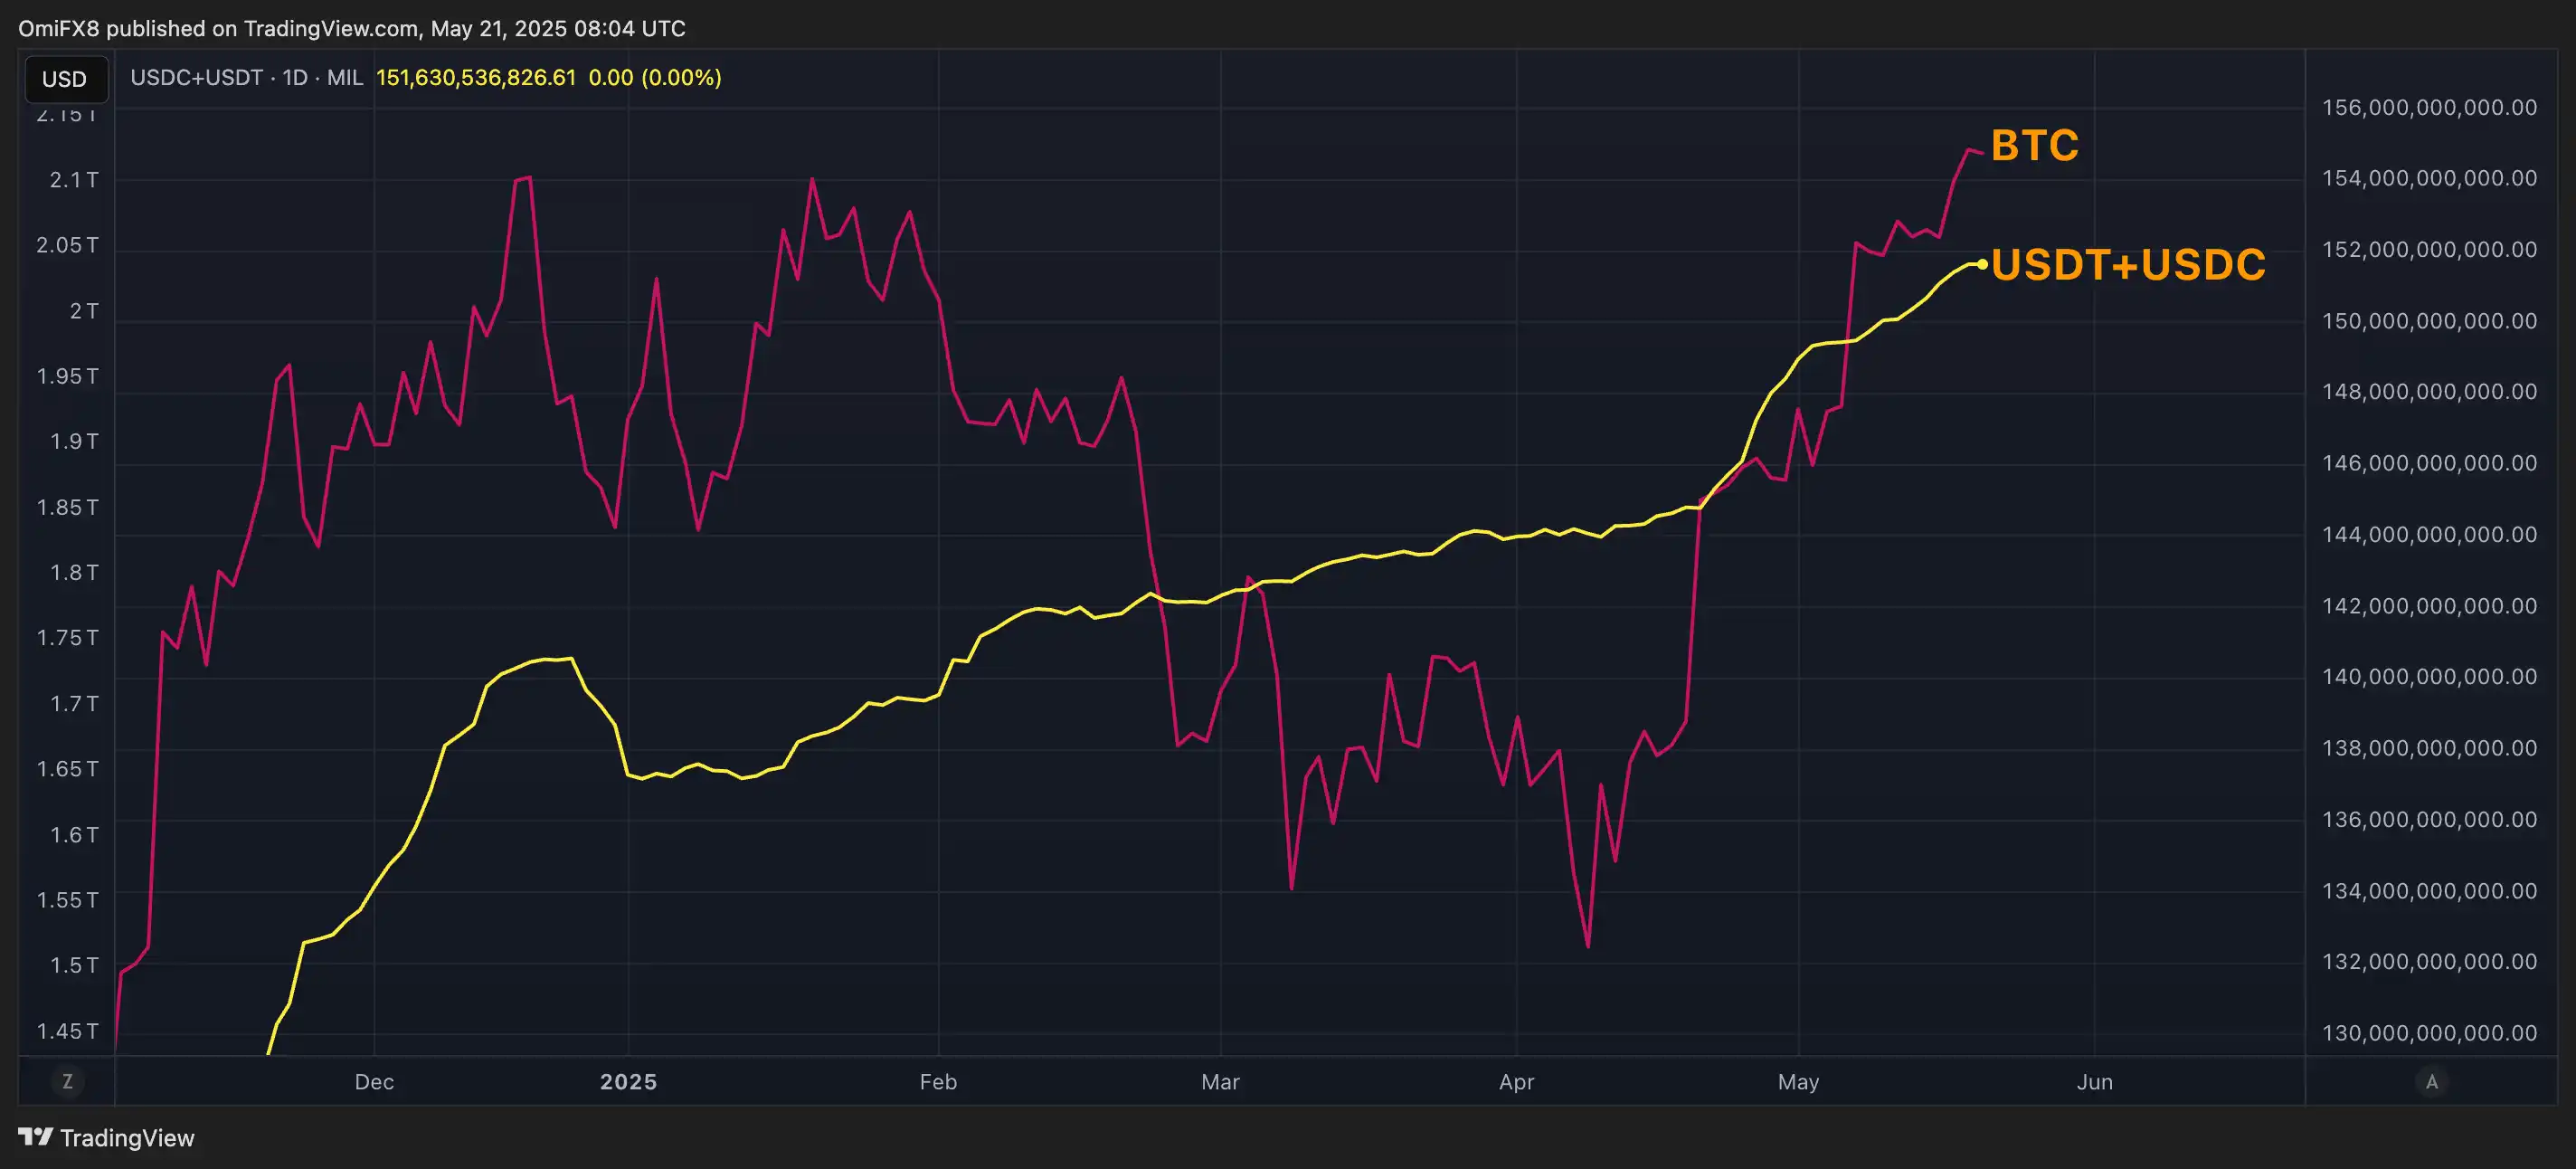
There’s "dry powder" in the market
The total market capitalization of the two major stablecoins—USDT and USDC—has reached a record $151 billion. According to TradingView data, this figure is nearly 9% higher than the average market cap of $139 billion from December last year to January this year.
In other words, there is now more "dry powder" in the market—potential funds available for investing in Bitcoin and other crypto assets.
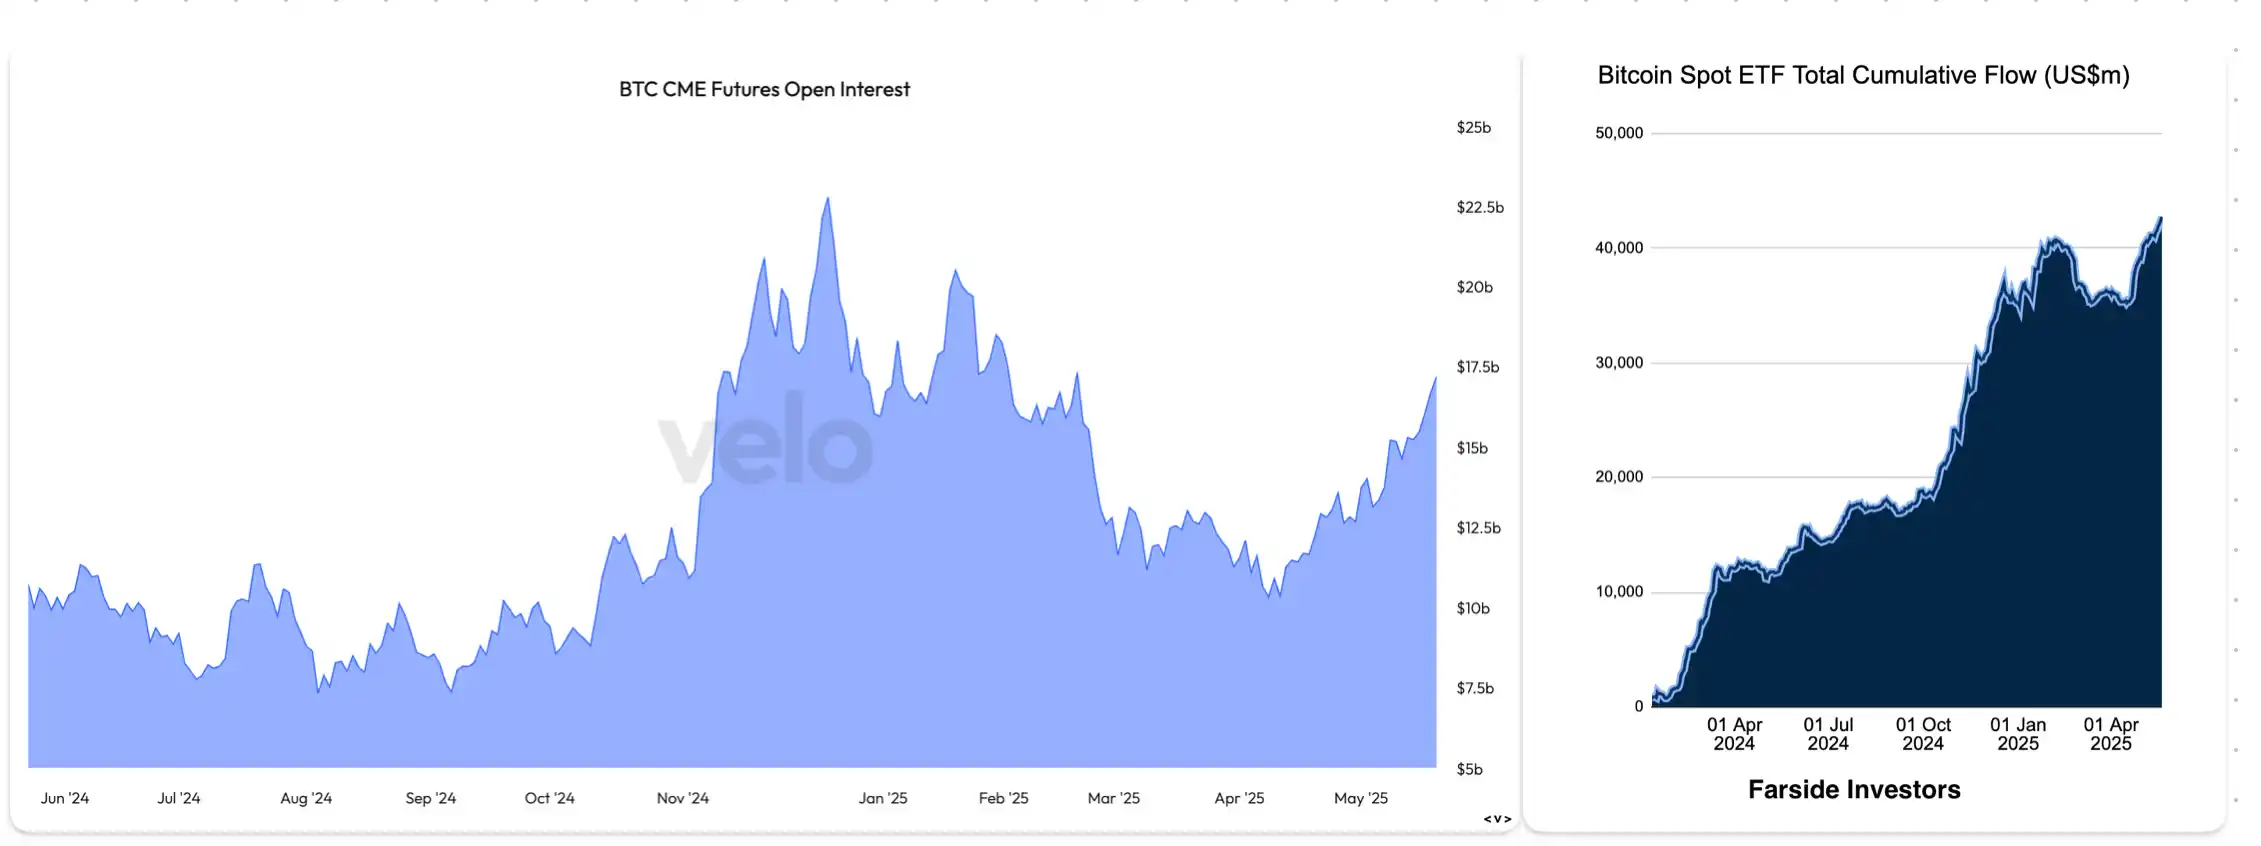
Strong directional bets
Since Bitcoin rebounded from a low near $75,000 in early April, this round of increases has been primarily driven by institutions, which are betting on long positions rather than engaging in arbitrage strategies.
This can be seen in two ways: first, the U.S.-listed spot Bitcoin ETFs continue to attract significant inflows, and second, the open interest in Bitcoin futures on the CME remains relatively moderate.
According to data from Velo, the nominal open interest in CME Bitcoin futures has climbed to $17 billion, reaching a new high since February 20. However, this figure is still significantly lower than the peak of $22.79 billion in December last year.
In contrast, according to Farside Investors, the cumulative inflow into the current 11 spot Bitcoin ETFs has reached a record $42.7 billion, far exceeding the $39.8 billion seen in January.
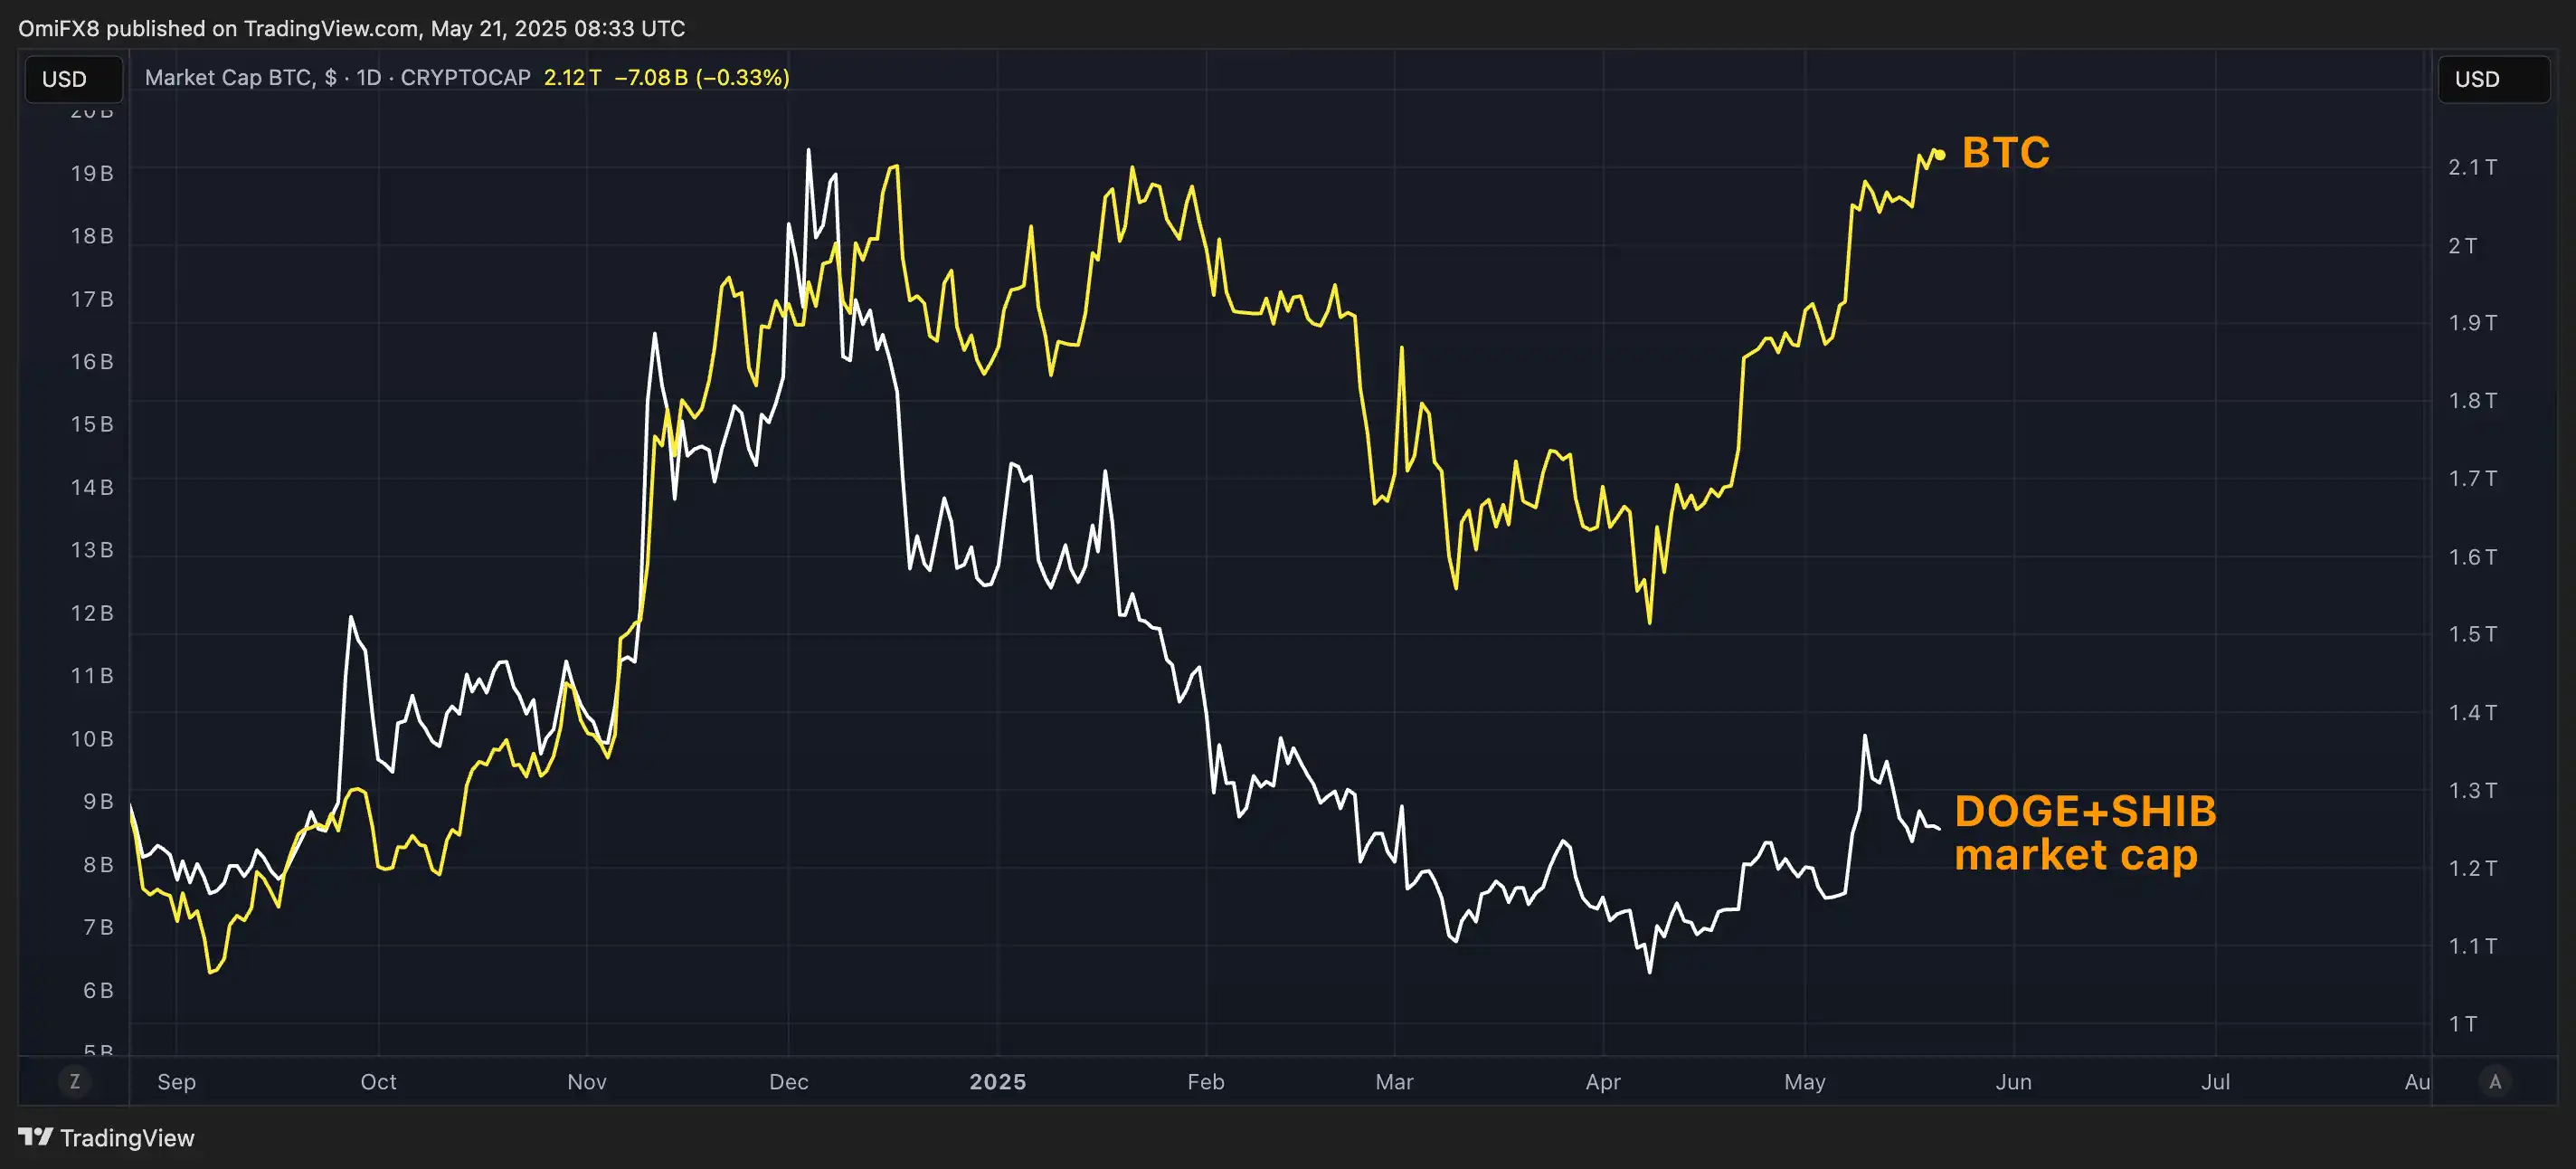
Lack of speculative frenzy signs
Historically, Bitcoin's phase or cyclical tops (including from December to January) are usually accompanied by high speculative sentiment in the market, which often drives up the market capitalization of "non-serious" tokens like DOGE and SHIB.
However, there are currently no signs of such sentiment, as the total market capitalization of DOGE and SHIB remains well below the January highs.
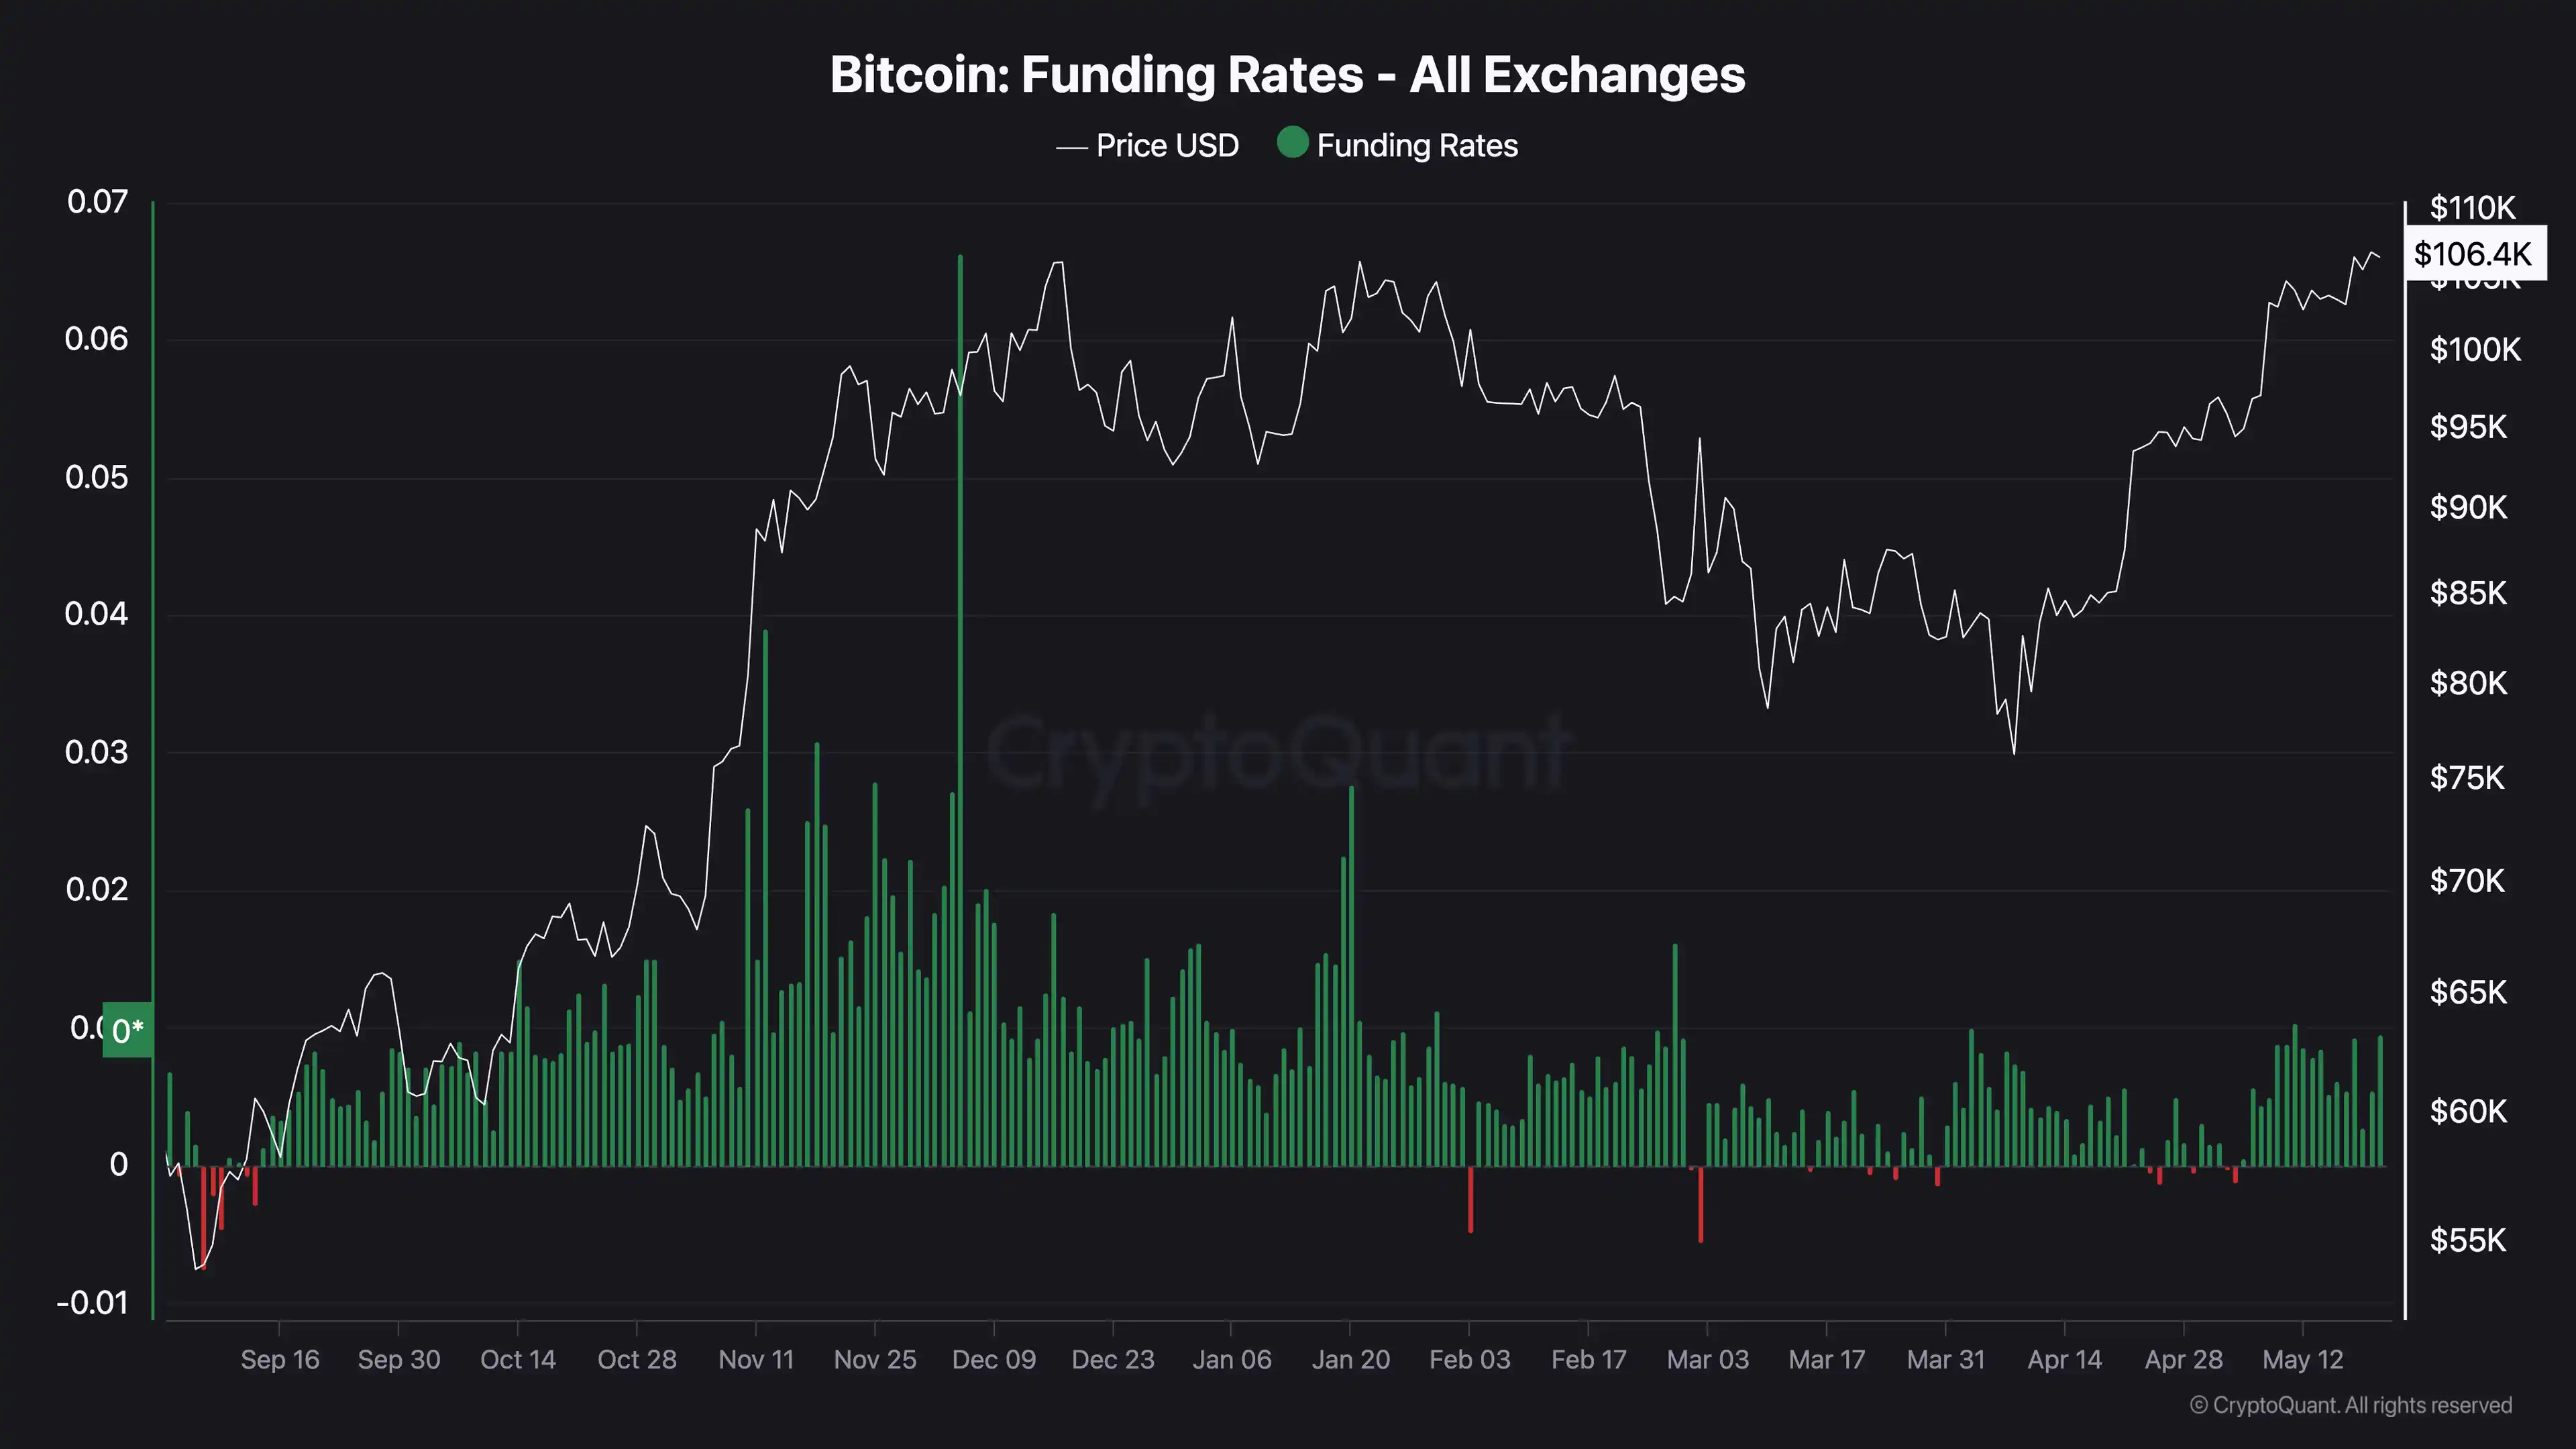
No signs of overheating
Although Bitcoin is currently close to its historical highs, there has indeed been some demand for long leverage in the perpetual contract market, which is to be expected. However, overall positions remain light, showing no signs of excessive leverage accumulation or overheating among long positions, with funding rates also far below the peaks seen in December last year.
The chart shows the funding rate, which is the cost of holding perpetual contracts. A positive value indicates that longs are willing to pay a premium to hold their positions, meaning that longs are paying shorts to maintain their positions. This is typically seen as an indicator of bullish sentiment in the market.
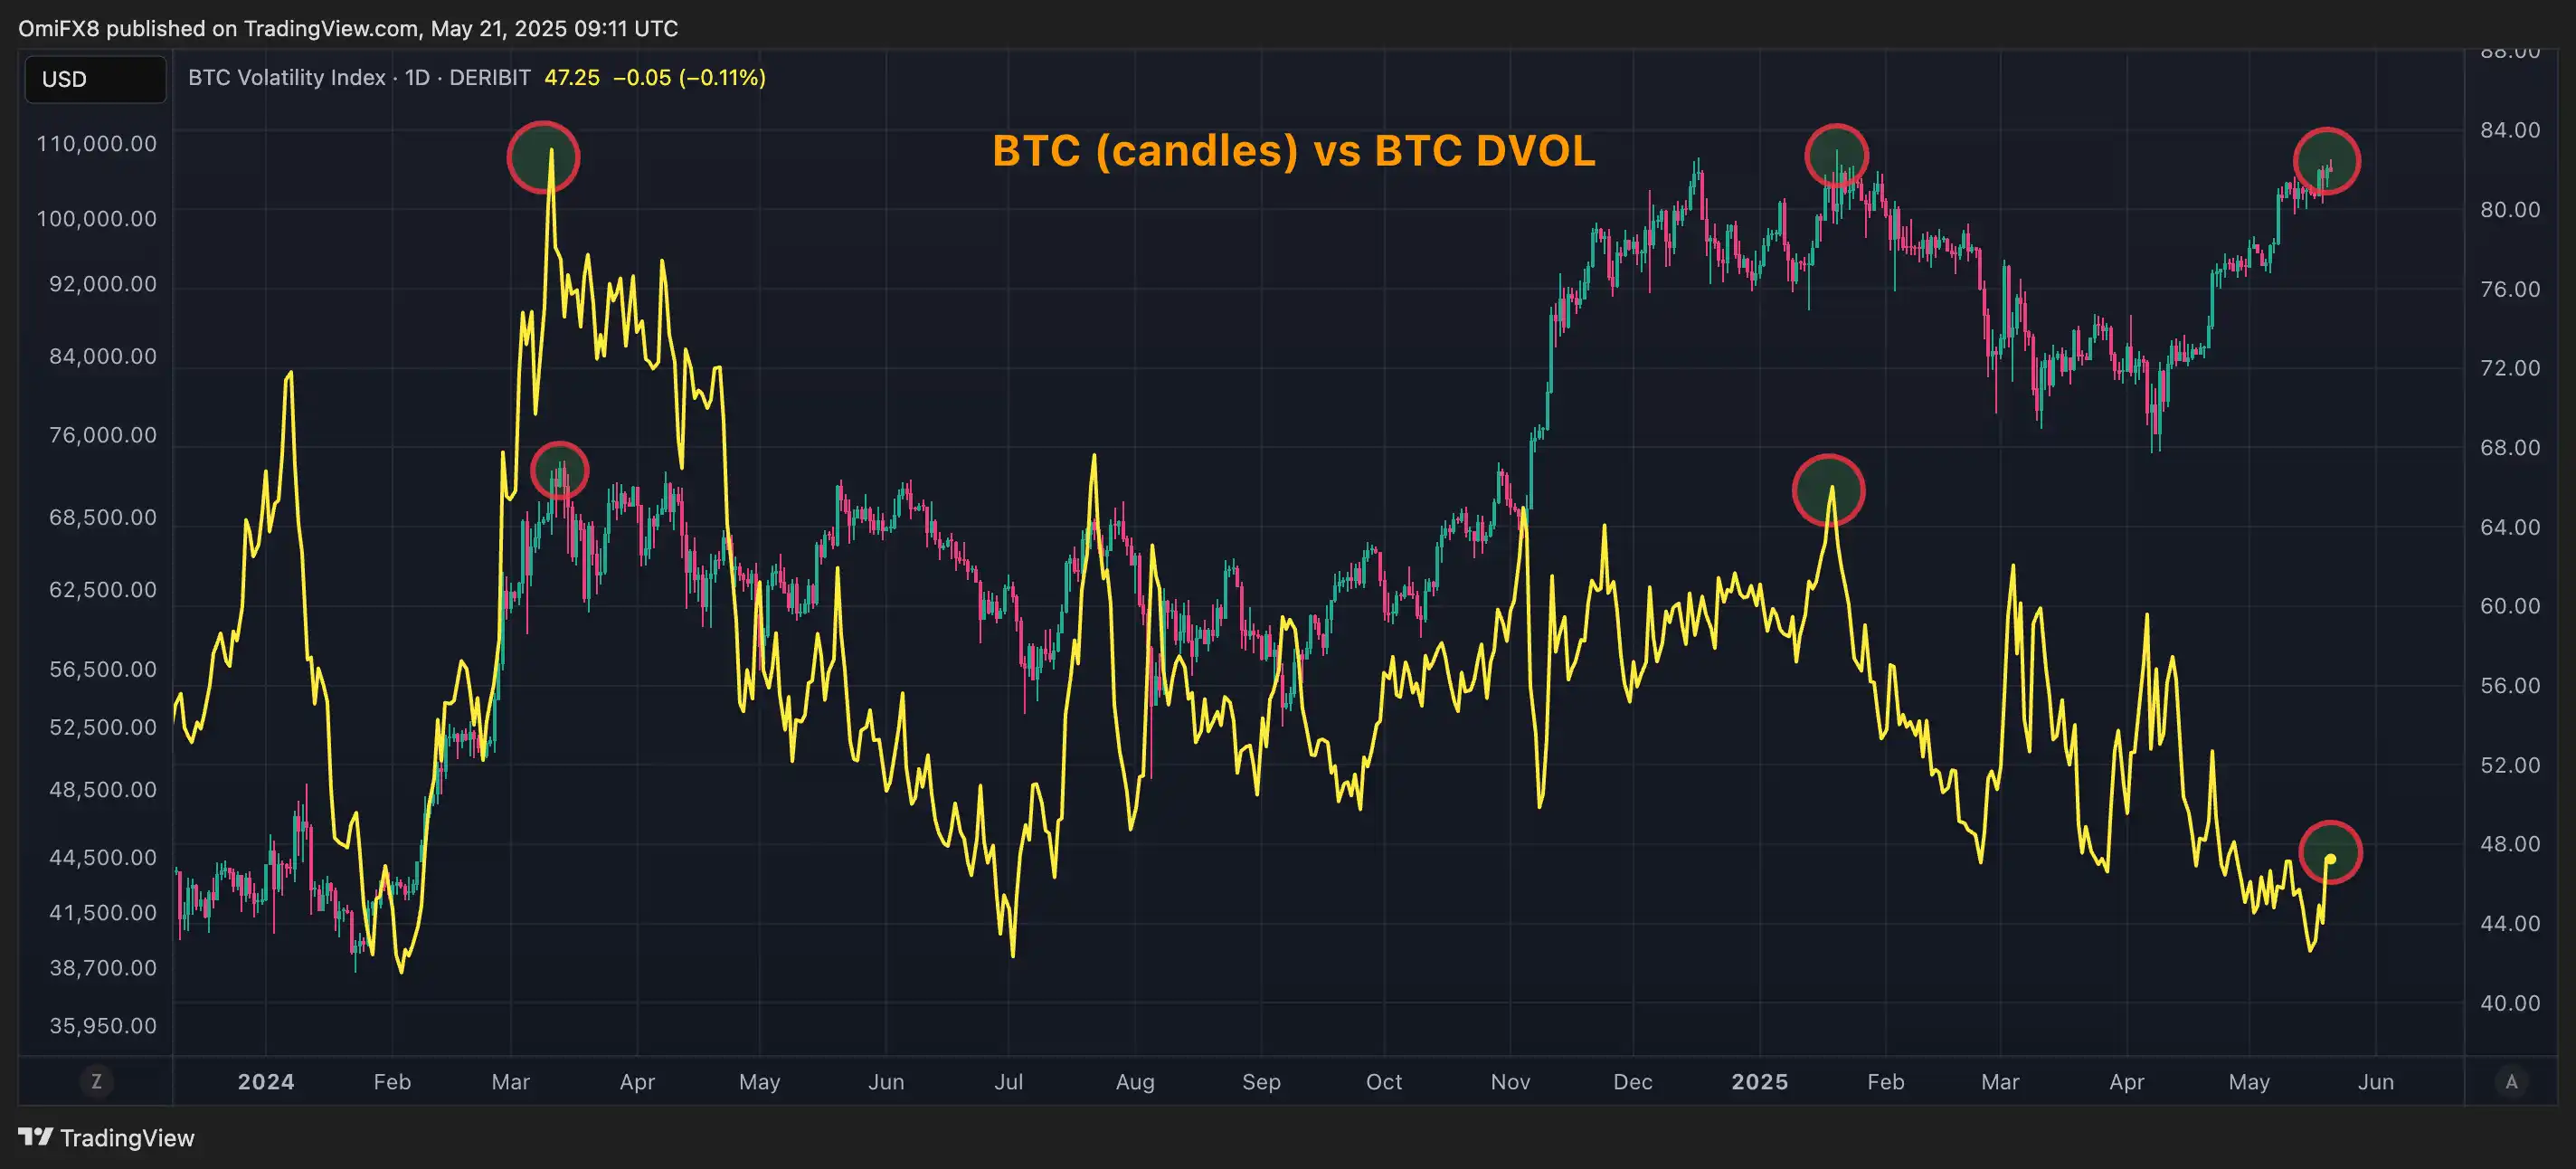
Implied volatility shows a stable market
From the perspective of implied volatility, the current Bitcoin market appears calmer. Deribit's DVOL index (reflecting expected volatility over the next 30 days) is significantly lower than the levels seen from December to January, as well as during the price peak in March 2024.
Lower implied volatility means that traders do not expect significant fluctuations or major uncertainties, which are typically signs of an overheated market. This also indicates that the current upward trend is more rational and may be more sustainable.
免责声明:本文章仅代表作者个人观点,不代表本平台的立场和观点。本文章仅供信息分享,不构成对任何人的任何投资建议。用户与作者之间的任何争议,与本平台无关。如网页中刊载的文章或图片涉及侵权,请提供相关的权利证明和身份证明发送邮件到support@aicoin.com,本平台相关工作人员将会进行核查。


