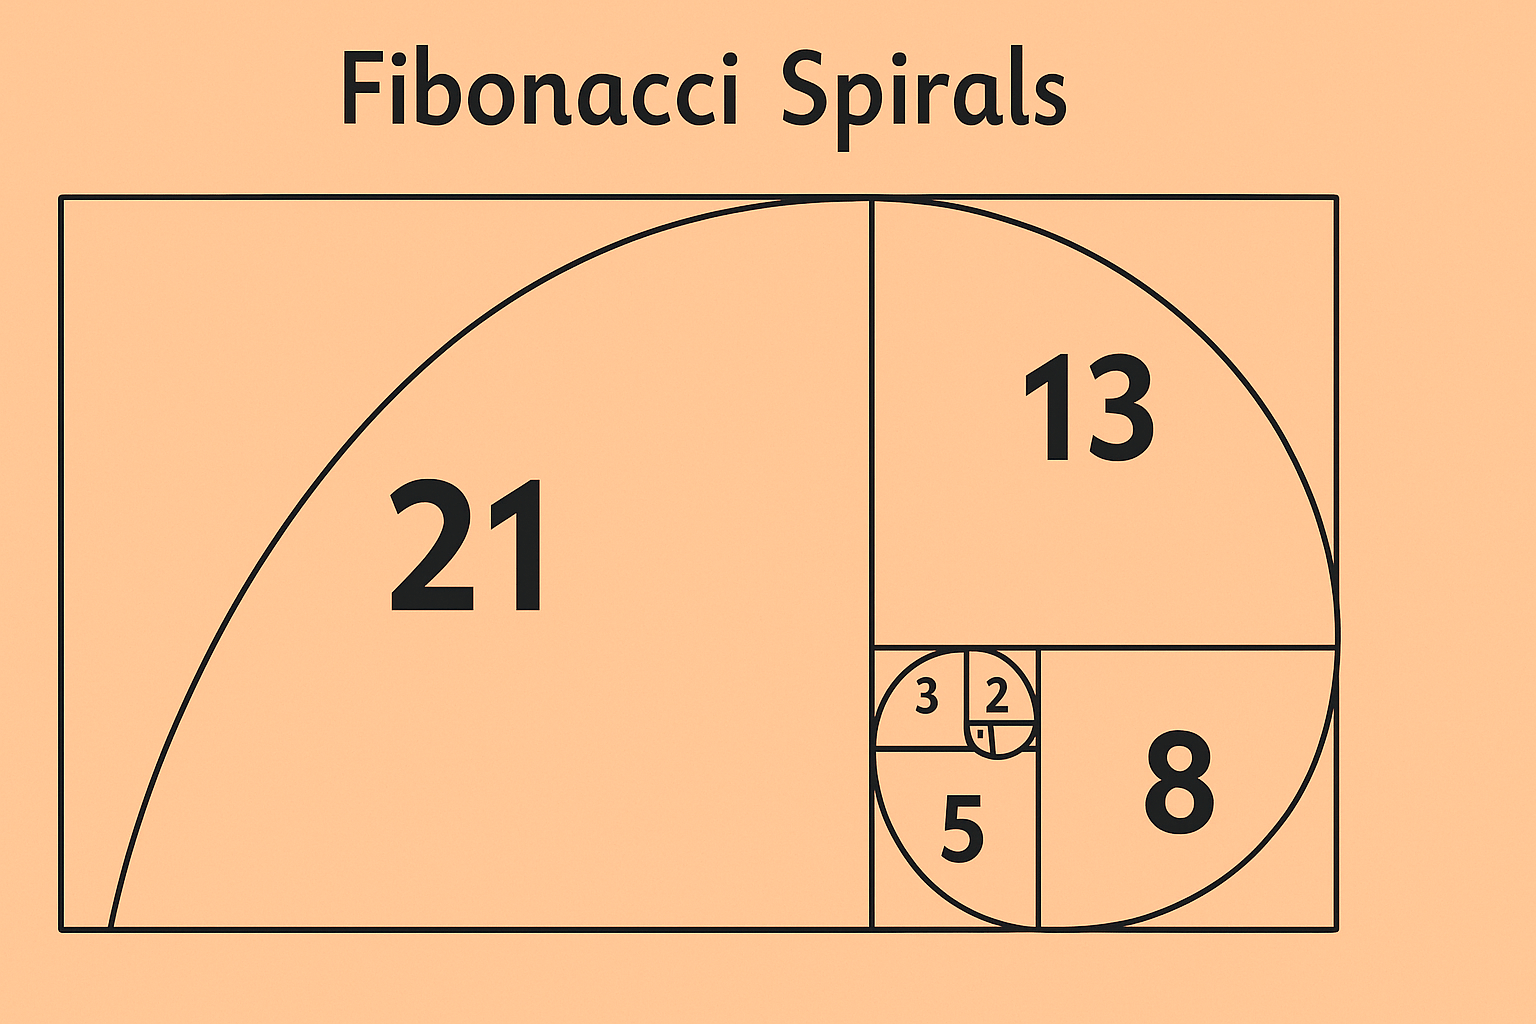
Fibonacci retracement is a technical analysis tool used to determine potential support and resistance levels by analyzing the vertical distance between two extreme points, typically a high and a low. It is based on the Fibonacci sequence, a mathematical pattern discovered by Italian mathematician Leonardo Fibonacci in the 13th century. The sequence, where each number is the sum of the two preceding ones, gives rise to ratios that are widely observed in nature and, intriguingly, financial markets.
In bitcoin trading, Fibonacci retracement levels are drawn between a high and low point on a chart to predict possible reversal zones. The most commonly used Fibonacci levels are 23.6%, 38.2%, 50%, 61.8%, and 78.6%. These percentages represent how much of a prior move the price might retrace before continuing in its original direction.
Applying Fibonacci Retracement to Bitcoin Charts
To use Fibonacci retracement in bitcoin trading, a trader begins by identifying a significant peak and trough on a chart. Drawing the Fibonacci levels from high to low (or vice versa in an uptrend) overlays horizontal lines across the chart. These lines are where the price may find temporary support or resistance, offering possible entry or exit opportunities.
For instance, if bitcoin rises from $80,000 to $100,000 and then begins to pull back, traders may look at the 61.8% retracement level to act as a support zone around $87,640. If the price bounces off that level, it can confirm a continuation of the bullish trend. Conversely, if it breaks through that level, deeper retracements such as the 78.6% or full retracement may be explored.
The Golden Ratio: 61.8%
Among the Fibonacci levels, the 61.8% level—also known as the “golden ratio“—holds particular significance. This ratio appears in natural phenomena, architecture, and even human anatomy. In financial markets, its importance is often attributed to the self-fulfilling behavior of traders who expect price action to react near this level.
In bitcoin markets, price often respects the 61.8% level due to the large number of market participants watching it. When this level aligns with other indicators such as trendlines or moving averages, it gains even more weight as a confluence zone. Traders frequently place stop-losses or set profit targets near this level to manage risk and enhance their strategy’s precision.
Combining Fibonacci With Other Technical Indicators
Fibonacci retracement is rarely used in isolation. Traders often combine it with other tools like volume, candlestick patterns, relative strength index (RSI), or moving average convergence divergence (MACD) to strengthen the probability of a successful trade. For example, if bitcoin retraces to the 38.2% level and shows a bullish engulfing candlestick while RSI enters oversold territory, the trader may view this as a high-probability buying opportunity.
Similarly, if the 50% retracement level aligns with the 200-period moving average, this convergence might reinforce the area as strong support. The more indicators that validate a Fibonacci level, the greater the trader’s confidence in its significance.
Retracement vs. Reversal: Reading the Signals
It’s important to distinguish between a retracement and a reversal. A retracement is a temporary pullback within a larger trend, while a reversal indicates a change in the overall direction. Misreading the two can lead to premature exits or mistimed entries.
Fibonacci levels help traders assess whether a pullback is merely corrective or the beginning of a broader trend change. If bitcoin pulls back to the 38.2% or 50% level and resumes its prior direction with increasing volume, it’s likely a retracement. However, failure to hold key levels accompanied by weakening momentum may signal a trend reversal.
Fibonacci Extension: Projecting Future Moves
Beyond retracement, Fibonacci extensions are used to project potential price targets in trending markets. Extensions are plotted using the same high and low points but extend beyond the original move to forecast resistance or support in the direction of the trend.
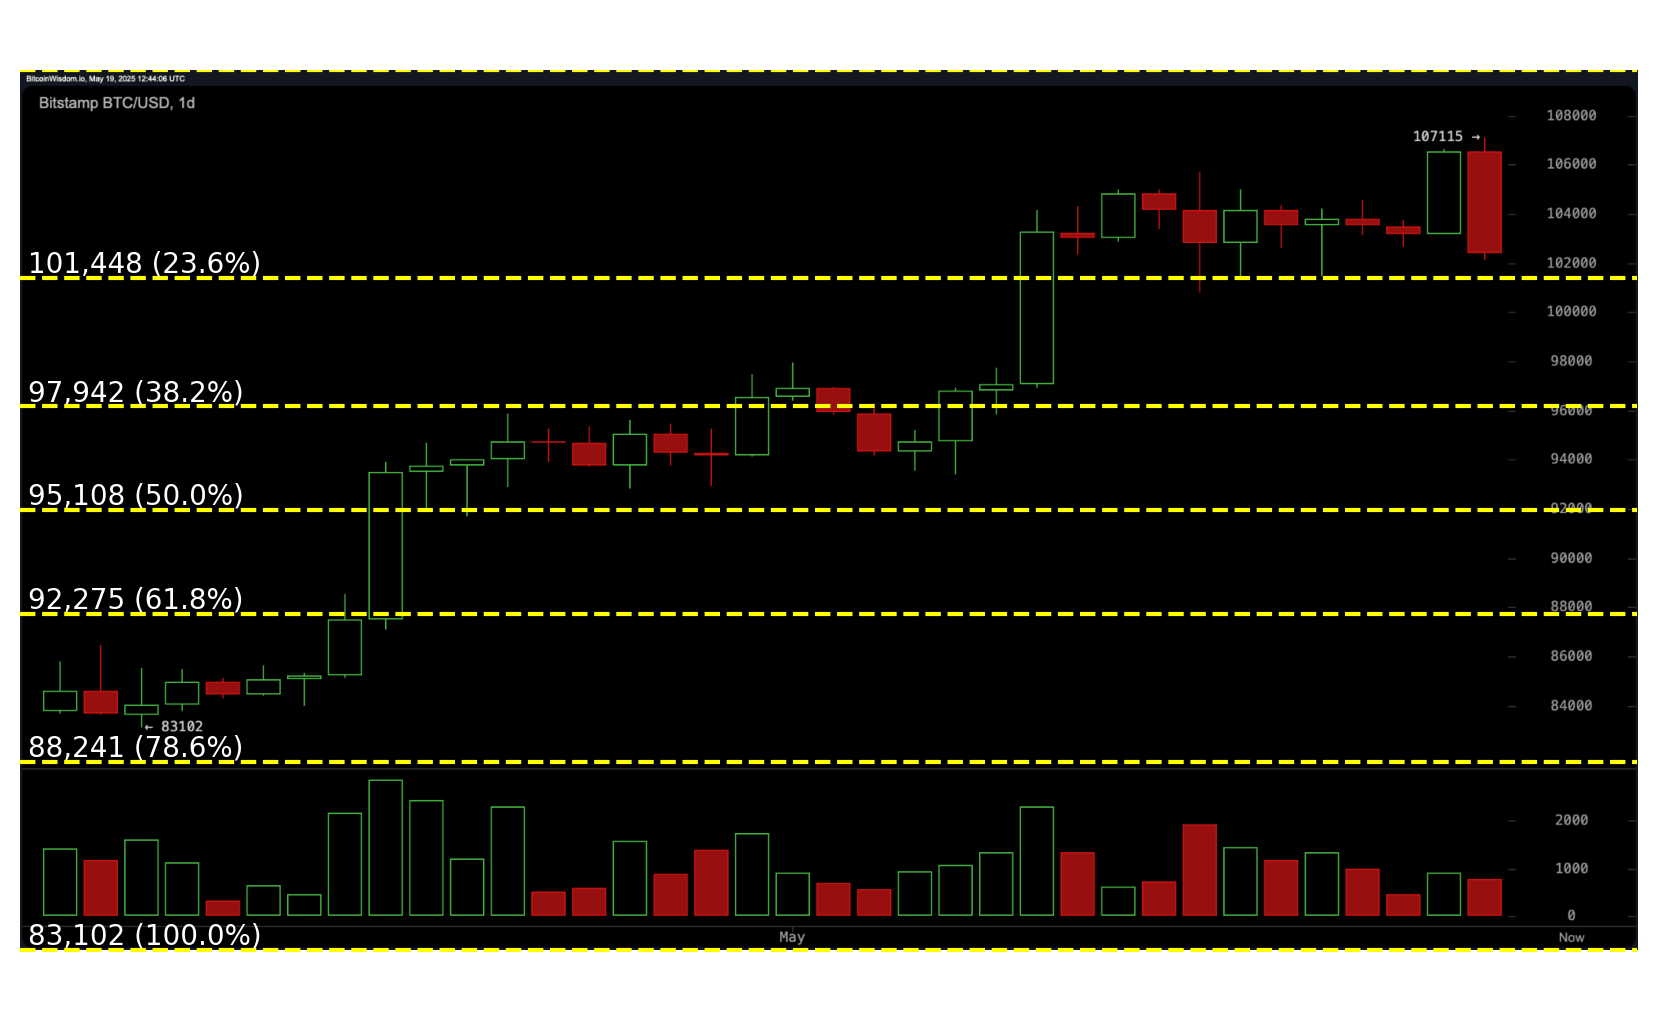
An overlay of Fibonacci Retracement on the BTC/USD daily chart on Monday, May 19, 2025.
For example, if bitcoin rises from $90,000 to $100,000, retraces to $95,000, and resumes its uptrend, the 161.8% extension may be projected around $106,180 as a potential target. These extensions help traders define exit points and manage trades as trends evolve.
Limitations and Subjectivity
Like all technical tools, Fibonacci retracement is not infallible. Its effectiveness relies on the trader’s ability to correctly identify the key swing high and low points. Because charting is subjective, two traders may select different points, leading to slightly varied retracement levels.
Additionally, Fibonacci retracement works best in trending markets. In sideways or choppy markets, retracement levels may be less predictive and more prone to noise. Therefore, context and confirmation from other tools remain essential for informed decision-making.
Practical Use in Bitcoin’s Volatile Market
Bitcoin’s price movements are often dramatic, making precise entry and exit points essential for capital preservation and profit maximization. Fibonacci retracement allows traders to approach volatile conditions with a disciplined, structured framework.
Whether swing trading on a four-hour chart or analyzing broader trends on a daily or weekly chart, Fibonacci levels can provide structure to chaotic movements. This makes the tool especially appealing in crypto markets, where large retracements and sharp rallies are commonplace.
Mastering the Fibonacci Mindset
Ultimately, Fibonacci retracement isn’t about predicting the future with absolute certainty. It’s about mapping probabilities and aligning one’s strategy with key psychological levels observed across the market. Used thoughtfully, it becomes a guide that helps traders navigate uncertainty with logic rather than emotion.
In bitcoin trading, where volatility is high and emotions often run hotter, Fibonacci retracement offers a balanced, mathematically grounded perspective. Its continued popularity among traders across asset classes speaks to its enduring relevance in the world of technical analysis.
免责声明:本文章仅代表作者个人观点,不代表本平台的立场和观点。本文章仅供信息分享,不构成对任何人的任何投资建议。用户与作者之间的任何争议,与本平台无关。如网页中刊载的文章或图片涉及侵权,请提供相关的权利证明和身份证明发送邮件到support@aicoin.com,本平台相关工作人员将会进行核查。


