The years pass slowly, and the journey of life is long. With joys and sorrows, separations and reunions, one feels a deep sense of parting and longing that cannot be easily dispelled, yet it keeps coming back! The melody is lingering, inevitably evoking sadness and melancholy. Life is full of regrets; we are all ordinary people who cannot remain unperturbed, with hearts free from external distractions. We can only learn to take things lightly. A simple life is walked simply, and gentle emotions are cherished gently!
Unknowingly, the market has been operating above the $100,000 mark for several days now. Currently, the trend seems to still be struggling to break free from the oscillating situation. When we last updated the article, the market was also at the price level of $102,500, and overall, there hasn't been much difference, so let's take a direct look at the charts. First, from the daily chart, under the high-level oscillation, it is evident that the expectation for a structural pullback is quite strong. In the previous article, we analyzed the daily level in detail, and as of now, there has been no change in the daily chart. The K-line is at a high level, gradually starting to show some bearish candles, and the price has also returned below the MA7 daily line. On the technical indicators, the MACD's top divergence is about to form, with the two lines intersecting above the zero axis, and a death cross is about to form. The KDJ three lines are maintaining a high-level operation, and the RSI has slightly retreated from the overbought area. Overall, the expectation for a pullback on the daily chart is quite evident. In the absence of any stimulating news in the market, under normal market operations, this wave on the daily chart will definitely follow the pullback expectation for correction.
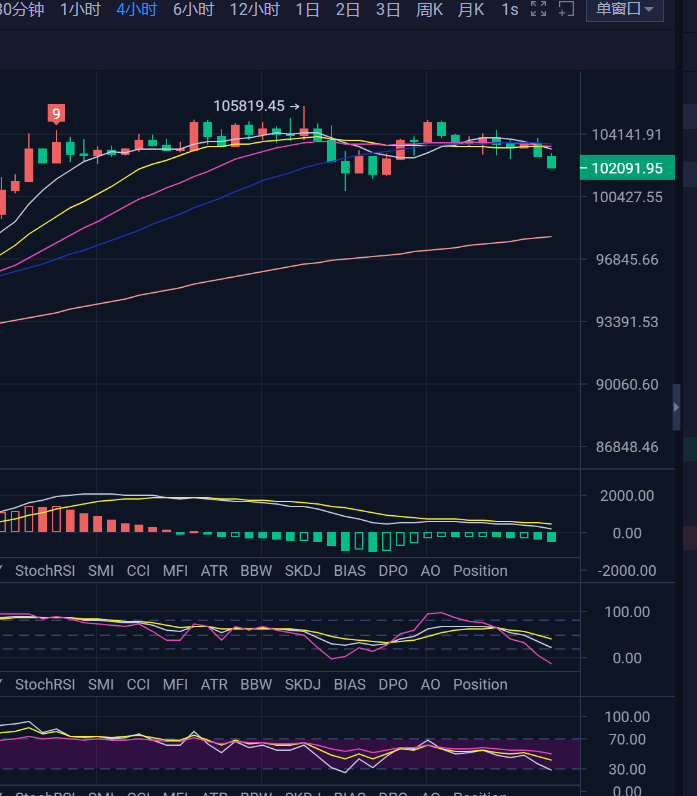
On the four-hour chart, it remains the same, operating within a bearish cycle. The difference is that the four-hour moving averages are more tightly clustered, and the coin price is also at a lower level. Given the current liquidity, it is relatively difficult for the four-hour bearish cycle to drop directly; maintaining oscillation in the short term is more in line with demand, as both long and short liquidity need to accumulate within the oscillation. The main support levels below are at two positions: the $100,000 mark and $98,000, while the short-term pressure above remains at $103,500.
In terms of operations, we previously initiated short positions near $103,500, and after adding to our positions, we are now above the average price of $104,000, with slight profits. For the short-term market, we currently view it as oscillating. Until a breakout occurs, we can continue to operate within the oscillation. A short-term long position can be considered near $101,000.
Although Ethereum has performed much stronger recently, it will still be influenced by the Bitcoin market in the short term. However, when a rebound occurs, it may be quite strong. Therefore, if there are opportunities for low long positions, setting up Ethereum near $2,450 is still a good idea.
【The above analysis and strategies are for reference only. Please bear the risks yourself. The article is subject to review and publication, and market conditions change in real-time. The information may be outdated, and strategies may not be timely. Specific operations should follow real-time strategies. Feel free to contact us for discussions on the market.】

免责声明:本文章仅代表作者个人观点,不代表本平台的立场和观点。本文章仅供信息分享,不构成对任何人的任何投资建议。用户与作者之间的任何争议,与本平台无关。如网页中刊载的文章或图片涉及侵权,请提供相关的权利证明和身份证明发送邮件到support@aicoin.com,本平台相关工作人员将会进行核查。


