Yesterday, the U.S. April CPI data was slightly lower than expected, indicating that inflation has not risen, alleviating the resistance to interest rate cuts. However, the market's capital flow has not strengthened in the short term, leading to high-level fluctuations in Bitcoin's daily candlestick chart. The current candlestick is leaning towards a mixed arrangement, with the MA5 daily moving average starting to flatten. The MACD and KDJ indicators are showing signs of convergence, and bullish volume is beginning to shrink. This week, positive information is being realized. Bitcoin is in a corrective rebound phase, while Ethereum is independently strengthening and reaching new highs. The current strong resistance on the daily chart is around the 10,500 level. Bitcoin must stabilize above this level to increase volume and reach new highs; otherwise, if it cannot stabilize above the 10,500 strong resistance this week, Bitcoin will experience a short-term correction.
On the 4-hour chart, Bitcoin has once again entered a range-bound adjustment trend. The MACD and KDJ indicators are leaning towards a bearish correction. However, due to weak trading volume, Bitcoin is likely to remain in a sideways small fluctuation in the short term. Analyzing the hourly chart, Bitcoin's price is operating within a descending channel, with highs gradually decreasing. The price shows signs of a pullback, indicating that selling pressure is temporarily strong. However, if it breaks below the 102,500 support with increased volume, it may accelerate the decline towards the 100,000 level. Therefore, regarding the early morning of May 15, my personal view is to maintain a short-term trading strategy focused on high leverage.
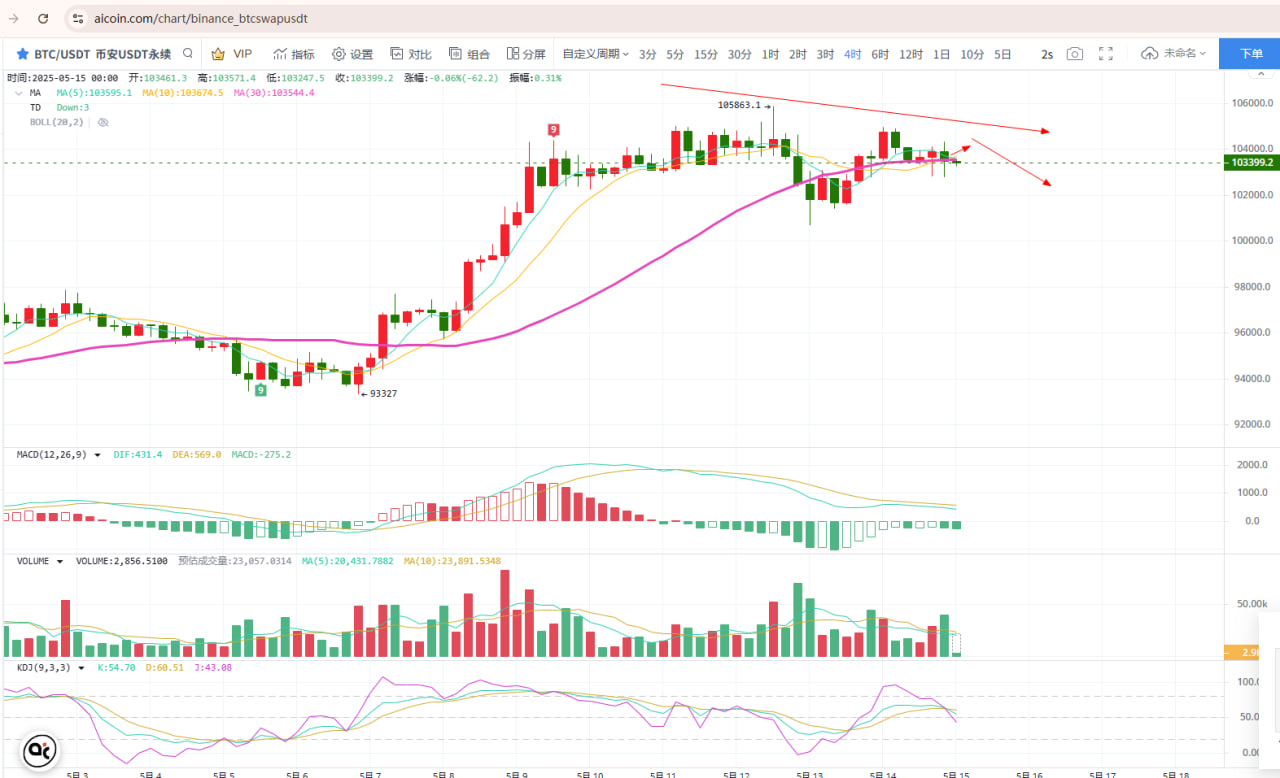
Trading strategy: Long between 103,600 - 104,200. Target: 102,500 - 102,000. Stop loss: 104,600.
Although Ethereum has recently shown a strong rebound trend, the 12-hour and 6-hour charts indicate that its basic trend is synchronized with Bitcoin, leaning towards a short-term correction. The short-term low support is around the 2,510 level. As long as the support at 2,510 is not effectively broken in the early morning, Ethereum will likely rebound again in tomorrow's daily update. Therefore, regarding the early morning trend, the short-term strategy for Ethereum can be to go long if it does not break the support, considering entering more positions. Trading strategy: Long between 2,610 - 2,640. Target: 2,560 - 2,510. Stop loss: 2,660.
Post time: 0:50
Personal views are for reference only. There may be delays in article review and posting, and the market changes rapidly. Specific entry and exit points should be guided in real-time, and caution is advised when entering the market.
Writing articles and analysis is not easy; I welcome everyone to like and support. A scientific and reasonable trading system, along with position control and risk management techniques, can help you reach greater heights! It will guide you out of confusion and darkness! Just like you, who are still indecisive at this moment, quickly scan the QR code to follow for surprises and real-time market analysis.

免责声明:本文章仅代表作者个人观点,不代表本平台的立场和观点。本文章仅供信息分享,不构成对任何人的任何投资建议。用户与作者之间的任何争议,与本平台无关。如网页中刊载的文章或图片涉及侵权,请提供相关的权利证明和身份证明发送邮件到support@aicoin.com,本平台相关工作人员将会进行核查。


