Let's take a look at today's market analysis, responding to yesterday's market situation after the Bitcoin interest rate meeting concluded.
Bitcoin has surged for two consecutive days, and this wave of movement is quite clear. It is still forming a bottom with a small double bottom breakout followed by a pullback.
Then, it entered a range-bound consolidation, achieving a breakout, and after another range-bound consolidation, it achieved another breakout.
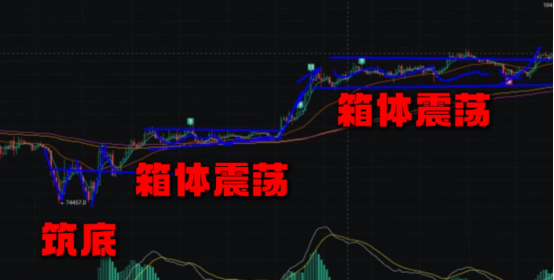
Currently, the price has moved without any pause over the past two days, reaching the 104,000 mark. Previously, we mentioned that 100,000 is a strong psychological level, and after a brief stay at this level, it instantly broke through.
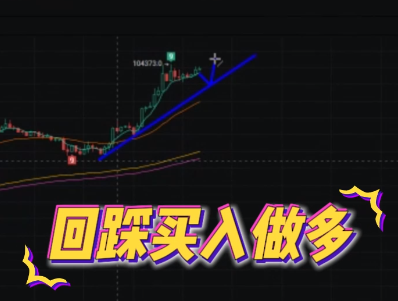
This can also be seen from the chart, where the bullish momentum is very strong. Next, how to operate with Bitcoin is quite simple. First, we look at the 4-hour ascending trend line. As long as the ascending trend line is not broken, we can still consider buying on pullbacks.
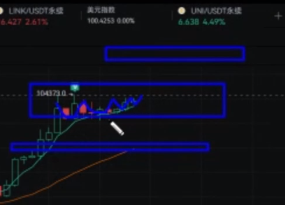
This is the first relatively aggressive method. The second method is that currently, the price has reached the second resistance level among the three key resistance levels we mentioned earlier. The second level is the integer level of 102,000-104,000, and above that is the previous high around 110,000. Currently, the price has shown a significant weakening of momentum at this level, so we should not blindly chase after it.
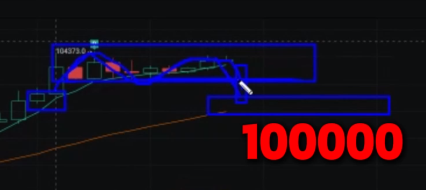
If we want to chase at this level, we need to set a nearby trailing stop loss, for example, at the 102,000 point. This is something we need to pay attention to in order to prevent a top formation, where after consolidation, a double top could form, trapping those who shorted at the top.
Secondly, if the price continues to rise and breaks through this range, it is likely to reach the previous high position, around 100,800 to 110,000. This means we can consider placing a short position around the previous high. If it breaks upward and continues to rise, reaching a new historical high, then where it goes from there will depend on how far institutions can push the price.
There are no past reference data for this, and we will have to wait to see where it goes to analyze new data. If it goes down, for example, if it cannot break through this level and forms a double top pattern, and then breaks below the 102,000 point, it could potentially fall back to the 100,000 integer level, as this level has trapped many short sellers. There is a chance it could fall back to this level.
This means that when we consider going long again, another approach is that if the 100,200 point is broken, we can consider exiting and observing until the price further falls back to the 100,000 integer level before considering a long position.
Of course, a more conservative approach would be to prioritize the lower level of 98,000, which is also the point after breaking through and further rising. This is the second entry point for going long.
The lower levels would be around 96,000 to 95,000, but the probability of returning to this 95,000 to 96,000 range in the short term is still relatively low.
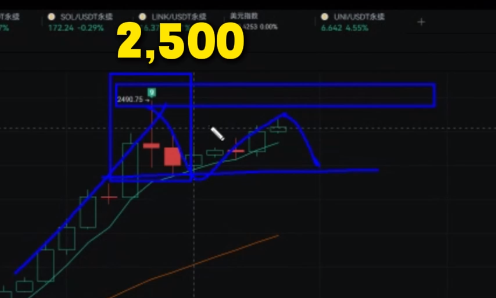
Ethereum has had a strong performance over the past two days, breaking out after a period of consolidation. After half a month of range-bound consolidation, it finally broke out, and Ethereum has now stood above 2,500 points.
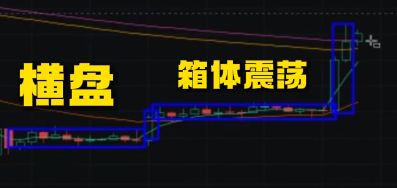
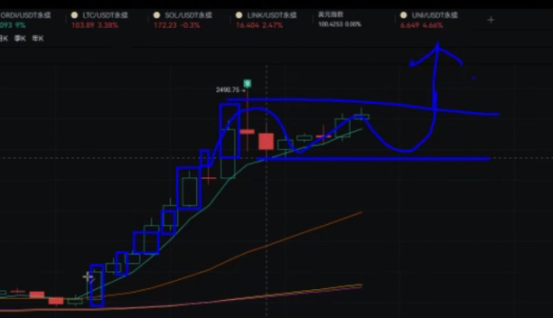
Currently, from a daily perspective, the bullish momentum is very strong. We often say that the longer the horizontal movement, the wider the vertical movement. Currently, there are no signs of a stop in the daily timeframe, so when we consider short positions, we must set stop losses, especially from the daily perspective.
The stronger upper level is in the range of 2,500-2,600, and for a more aggressive approach, it is in the range of 2,700-2,800.
Basically, if it reaches this level, because the horizontal movement is long, a 1:1 ratio would place it in this range.
At that time, we can choose to set up our short positions based on the actual situation.
From the 4-hour perspective, 2,500 is a relatively strong short-term resistance level. Because yesterday, when the price reached this level, it quickly fell back nearly 200 points. Currently, the volume at this level is also relatively large. If the price runs back to this top and cannot break through, it may form signs of a double top, so we need to pay attention to the breakout situation at 2,500.
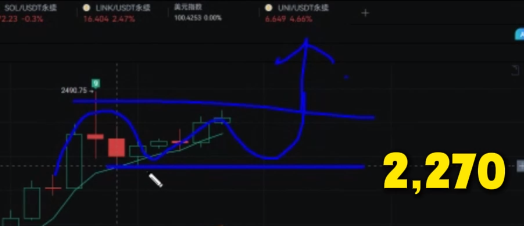
If the price breaks through to a new high, it may continue to rise to 2,550, 2,600, and if more aggressive, to 2,700-2,800.
This is for the long positions. If it cannot break through 2,500, we need to focus on the support level at 2,270. If this level cannot hold, it may form signs of a double top. It will continue to consolidate at this level, and the price will further rise, which is something we need to pay close attention to.
We can see that Ethereum was relatively weak before, but this wave clearly shows that it is very strong, with no signs of any pullback.
In such a situation, we must set stop losses for short positions; otherwise, it is easy to get trapped below.
If you still feel confused about trading, you can follow our public account: KK Strategy.

免责声明:本文章仅代表作者个人观点,不代表本平台的立场和观点。本文章仅供信息分享,不构成对任何人的任何投资建议。用户与作者之间的任何争议,与本平台无关。如网页中刊载的文章或图片涉及侵权,请提供相关的权利证明和身份证明发送邮件到support@aicoin.com,本平台相关工作人员将会进行核查。


