
Last week, the US stock market mostly rebounded, with the S&P 500 and Nasdaq indices breaking through the large bullish candle on the 9th. Theoretically, this suggests a continued bullish outlook, observing the completion of harmonic patterns and a retest of the upward trend line, along with the possibility of further declines.
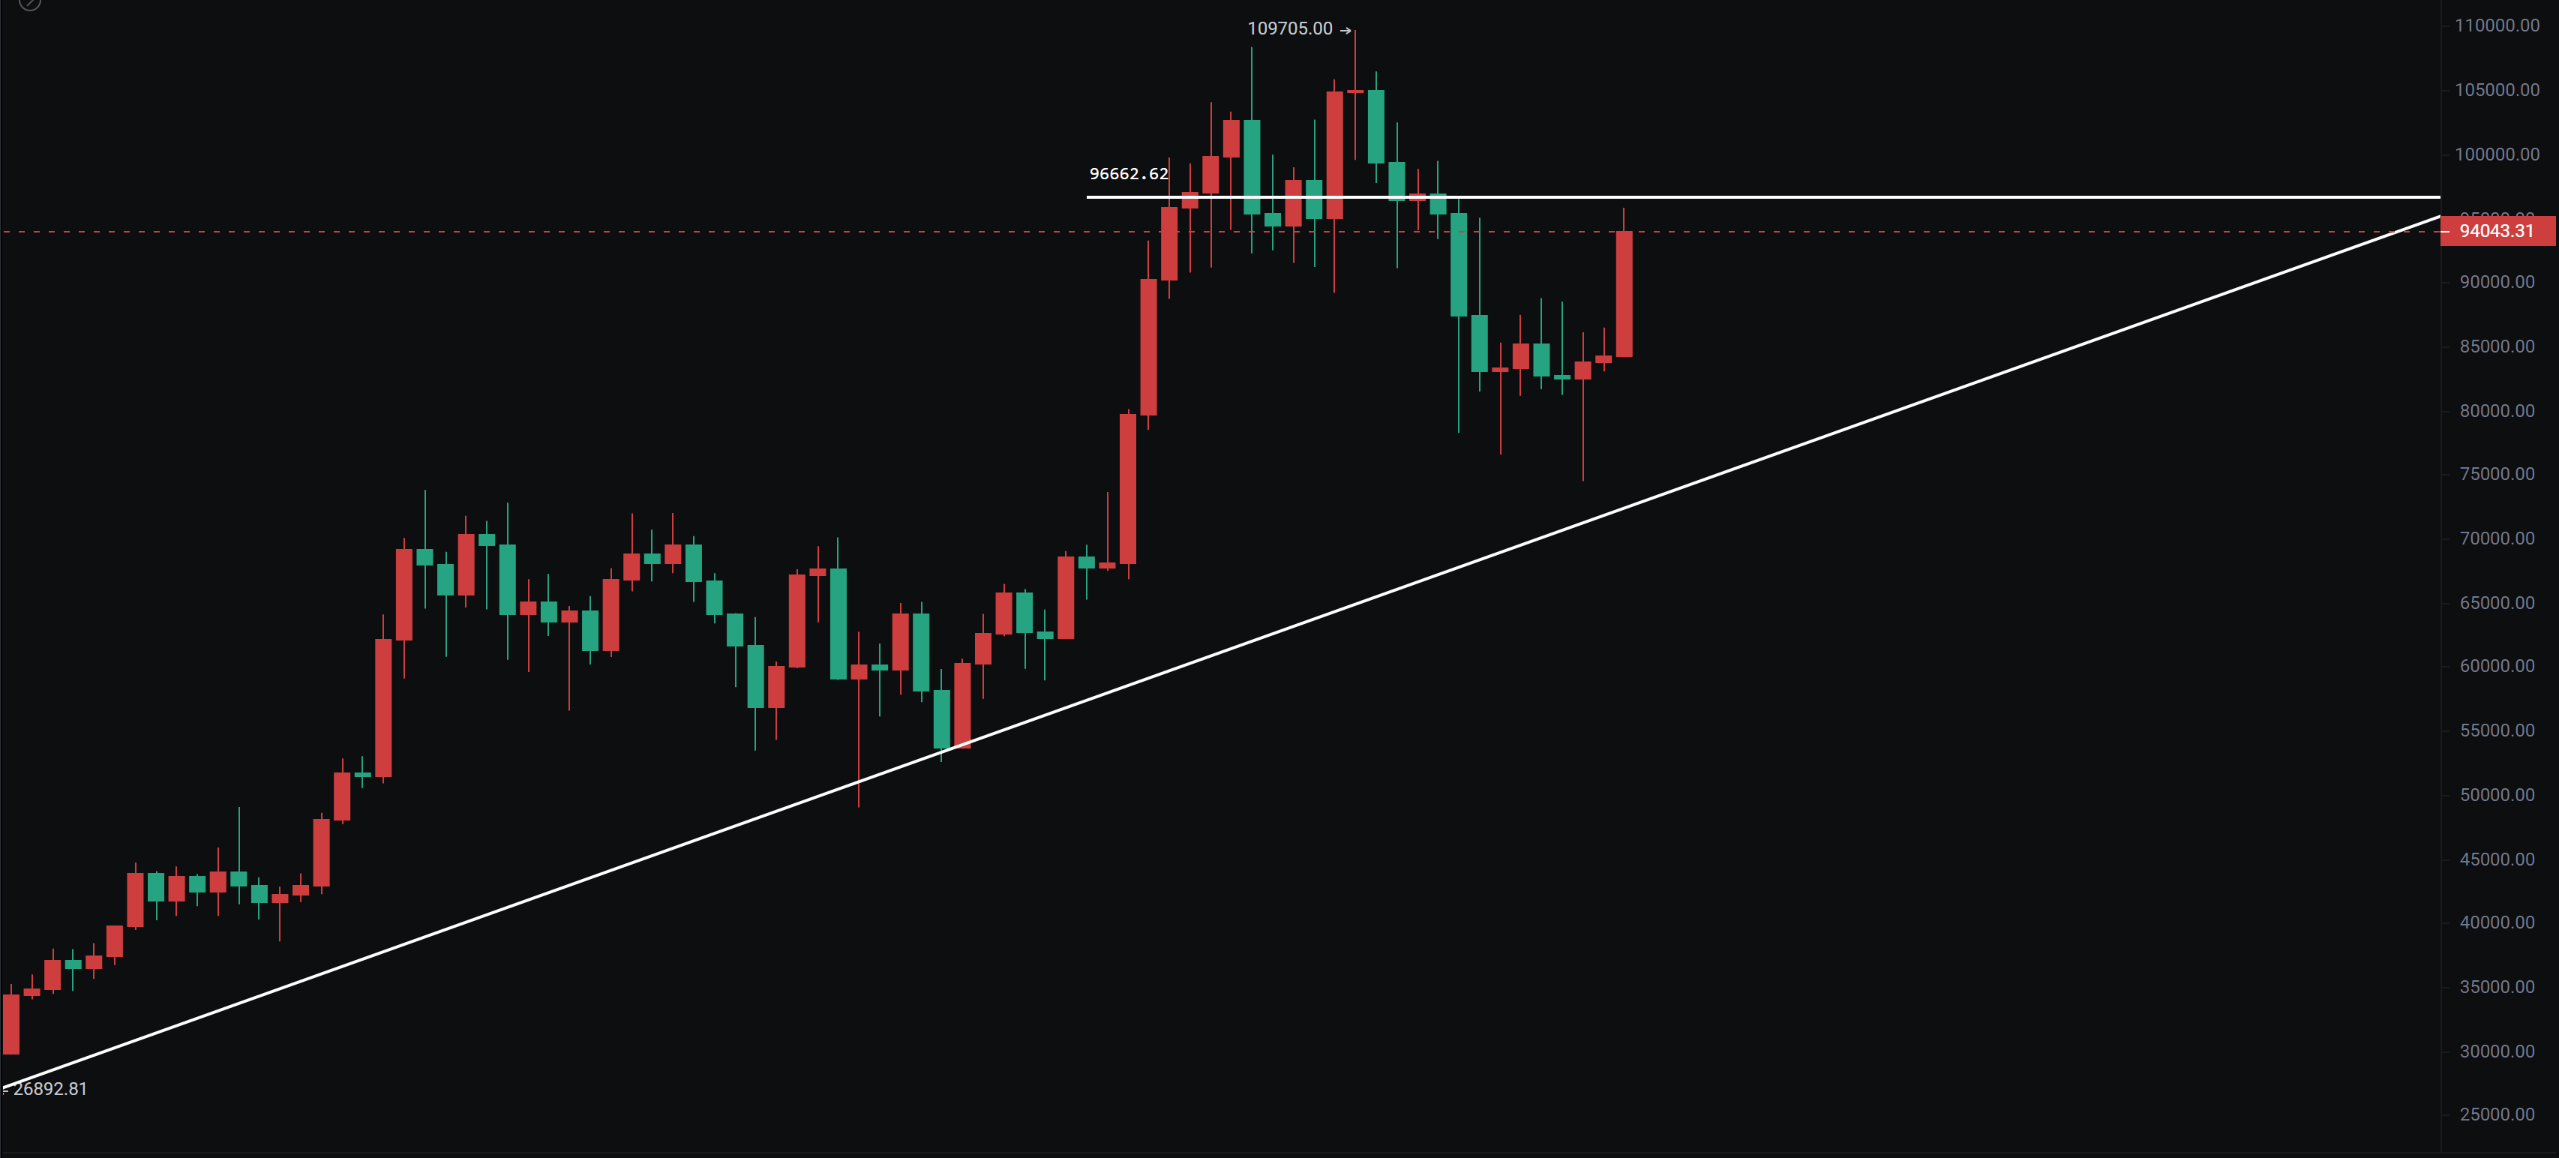
Bitcoin's weekly closing showed a medium bullish candle, indicating a U-shaped rebound, facing significant resistance from the upper platform. The probability of breaking through so much pressure at once is relatively low.
The US dollar index showed a rebound on the daily chart, and it cannot be ruled out that it will test the support around $100, which has been broken for two years, especially as the conflict between India and Pakistan continues to escalate. This is something the whole world knows as a conspiracy, but it cannot be stopped. It is merely a manifestation of the United States shifting its crisis…
Bitcoin
Bitcoin rebounded below the Fibonacci 0.618 level without breaking through in recent days, showing short-term rises followed by declines. Those without positions previously should not chase the rise. Since the rebound from 74457, it has gone through three upward waves, and we are looking for a short-term 4th wave correction before observing the height of the 5th wave rebound. Here, it is also mentioned that we need to watch the height of the US stock market rebound.
Since the 23rd, it has been oscillating between 91600 and 96000 on the 4-hour chart. If MACD cannot cross the zero line again, consider re-entering on a pullback to 88000-89000.
Support: 88000-89000
Resistance: 96000-100000
Ethereum
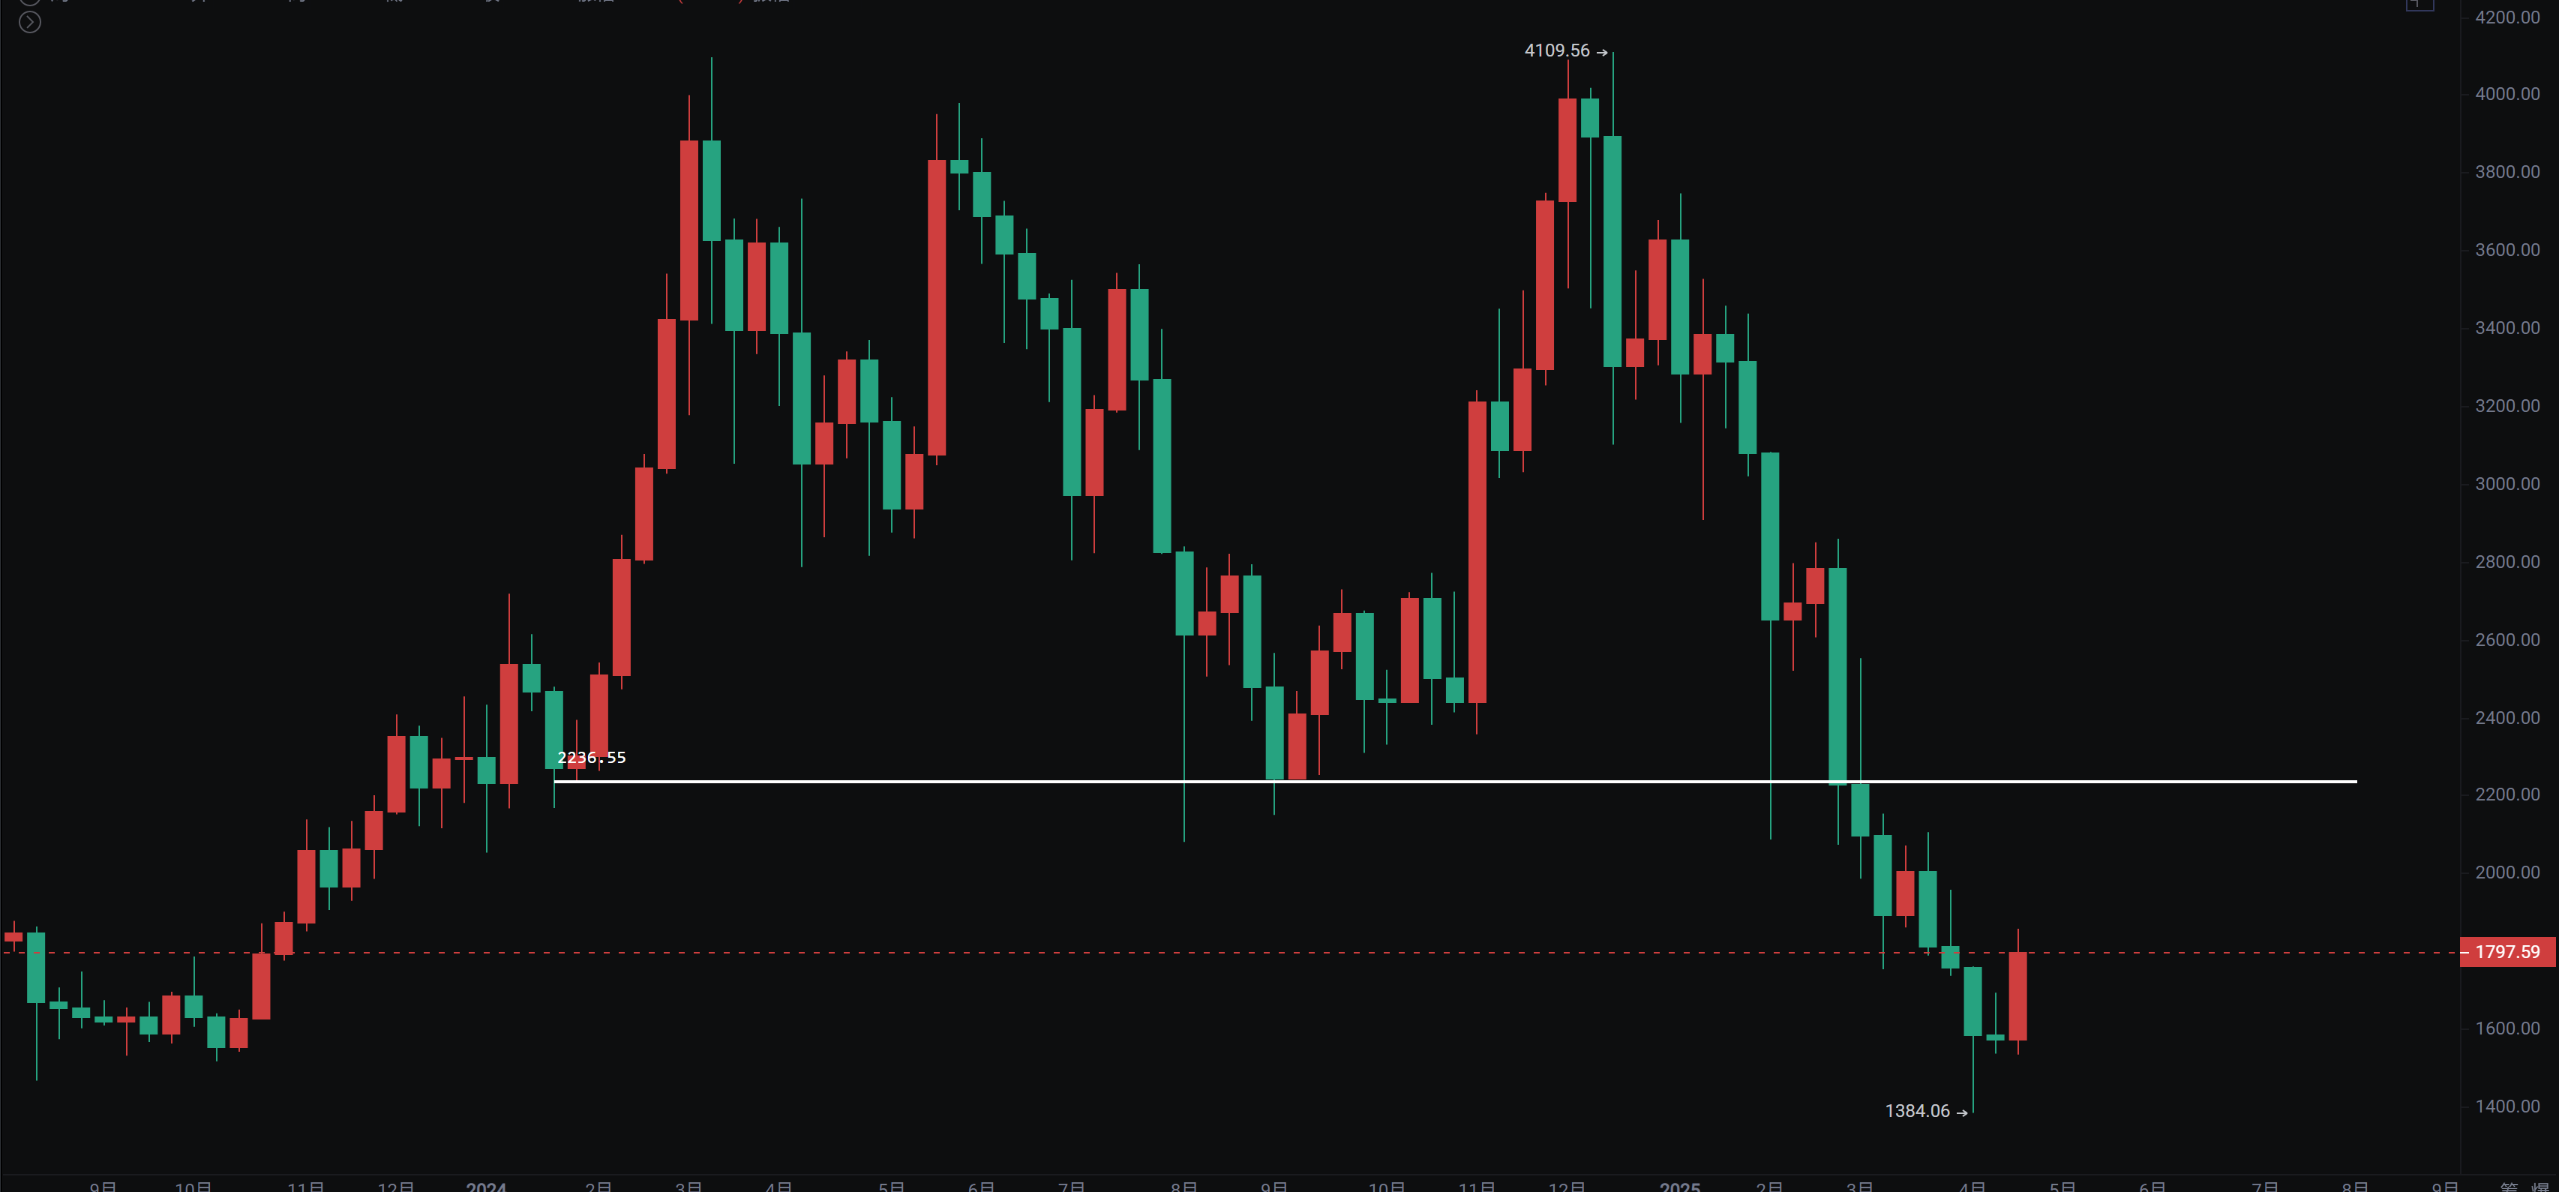
The weekly chart also shows a rebound, but the magnitude is relatively small. The daily chart reached a high of 1857, and it is not suitable to chase the rise in the short term. Focus on the pullback support at 1723-1676 to see if there will be a follow-up rise. The ETH/BTC exchange rate rebound is also not strong. After the spike at 0.01766, it is close to a 20-year low.
Support: 1622-1723
Resistance: 1957-2100
If you like my views, please like, comment, and share. Let's navigate through the bull and bear markets together!!!
The article is time-sensitive and for reference only, updated in real-time.
Focusing on K-line technical research, sharing global investment opportunities. Public account: BTC Trading Prince Fusu

免责声明:本文章仅代表作者个人观点,不代表本平台的立场和观点。本文章仅供信息分享,不构成对任何人的任何投资建议。用户与作者之间的任何争议,与本平台无关。如网页中刊载的文章或图片涉及侵权,请提供相关的权利证明和身份证明发送邮件到support@aicoin.com,本平台相关工作人员将会进行核查。


