The U.S. has increased tariffs on Chinese goods to 245%, gold has surpassed $3,300 to set a new historical high, and BTC is fluctuating around $84,000.
Macroeconomic Interpretation: As the price of gold breaks through $3,300 per ounce to set a new historical high, and Bitcoin fluctuates around the $84,000 mark, a currency order reconstruction led by geopolitical factors is reshaping global capital flows. The latest research from Coinank reveals just the tip of the iceberg: the traditional currency "Four Kings" composed of the U.S. dollar, Japanese yen, British pound, and euro is depreciating at an annual rate of about 3.2%. This chronic poison is particularly deadly in the field of cross-border payments—currently, for every $10 settled in international trade, $1.3 is actively avoided due to sanction risks, a figure that has ballooned by 400% compared to three years ago.
The fuse of this currency trust crisis continues to burn between China and the U.S. The U.S. White House's move to increase tariffs on Chinese goods to 245% not only led to a hard-hitting response from spokespersons stating "there are no winners in a tariff war" flooding social networks but also triggered what economists call the "collapse of dollar faith." Data shows that the global central bank dollar reserve ratio has dropped from 72% in 2000 to 58%, while gold holdings have increased by 15% during the same period. In stark contrast, Bitcoin is entering the range of sovereign asset allocation as a "digital Noah's Ark," with market predictions suggesting that within the next five years, 2.5% of central bank reserves will be settled through Bitcoin, a proportion sufficient for Bitcoin to capture 10% of the market share in international trade settlements.
The capital market's reaction to stress is more direct than policy statements. In pre-market trading, gold stocks collectively staged a "golden frenzy," with Harmony Gold's daily surge of 8% in its K-line chart contrasting with Nvidia's 6.83% drop due to export restrictions. Behind the simultaneous plunge of tech giants like Tesla and ASML is a capital migration: shifting from risk assets to anti-inflation targets. In this wave of migration, Bitcoin exhibits a unique duality—possessing gold's safe-haven attributes while retaining the growth potential of tech assets. When Sun Yuchen's withdrawal of $150 million in ETH from Ethfi raised market alertness, Bitcoin's on-chain data showed that whale addresses increased their holdings by 12%, a move reminiscent of a classic script in the cryptocurrency market.
The cracks in dollar hegemony are evolving into structural gaps. The boomerang effect of Trump's tariffs has put pressure on the dollar index, while the tacit promotion of "de-dollarization" by various central banks provides a historic opportunity for Bitcoin. Notably, Bitcoin's market value has now reached 8% of gold's market value, a ratio that was only 0.8% in 2019. If Bitcoin were to chase gold's growth at a rate of 1/10, breaking through the $100,000 mark may just be a matter of time. However, the market still needs to digest short-term pressures: the widespread decline of altcoins, a delicate balance of 1.05 in long-short ratios, and a staggering $24 billion in open contracts in the derivatives market all remind investors that this market is still walking on the edge of a razor.
Bitcoin is completing its identity transformation. As central banks around the world begin to seriously consider including Bitcoin in their reserve asset portfolios, and as international trade settlements start to feature BTC trading pairs, this financial experiment that began in the cryptographic geek community may be writing the prologue to a new version of the "Bretton Woods System." After all, in an era where fiat currency depreciation has become the norm, an asset that can ensure a cap of 21 million coins through hash algorithms is, in itself, the most elegant satire and transcendence of the credit currency system.
According to CoinAnk AI's intelligent analysis, the BTC market analysis report is as follows:
Main support level: 82,074.07 USDT
Main resistance level: 85,453.17 USDT
Current trend: Fluctuating with a bearish bias
Technical Indicators Summary:
Moving Average System: MA5=83,562.20, MA10=84,382.92, MA20=84,354.05, MA120=82,677.92. The current price is between MA5 and MA10, both of which are trending downward, indicating significant short-term bearish pressure, but the long-term MA120 is still trending upward, showing that the long-term trend has not completely turned bearish.
MACD: DIF=224.18, DEA=553.86, Histogram=-329.68. The MACD is in a death cross state, and the histogram remains negative, indicating bearish market momentum.
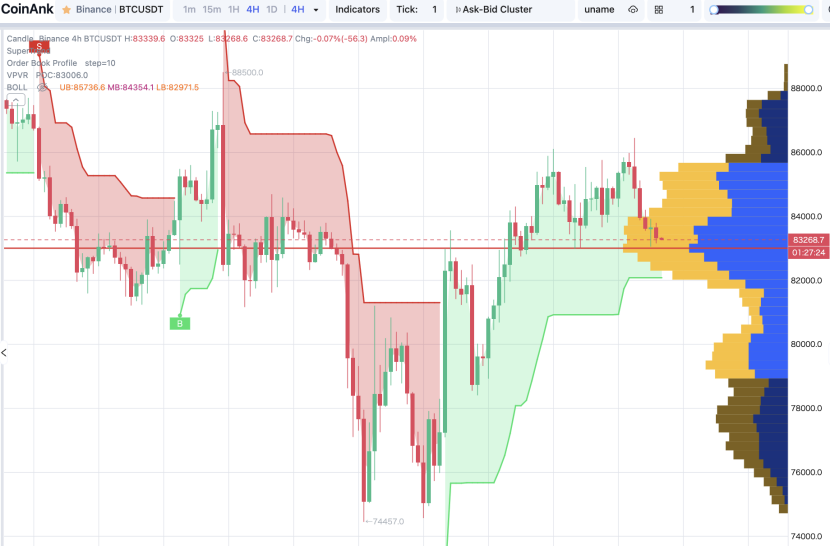
BOLL: Upper band=85,736.62, Middle band=84,354.06, Lower band=82,971.49. The current price is between the middle and lower bands, and %B=0.11%, indicating that the price is close to the lower band, suggesting a potential rebound demand in the short term, but overall it remains weak.
RSI: RSI6=28.63, RSI12=43.50, RSI14=45.81, RSI24=50.01. RSI6 is in the oversold area, indicating a potential for a rebound in the short term, but RSI12 and RSI14 are still in the neutral area, showing that market sentiment has not completely turned bullish.
KDJ: K=15.85, D=29.02, J=0.00. KDJ is in the oversold area, indicating a potential for a rebound in the short term, but the J value is close to 0, indicating weak market momentum.
Indicator Data:
Funding Rate: 0.00817200%. The funding rate is in the neutral area, indicating a relatively balanced market sentiment with no clear bullish or bearish signals.
Volume Changes: Recent trading volume has shown fluctuations, but volume has increased during price declines, indicating capital outflow during the downturn, suggesting significant short-term bearish pressure.
Capital Flow Data: 24-hour contract net capital outflow is 663,530,323.24 USDT, indicating significant capital outflow from the market, increasing short-term bearish pressure. Spot market net capital outflow is 71,582,194.28 USDT, further validating the bearish sentiment in the market.
Analysis Result:
Direction: Cautiously bearish
Entry Timing: It is recommended to enter short positions at resistance levels during price rebounds, which are close to MA10 and the middle band of BOLL, providing strong resistance.
Stop-Loss Setting: Set the stop-loss at 2.6% above, in line with volatility requirements.
Target Price: Expected return of at least 3%; if conditions are not met, observe the market.
Note: This analysis is for reference only and does not constitute any investment advice!
免责声明:本文章仅代表作者个人观点,不代表本平台的立场和观点。本文章仅供信息分享,不构成对任何人的任何投资建议。用户与作者之间的任何争议,与本平台无关。如网页中刊载的文章或图片涉及侵权,请提供相关的权利证明和身份证明发送邮件到support@aicoin.com,本平台相关工作人员将会进行核查。


