Interpretation of Ethereum (ETH) Market Structure
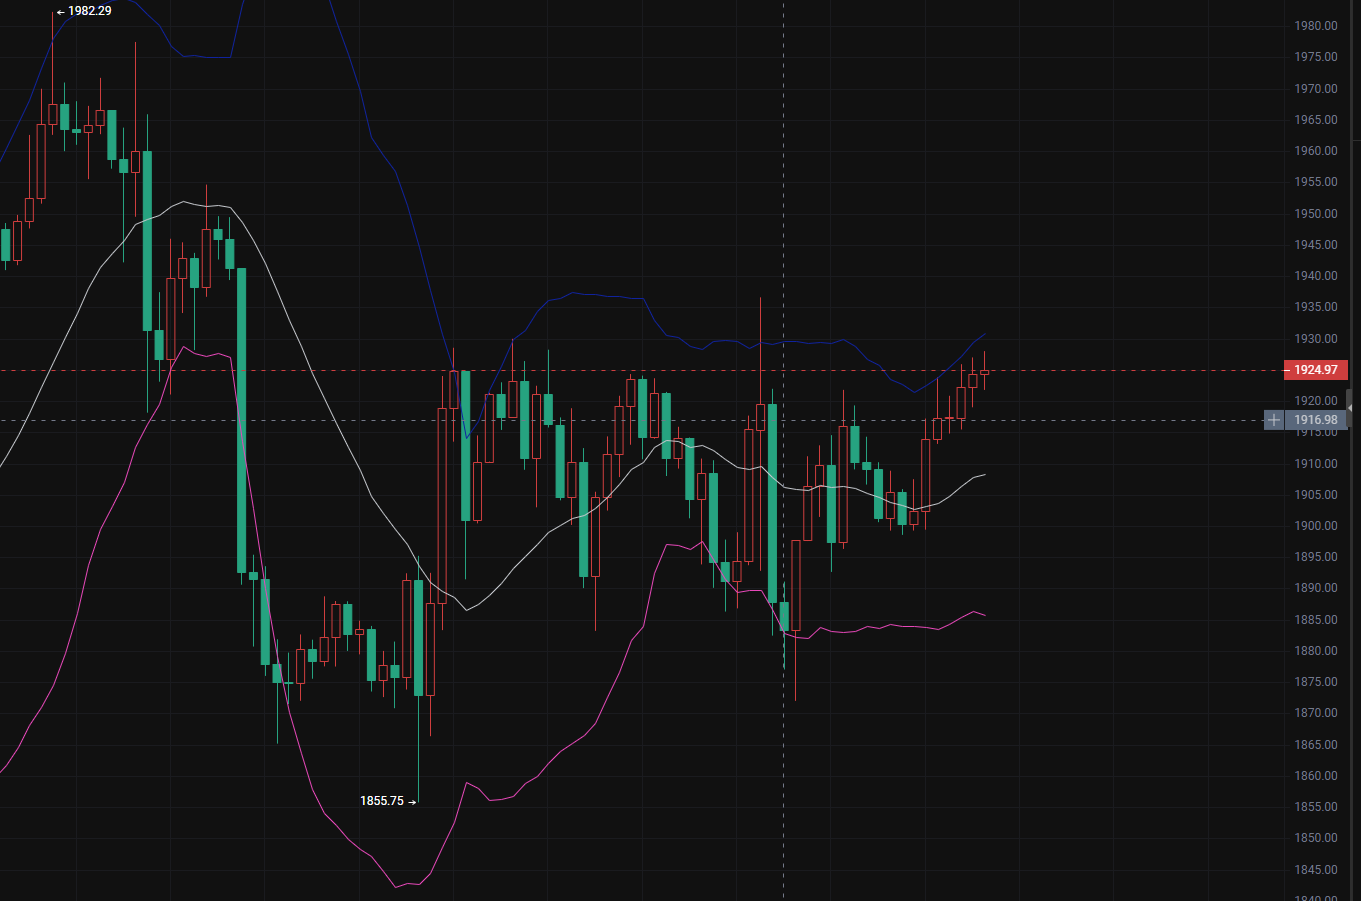
Bollinger Band Form State
After this round of sharp decline, the Bollinger Band channel has gradually shifted from expansion to contraction, indicating that the one-sided downtrend has come to an end, and the market has entered a phase of wide fluctuations and strategic struggles.
The price has begun to rebound from the lower band support, and is currently fluctuating in the range of above the middle band and below the upper band.
The middle band has turned into a key dynamic support at this stage, while the upper band continues to form strong resistance above.
K Line and Bollinger Band Interaction Performance
After the price touched the lower band position at 1855.75, multiple K lines have fluctuated upwards, relying on the lower band to the middle band to complete the rebound repair.
During the recent rebound, the K line tested upward several times near the upper band but failed to effectively break through and stabilize above the upper band; after reaching a high, it couldn’t maintain bullish momentum, experiencing minor pullbacks while under pressure, which is characteristic of typical fluctuation market features: retreating under pressure near the upper band, gaining buying support near the lower band.
The current price is around 1924.97, operating closely above the middle band. In the short term, the K line has shown a series of small upward candles gradually rising, with bulls holding a slight short-term advantage, but the distance to the upper band resistance area is very close, and the upper space has become constrained.
Key Interval Division
✅ Upper Pressure: Bollinger Band upper band (1935-1955 range), if the price reaches this area, it is highly likely to replicate the previous trends and face resistance and retreat;
✅ Core Dynamic Support: Bollinger middle band near 1900, this is the dividing line between bulls and bears for the recent oscillation box;
✅ Strong Support Below: Bollinger Band lower band 1860-1880 range, which is the support position for the starting point of this rebound.
Operational Suggestions
Set up short positions in the 1930-1950 area, with protection above 1965.
Set up long positions in the 1860-1880 area, with protection below 1840.
Market Scenario Simulation
1. Upward Scenario: If the fluctuations continue upward, the price will test the resistance of the Bollinger Band upper band, if it cannot break through and stabilize above the upper band, a retracement will occur, returning to test support near the middle band; only if the K line achieves an effective breakthrough above the Bollinger upper band will the channel open again, allowing the rebound to continue further.
2. Downward Scenario: If the bulls lack strength, and the price falls below the Bollinger middle band, the market’s focus will shift downward, testing the lower band support near 1880, where a bounce may occur in the lower band area.
Interpretation of Bitcoin (BTC) Market Structure
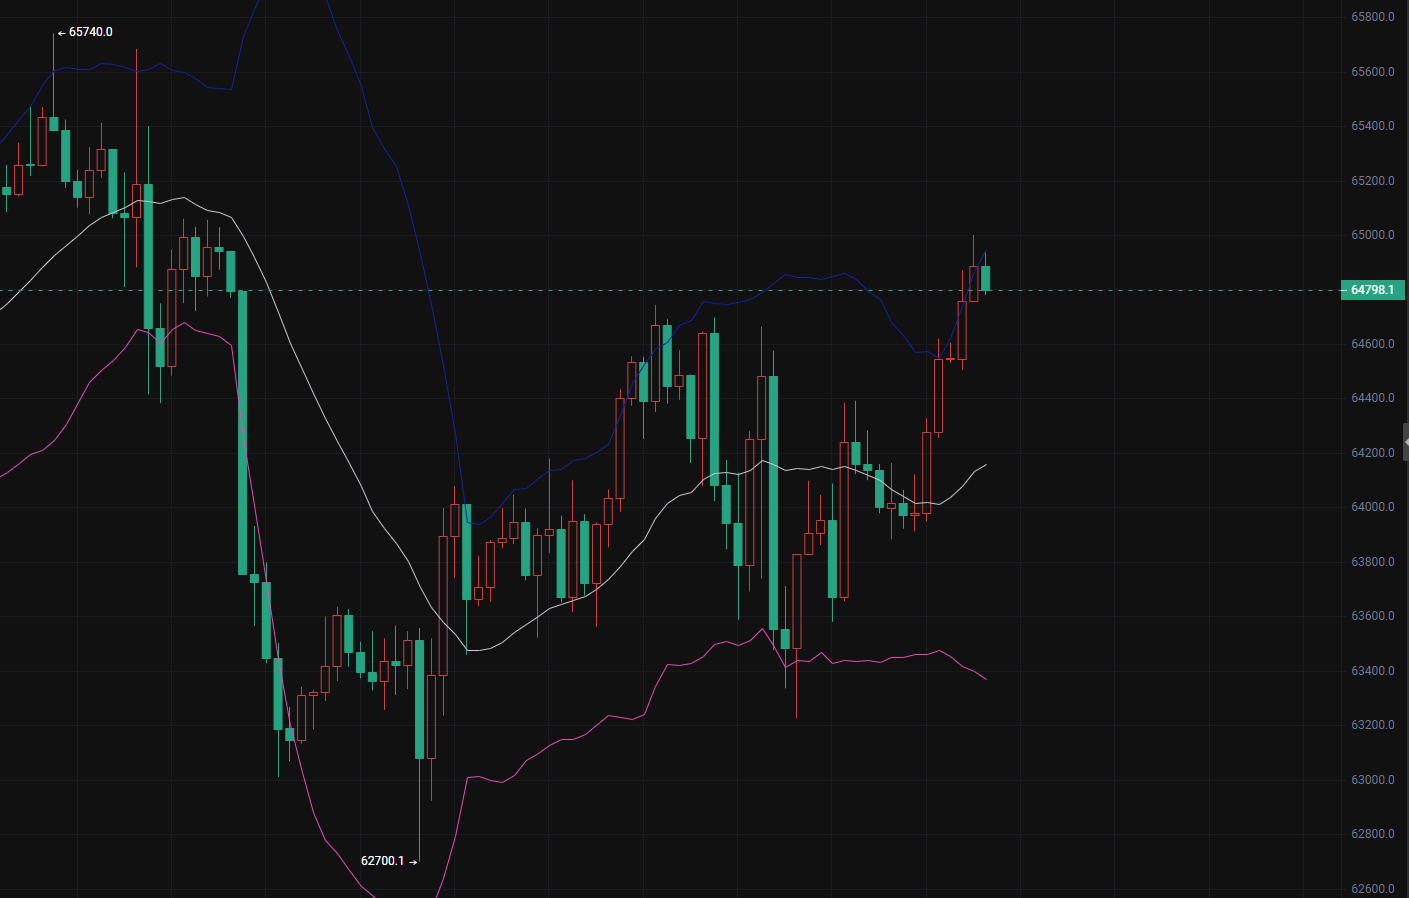
Bollinger Band Channel State
After the drop, the Bollinger Band has gradually contracted from expansion, signaling the end of the one-sided downtrend, and the market has shifted to a wide fluctuation pattern. The price has started to rebound, relying on the Bollinger lower band for support, and is currently operating in the range of above the middle band and below the upper band.
The middle band has transformed from previous resistance to current important dynamic support, while the upper band continues to exert strong pressure above.
K Line and Bollinger Band Interaction Performance
Since the low point of 62700 touched the lower band and stabilized, the K line's focus has continuously oscillated upward, repairing towards the middle band along the lower band of the Bollinger Band.
During this rebound, the price tested the upper band area but failed to effectively break through the upper band, forming a retreating K line with an upper shadow, exhibiting typical fluctuation characteristics: retreating under pressure near the upper band and gaining buying support near the lower band.
The current price is 64798, experiencing a slight pullback after reaching a short-term high, closely running below the upper band, and the bullish short-term rebound momentum is beginning to diminish, with significant constraints above.
Key Interval Division
✅ Upper Pressure: Bollinger Band upper band 65000 range, if the price reaches this area again, it is highly likely to replicate this round of movement, increasing and facing pressure to retreat;
✅ Core Dynamic Support: Bollinger middle band 64000 nearby, the dividing line for this round of fluctuation box between bulls and bears;
✅ Strong Support Below: Bollinger lower band 63200 - 62700 range, which is the bottom support area where the previous low began to rebound.
Scenario Simulation
1. Upward Scenario: If the price once again attempts to attack the Bollinger upper band pressure, if the K line cannot stabilize above the upper band, it will trigger a pullback, first testing the support at the Bollinger middle band of 64000; only if a large bullish candle effectively breaks through the Bollinger upper band will the channel open again, allowing the bullish rebound to continue further.
2. Downward Scenario: If the bullish power is insufficient and the price continuously falls, breaking below the Bollinger middle band of 64000, the market's focus will shift downward, continuing to test the support range of 62700-63200 at the lower band, where a technical rebound may be expected upon retesting the lower band.
Operational Suggestions
Bearish Strategy (Focus on Shorting in Fluctuation Markets)
If the price rebounds to near the upper band pressure of 65000, and the K line shows excessive upward movement with long upper shadows, a short position can be set up.
First target at the 64000 Bollinger middle band; second target looks to the support around 62700-63200 lower band.
Risk Control: Set stop-loss above 65740 to guard against an effective breakout above the Bollinger upper band that might break the fluctuation pattern.
Support Level Buy Low, No High Pursuing
When the price falls to the 62700-63200 Bollinger lower band support range, and the K line forms a reversal pattern indicating stabilization, set up a buy low.
First target at the 64000 Bollinger middle band; second target at the pressure area above 65200 upper band.
Risk Control: Place the stop-loss below 62000, as an effective drop below the lower band implies a break in the fluctuation structure, opening up downward space.
Public Account - Bitcoin Big Bear X
(Note: 📣 Due to the timeliness and depth limitations of information on public platforms, the market changes rapidly, and key turning points, precise operational strategies, and sudden risk alerts need to be synchronized on the public account promptly. Here you can obtain: real-time strategy push notifications, in-depth analytical support, interactive Q&A, risk warnings, and optimization suggestions for personal holdings. 🚨 Remember: The market always rewards those who act faster and have more accurate information! Be a winner in the minority.)

免责声明:本文章仅代表作者个人观点,不代表本平台的立场和观点。本文章仅供信息分享,不构成对任何人的任何投资建议。用户与作者之间的任何争议,与本平台无关。如网页中刊载的文章或图片涉及侵权,请提供相关的权利证明和身份证明发送邮件到support@aicoin.com,本平台相关工作人员将会进行核查。