Liying Chat Currency: 7.30 Bitcoin (BTC) and Ethereum (ETH) Latest Market Analysis
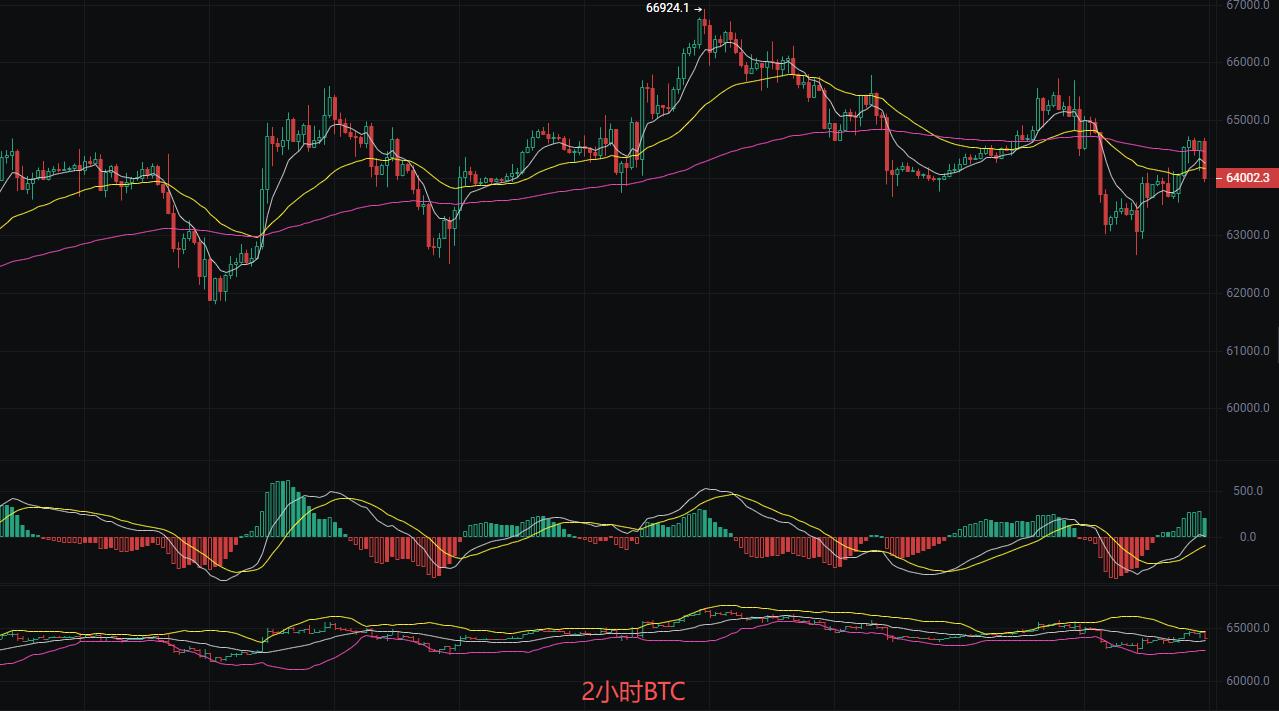
Currently, Bitcoin is at 64000, the price just held around 63000, and is now rebounding to fluctuate around 64000. But looking at it now, it seems like it can't fall any further? Moving averages and MACD indicators are quietly improving, indicating that the main force is secretly accumulating, preparing to make a move! In terms of technical indicators, EMA7 has crossed above EMA30, indicating a short-term bullish trend, but EMA120 is still pressing down above, illustrating a pattern of resistance above and support below. The MACD’s DIF and DEA below the zero axis with a golden cross indicate that the bullish force is strengthening, but it hasn't reached a strong zone yet. The middle line of the Bollinger Band at 63814 has become support; stabilizing above this midline is a bullish signal, the upper line at 64743 is the first target. Overall, the short-term trend is bullish, but a breakthrough above 64500 is needed to confirm the reversal.
Short-term strategy reference:
For bullish trades at 63500-63000, stop loss at 62500, target 64500 aiming for 65000.
For bearish trades at 65000-65500, stop loss at 66000, target 64500 aiming for 63500.
Ethereum
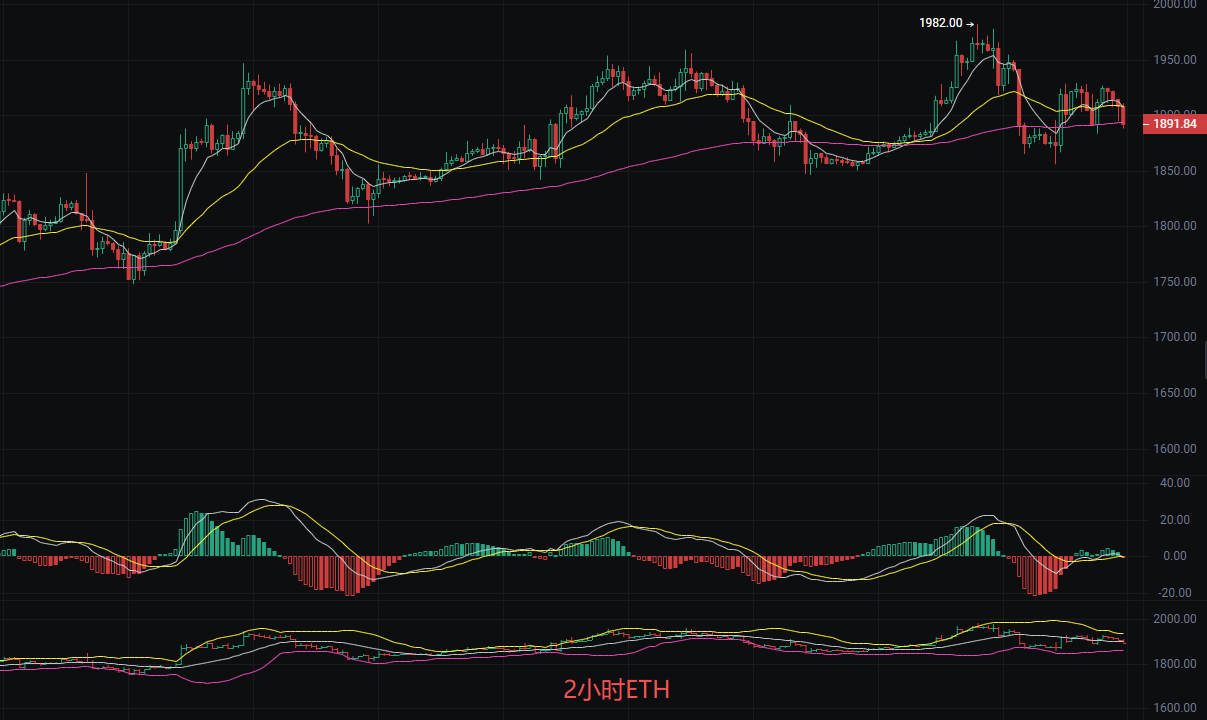
Currently, Ethereum is at 1890, unable to go up or down. After previously spiking to 1982, it began to correct and is now stuck in the middle. The short-term and medium-to-long-term moving averages are tangled, indicating that both bulls and bears are waiting, and no one dares to act rashly. The short-term EMA trend is weak, with EMA7 crossing below EMA30, forming a dead cross suppressing price, but EMA120 still provides support, indicating that the medium-to-long-term trend has not been broken. The MACD shows that DIF and DEA are sticking together below the zero axis, suggesting that bearish momentum is weakening. The distance between the upper and lower Bollinger Bands has narrowed to within 50 points, indicating a potential change in trend. The current price is below the middle line of the Bollinger Band, leaning bearish in the short term, but if it holds above the lower support at 1862, a rebound to test the upper line at 1937 may occur.
Short-term price reference:
For bullish trades at 1880, defense at 1830, stop loss at 1800, target 1960 aiming for 2000.
For bearish trades at 1980, defense at 2010, stop loss at 2040, target 1920 aiming for 1890.
The above content is exclusively authored by Liying; please indicate the source when reprinting! There may be delays in article release review, and the market changes rapidly; the above advice is for reference only, and risks are to be borne by the individual.

Warm reminder: The above content is solely created by the author on Weibo; the ads at the end of the article and in the comments section are unrelated to the author. Please distinguish cautiously, thank you for reading.
免责声明:本文章仅代表作者个人观点,不代表本平台的立场和观点。本文章仅供信息分享,不构成对任何人的任何投资建议。用户与作者之间的任何争议,与本平台无关。如网页中刊载的文章或图片涉及侵权,请提供相关的权利证明和身份证明发送邮件到support@aicoin.com,本平台相关工作人员将会进行核查。


