
Written by: Bu Shuqing
Funds flow data shows that global investors are undergoing a profound asset reallocation.
According to the Wind Trading Desk, Bank of America's latest "Flow Show" reveals that against the backdrop of rising expectations for Federal Reserve interest rate hikes and persistently rising long-end interest rates, smart money is accelerating its focus on emerging markets, technology stocks, and commodities, while maintaining caution towards US domestic stocks and UK stocks.
As of the week ending July 22, global stock funds saw a net inflow of $30.4 billion in one week, bond funds had a net inflow of $14.9 billion, gold funds saw a net inflow of $2 billion, and money market funds experienced a net outflow of $33.9 billion.
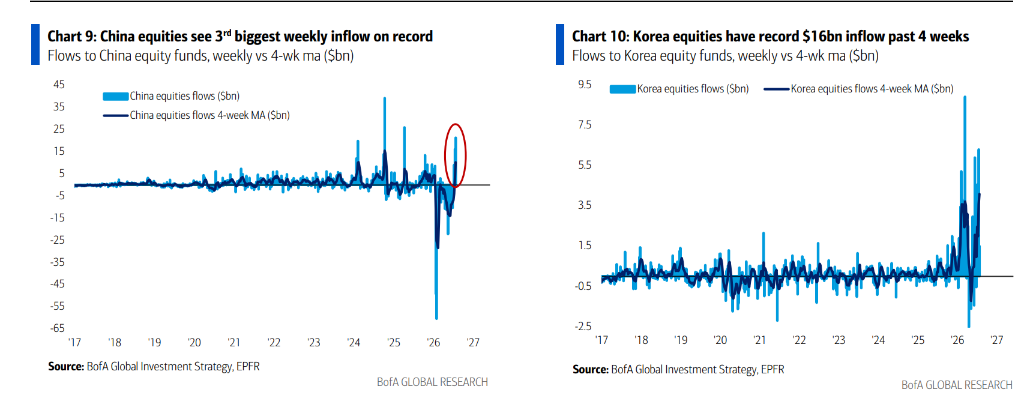
Among these, emerging market stocks had a net inflow of $29.6 billion in one week, the second largest one-week inflow in history; Chinese stocks had a net inflow of $21.3 billion, setting a record for the third largest one-week inflow in history; and South Korean stocks had a cumulative net inflow of $16.3 billion over the past four weeks, also hitting a record.
Meanwhile, Bank of America’s Bull & Bear Indicator remains in the extremely bullish range at 9.6, with sell signals remaining effective since being triggered in May 2026. Bank of America strategist Michael Hartnett warned that the strong inflow into technology stocks alongside hedge funds' increasingly bearish positions in oil prices, 2-year US Treasuries, VIX, etc., has resulted in market sentiment being at historical highs, and investors need to be alert to potential triggers for risk assets to de-leverage.
Emerging Markets are the Biggest Winners, Fund Inflows in China and South Korea Break Records
Emerging markets are becoming the biggest beneficiaries of this round of global fund reallocation.
Data shows that emerging market stock funds saw a net inflow of $29.6 billion in one week, the second highest ever; they have recorded net inflows for three consecutive weeks.
Chinese stock funds saw a net inflow of $21.3 billion in one week, the third largest one-week inflow in history. South Korean stock funds had a net inflow of $1.5 billion in one week, with a cumulative net inflow of $16.3 billion over the past four weeks, refreshing the historical record. In terms of cross-asset returns so far this year, South Korean stocks lead global stock markets with a 79.6% increase.
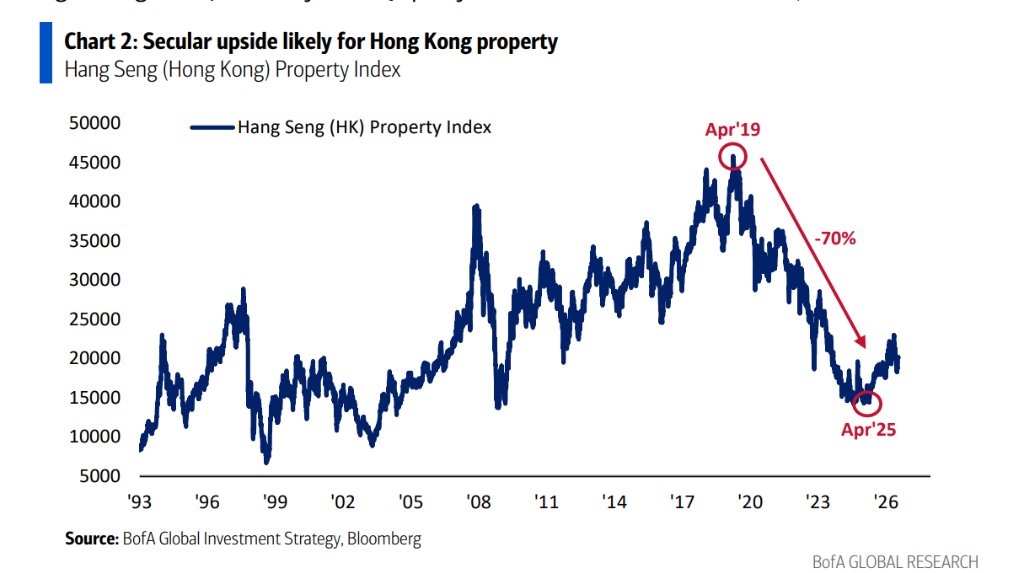
Bank of America strategists listed Hong Kong real estate stocks as a "long-term buying opportunity," noting that the Hang Seng Hong Kong Real Estate Index is currently comparable to prices from 30 years ago, with limited downside potential. As the financial environment in China stabilizes and the Asian technology sector rises over the long term, along with a new bull market in emerging markets and real estate, this sector is expected to achieve significant gains in the latter half of the 2020s.
Bank of America stated it will buy on any dips triggered by tightening policies from the Federal Reserve or currency crises from the Bank of Japan.
Record Inflows into Technology Stocks, but Warning Signals are Lit
Technology stocks remain the core area pursued by institutional funds.
Over the past four weeks, tech stock funds saw a cumulative net inflow of $52.8 billion, a historical record; with a single-week net inflow of $4 billion that week. Financial stock funds had a net inflow of $1.5 billion that week, accumulating a net inflow of $8.8 billion over the past four weeks, the largest four-week inflow since January 2022.
However, Bank of America also issued a warning.
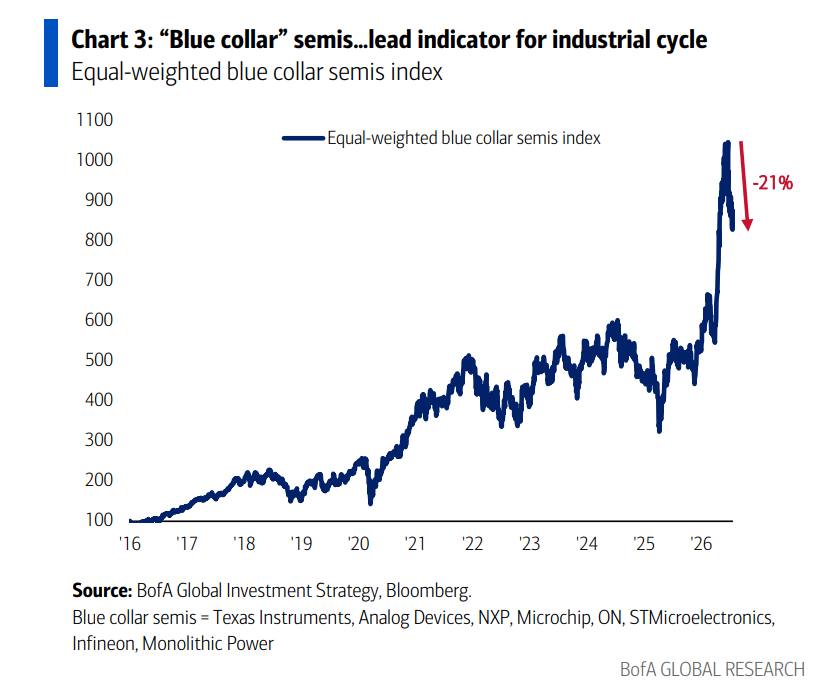
The report pointed out that the leading indicator of the industrial cycle—the "blue-collar semiconductor" index has fallen 21% from its June peak, challenging the market's widespread expectation of a "prosperous economy." Meanwhile, the MAGS ETF, representing the "seven technology giants," is struggling to hold the 200-day moving average (support level at $65).
Bank of America strategists suggested that in the event of a reversal in "prosperity" expectations, the best trading strategy is to go long on defensive sectors, high-dividend stocks, and duration assets while shorting bank stocks (which are currently seeing massive inflows), brokerage stocks, tech stocks, and industrial stocks—among which the over-allocation of industrial stocks has reached its highest level since July 2021.
Bond Markets Ripple with Hidden Currents, Long-End Rates Become the Biggest Variable
The bond market is sending signals that cannot be ignored. The yield on 30-year US Treasuries has risen to 5.2%, the highest since June 2007; the real yield on 30-year Treasuries has reached 3%, the highest since November 2008; and the prices of US tech corporate bonds have fallen to a two-year low.
Despite this, funds are still flowing into the fixed income market. Investment-grade bond funds have recorded net inflows for 16 consecutive weeks, with a net inflow of $5.9 billion that week; government and treasury bond funds have seen net inflows for four consecutive weeks, with a net inflow of $5.7 billion that week; inflation-protected securities (TIPS) have seen net inflows for 25 consecutive weeks.
The Bank of America report noted that globally, central banks have raised interest rates a total of 23 times since 2026, and Bank of America expects an additional 18 rate hikes within the year.
The market's implied probability of a rate hike during the Federal Reserve’s FOMC meeting on July 29 has risen to 38%, and the meeting on September 16 has fully priced in one rate hike. The report suggests that the tightening of financial conditions has had more impact on the market than corporate earnings, and the continued rise of long-end rates is a potential trigger for risk assets to de-leverage, while going long on the dollar is the best tool to hedge against the Federal Reserve's hawkish stance.
Gold and Cryptocurrency Quietly Build Bottoms, Commodities Lead the Year
In the alternative asset field, gold and cryptocurrency are quietly accumulating funds. Gold funds saw a net inflow of $2 billion that week, the largest single-week inflow since April 2026; cryptocurrency funds had a net inflow of $900 million, the largest single-week inflow in 11 weeks.
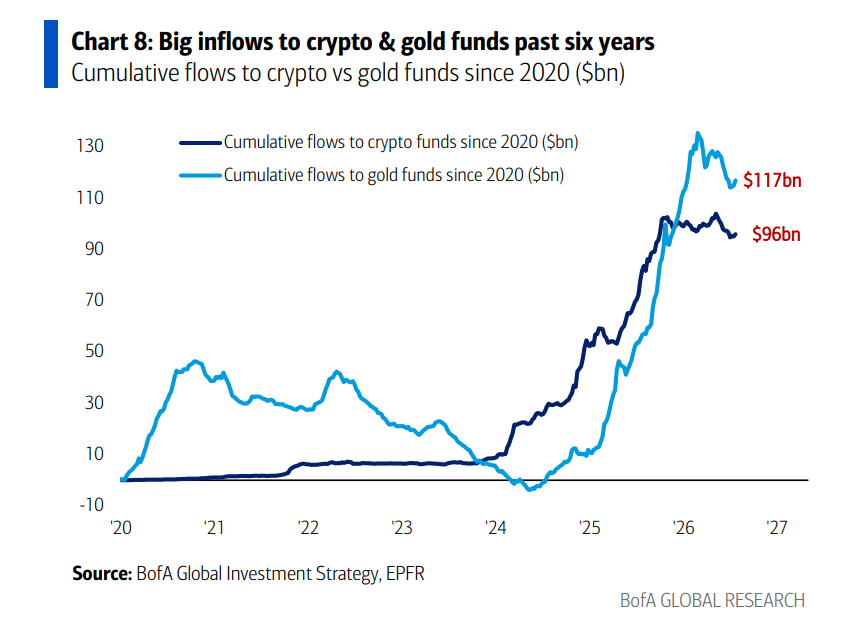
From the asset return rankings so far this year, commodities lead all major asset classes with a 57.7% increase, with Brent crude oil up 54.6%, WTI crude oil up 51.2%, and copper up 10.9%. In contrast, gold has fallen 4.4% year-to-date, and Bitcoin has dropped 24.8%.
Bank of America characterized the current trends of gold and Bitcoin as "building a bottom in 2026," providing an explanation from a macro structural perspective: the US government still maintains a fiscal deficit of about $2 trillion, paying about $1 trillion in interest every year, even though tariff revenues have reached $250 billion over the past 12 months; meanwhile, increasing stock supply (companies with negative free cash flow reducing buybacks) and expanding bond supply both provide long-term support for gold and Bitcoin.
The report suggests that in the latter half of the 2020s, bank stocks representing "main street" (BKX) will outperform brokerage stocks and private equity representing "Wall Street."
Private Clients Quietly Shift to Defense, Cash Falls to Historical Low
The asset allocation trends of Bank of America private clients are also noteworthy.
As of the latest data, Bank of America's private client assets under management total $4.5 trillion, with stocks accounting for 65.6%, bonds for 17.5%, and cash for 9.6%—the cash proportion has fallen to a historical low since May 2026.
In the past four weeks of ETF fund flows, private clients have been buying defensive assets such as municipal bonds, consumer staples, and healthcare while selling materials, low-volatility factors, and Japanese stocks. This shift in allocation starkly contrasts with institutional funds' massive inflows into tech stocks and emerging markets, reflecting the differing risk appetites of various types of investors in the current market environment.
Bank of America's Bull & Bear Indicator's sub-indicators show that hedge fund positions are at the 82nd percentile (extremely optimistic), stock fund flows are at the 96th percentile (extremely optimistic), and fund manager survey positions are at the 100th percentile (extremely optimistic). Bank of America noted that since 2002, there have been 17 sell signals triggered, with an average decline of 2% to 3% in the ACWI index over the following 2 to 3 months, with maximum drawdowns reaching 15% to 20%, and the signal's accuracy rate being about 60%.
免责声明:本文章仅代表作者个人观点,不代表本平台的立场和观点。本文章仅供信息分享,不构成对任何人的任何投资建议。用户与作者之间的任何争议,与本平台无关。如网页中刊载的文章或图片涉及侵权,请提供相关的权利证明和身份证明发送邮件到support@aicoin.com,本平台相关工作人员将会进行核查。


