Academician from the crypto circle: Is the current rebound of Ethereum (ETH) at 7.4 a trap or a reversal? Latest market analysis reference
The current price of Ethereum is 1732. I know many people have struggled during this wave of decline, watching the low point of 1500, feeling scared and hesitant to act. After finally rebounding, they don't know whether to hold on or not. Actually, there’s no need to panic; the market won’t move according to your worries. Right now, ETH has just crawled out of a pit; don’t fantasize about it shooting straight back to 2000 as soon as it rises. Focus on the current situation and the present market, and don’t predict the future.
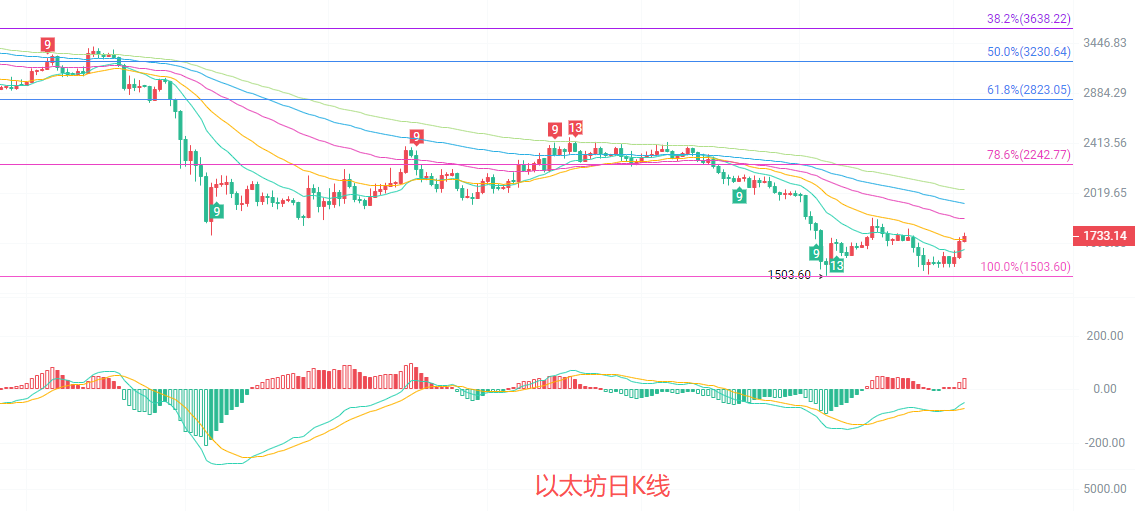
The daily K-line started to rebound from the earlier low point around 1503, just touching the 100% retracement level of the downtrend before stopping the decline and rising again. From the moving averages perspective, the price is still below the short and medium-term moving averages like EMA15 and EMA30, and the mid-term downtrend has not yet been completely reversed; however, the green bars of the MACD indicator are continuously shortening, and the DIF and DEA cross upward at a low position, indicating that the downward momentum is clearly waning. The lower Bollinger Band is forming support near 1520, and the current price is above the middle band at 1672. The short-term rebound momentum is being released, but still faces resistance from the 78.6% Fibonacci level at 2242.
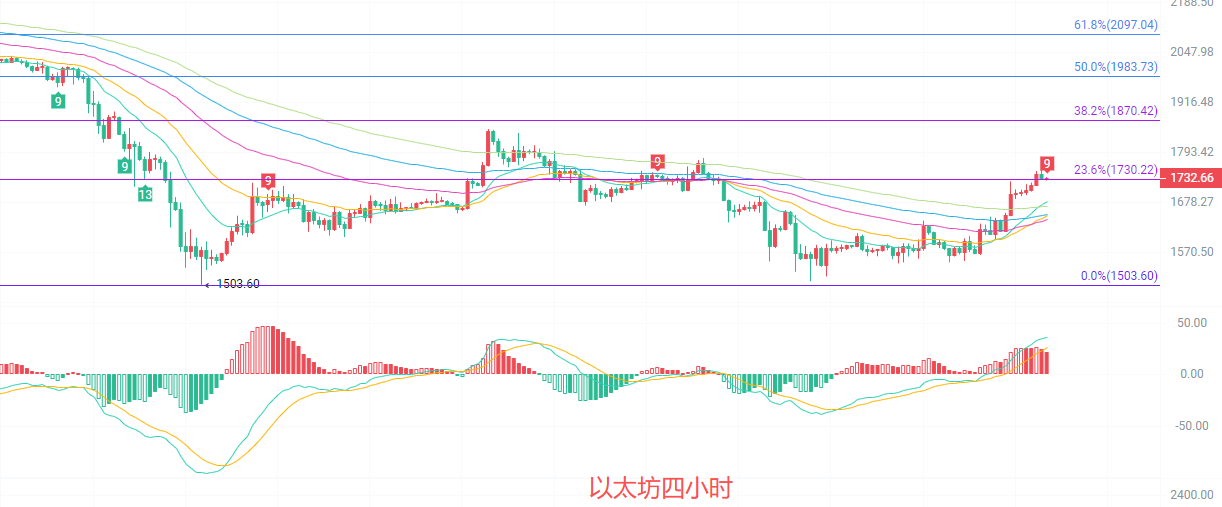
The four-hour K-line has just touched the 23.6% Fibonacci resistance level at 1730 of the downward wave segment, and is currently under short-term pressure. In terms of the moving average system, EMA15, 30, and 60 have formed a northern arrangement, and the price is stable above all short and medium-term moving averages, indicating a relatively healthy rebound trend; the MACD red bars continue to expand, with DIF and DEA moving upward in sync, indicating ample upward momentum. The Bollinger Band is opening upward, and the price is running close to the upper band, maintaining strong momentum in the short term; however, the KDJ indicator has entered an overbought zone, requiring caution against short-term pullback risks.
Short-term reference:
If it does not break below 1710 to 1690, it will go upward, stop loss at 1660, target looking at 1750 to 1800.
If it does not break above 1780 to 1800, it will go downward, stop loss at 1830, target looking at 1730 to 1690.
Specific operations should be based on real-time market data. For more information, you can consult the author. The article release is delayed; suggestions are for reference only, and risks are borne by the reader.

Kind reminder: The above content is solely created by the author of the public account. The advertisements at the end of the article and in the comment section are unrelated to the author. Please discern carefully, and thank you for reading.
免责声明:本文章仅代表作者个人观点,不代表本平台的立场和观点。本文章仅供信息分享,不构成对任何人的任何投资建议。用户与作者之间的任何争议,与本平台无关。如网页中刊载的文章或图片涉及侵权,请提供相关的权利证明和身份证明发送邮件到support@aicoin.com,本平台相关工作人员将会进行核查。