Scholar in the cryptocurrency industry: How do the high selling pressure and bottom support of 7.4 Bitcoin (BTC) compete? Latest market analysis and operational advice explained
The current price of Bitcoin is 62000. In trading, it's never about how advanced the technology is, but rather if the mindset is stable enough. Currently, the market is stagnant, and many people are anxious, either worried about missing out or fearing a sharp decline. The rebound space is limited, and the overall trend maintains a range-bound pattern, making it more suitable for short-term quick in-and-out trades. When operating, don't be greedy with target levels; take profits and exit promptly when reaching expected resistance levels, and don't cling to losses. If the market breaks key support levels, decisively stop-loss and exit to avoid holding onto losing trades. Many losses stem from a mindset of false hope.
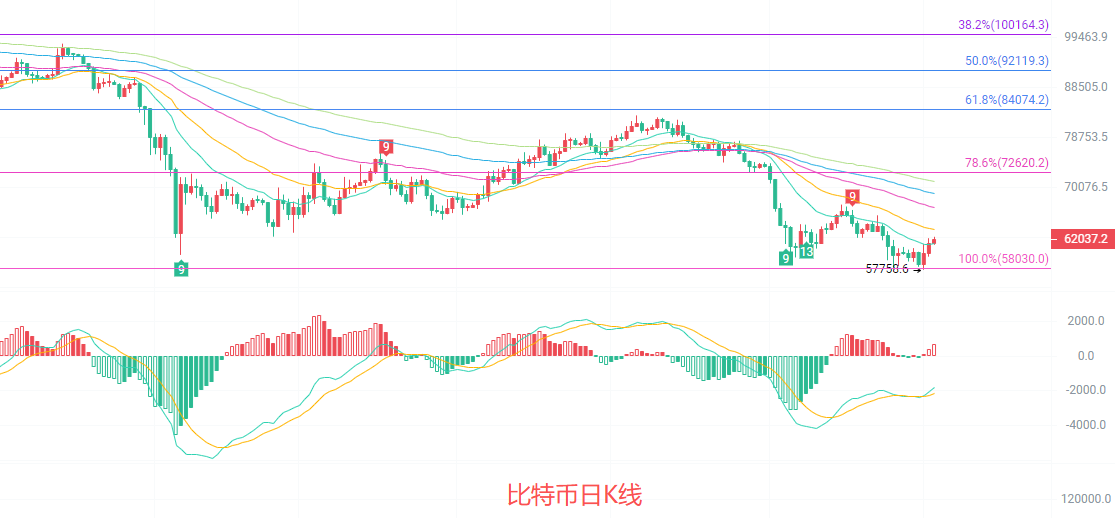
The daily K-line is currently in a weak rebound phase within a downward trend. The price is presently restricted by the EMA15 and EMA30 moving averages, with a key resistance level around 72600, which is the 78.6% Fibonacci retracement of the previous oscillation platform's lower bound. In the MACD indicator, the DIF is still below the DEA; while the histogram has shortened, the downward momentum has not completely vanished. The Bollinger Bands are in an overall downward channel; the price has just touched the middle line, and if it cannot effectively break through, it is likely to retest the support of the lower Bollinger Band. There hasn't yet been a clear reversal signal on the daily chart, and the main trend remains a bearish oscillation.
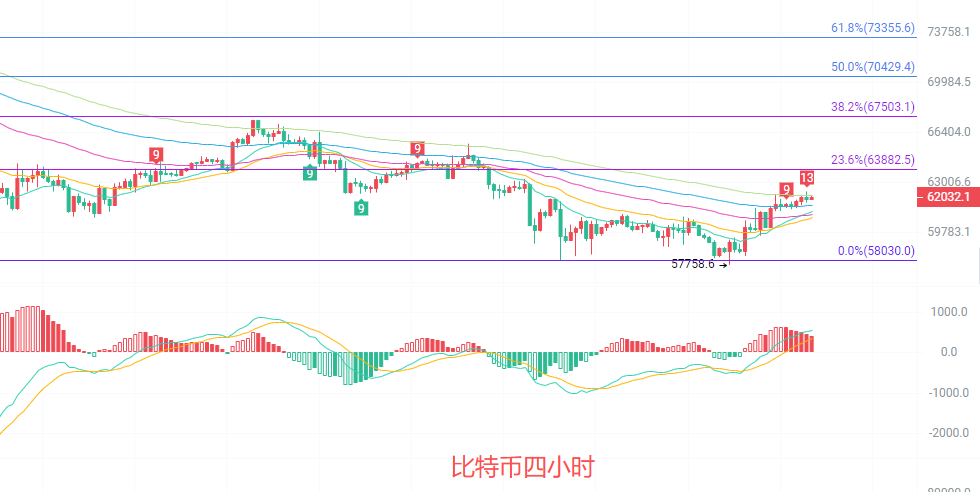
The four-hour K-line currently has the price above the EMA15 and EMA30 short-term moving averages, forming a short-term upward arrangement. The MACD indicator has triggered a golden cross, and the red momentum bars continue to expand, indicating strong short-term upward force. The middle line of the Bollinger Bands has turned upwards, and the price is running above the middle line with support around 60400. However, there is significant selling pressure at the 23.6% Fibonacci resistance level of 63882, and the medium-term EMA60 moving average still trends downwards, limiting the price's rebound potential. This rebound appears more like a repair of the downward trend rather than a trend reversal.
Short-term reference:
If the price does not break below 60600 to 60000, aim upwards, stop-loss at 59500, target at 62500 to 63500.
If the price does not break above 63500 to 64000, aim downwards, stop-loss at 64500, target at 62500 to 61500.
Specific operations should be based on real-time market data, and for more detailed information, please consult the author. The publication of this article may be delayed, and it is suggested for reference only, with risks borne by the reader.

Reminder: The above content is solely created by the author of the public account. The advertisements at the end of the article and in the comments section are unrelated to the author; please discern carefully. Thank you for reading.
免责声明:本文章仅代表作者个人观点,不代表本平台的立场和观点。本文章仅供信息分享,不构成对任何人的任何投资建议。用户与作者之间的任何争议,与本平台无关。如网页中刊载的文章或图片涉及侵权,请提供相关的权利证明和身份证明发送邮件到support@aicoin.com,本平台相关工作人员将会进行核查。