5.18ETH Chart Explanation
I. News Analysis (Core Events in the Last 24 Hours)
🔴 Bearish Factors
Expectation of Persistently High Interest Rates from the Federal Reserve
U.S. inflation data is stickier than expected, causing the market to further delay the first interest rate cut to 2027. The dollar index and U.S. Treasury yields are rising synchronously, and the high-interest-rate environment continues to suppress cryptocurrencies and other high-volatility risk assets, leaving Ethereum lacking any rebound momentum.
Panic Sentiment Spreading in the Market, Institutional Funds Accelerating Outflow
After Bitcoin fell below critical support, panic sentiment spread in the market, with Ethereum's spot ETF experiencing a net outflow of over 300 million dollars in a single day, and institutional funds rapidly withdrawing, increasing the selling pressure.
Bullish Factors
On-chain Large Addresses Showing Bottom-buying Signals
Several whale addresses on the Ethereum chain have been continuously accumulating near the 2100 dollar mark, indicating long-term capital's recognition of the bottom range, providing some support in the short term.
ETH Staking Data Stabilizing, Network Fundamentals Remain Stable
The staking amount and validator activity on the Beacon Chain remain steady, with no large-scale outflows from the network, and the fundamentals have not deteriorated, providing long-term emotional support for the price.
II. Technical Multi-Timeframe Analysis
4-Hour Level
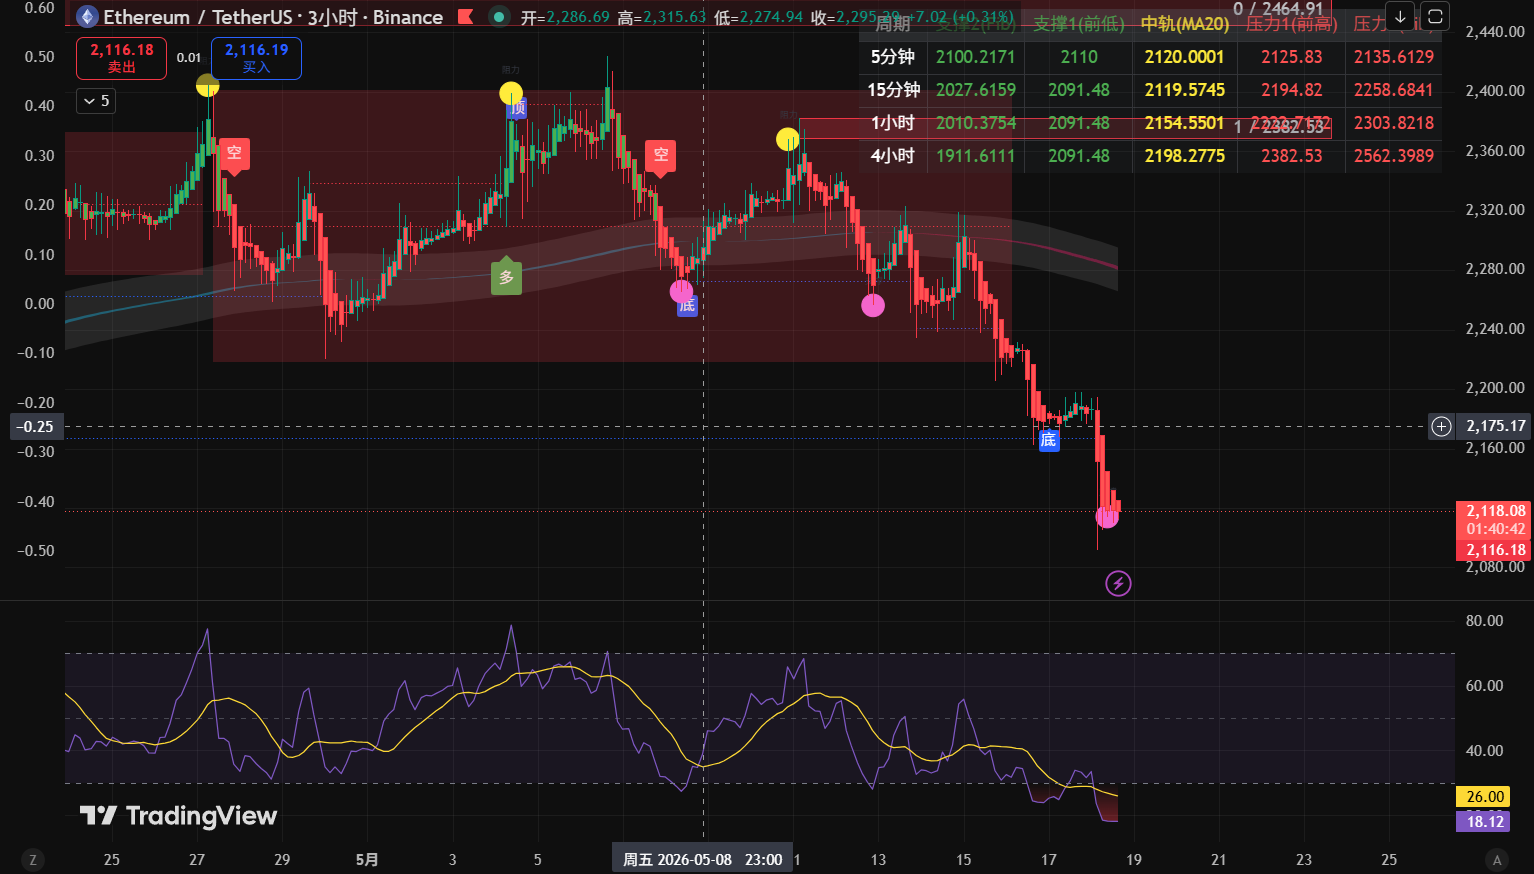
Price and Pattern: The current price is about 2112 dollars, having fallen below the previous critical support at 2220 dollars, entering a clearly defined descending channel, with the price continuously falling along the lower boundary of the channel, completely dominated by bearish trends.
Moving Average System: The price is running below the MA5/MA10/MA30/MA52 moving averages, which are in a standard bearish arrangement, and the short-term moving averages are continuously pressing down, forming strong resistance on the price.
Key Levels: Resistance at 2180-2200 dollars (previous platform + upper boundary of the descending channel), support at 2080 dollars (short-term support), and strong support at 2081 dollars (previous low).
Indicators: MACD bearish momentum continues to be released, with fast and slow lines running below the zero axis; RSI is approaching the oversold range but has not shown clear divergence signals, and there may still be continuation of the downward momentum.
30-Minute Level
Price and Pattern: The price is oscillating narrowly around 2110 dollars, forming a low position consolidation structure, with limited rebound height, and a clearly weak rhythm.
Indicators: The price is under pressure from the MA5/MA10 moving averages, MACD green bars are decreasing, RSI is located in the oversold range, and there is a possibility of a technical rebound repair in the short term, but the rebound height is limited, with strong resistance at 2150-2180 dollars above.
III. Operational Direction Recommendations
Table
Operational Direction | Key Price Levels (ETH/USDT) | Position Suggestions |
|---|---|---|
Short-term Short Position (Trend-following) | Entry: 2150-2180 dollars (when encountering resistance in rebound, touching moving average / upper boundary of the channel) Stop Loss: 2210 dollars (breaking the upper boundary of the 4-hour descending channel, signal of trend reversal) Take Profit: First target at 2100 dollars, second target at 2080 dollars (previous low support) | Total position 10%-15%, enter in batches, do not chase shorts |
Low-buy Long Position (contrarian trial and error) | Entry: 2080-2090 dollars (in the previous low support range, when a stop-loss K-line signal appears) Stop Loss: 2060 dollars (breaking previous low, support invalidation) Take Profit: First target at 2130 dollars, second target at 2160 dollars | Total position within 5%, light position trial and error, do not heavily bottom fish |
IV. Risk Warning
Extreme Market Risk: Panic sentiment in the market is spreading, and further accelerating declines cannot be ruled out, strict stop losses are needed to avoid emotional holding.
False Breakout Risk: The low position consolidation phase is prone to false rebound inducing buys; it is necessary to wait for clear stabilization signals before entering, to avoid being trapped by chasing highs.
Liquidity Risk: Increased volatility towards the end of the descending channel can lead to losses from chasing high and low in a fluctuating market; it is advisable to reduce frequent trading and patiently wait for key level signals.
The above article is provided by: Meridian Analysis. For more information about cryptocurrency and forex, scan the QR code to follow the public account and communicate with me. Articles may be delayed in sending, content is for reference only. I have many years of research experience in cryptocurrency and forex, welcome everyone to learn.
免责声明:本文章仅代表作者个人观点,不代表本平台的立场和观点。本文章仅供信息分享,不构成对任何人的任何投资建议。用户与作者之间的任何争议,与本平台无关。如网页中刊载的文章或图片涉及侵权,请提供相关的权利证明和身份证明发送邮件到support@aicoin.com,本平台相关工作人员将会进行核查。