Today's Sudden Handwritten Analysis
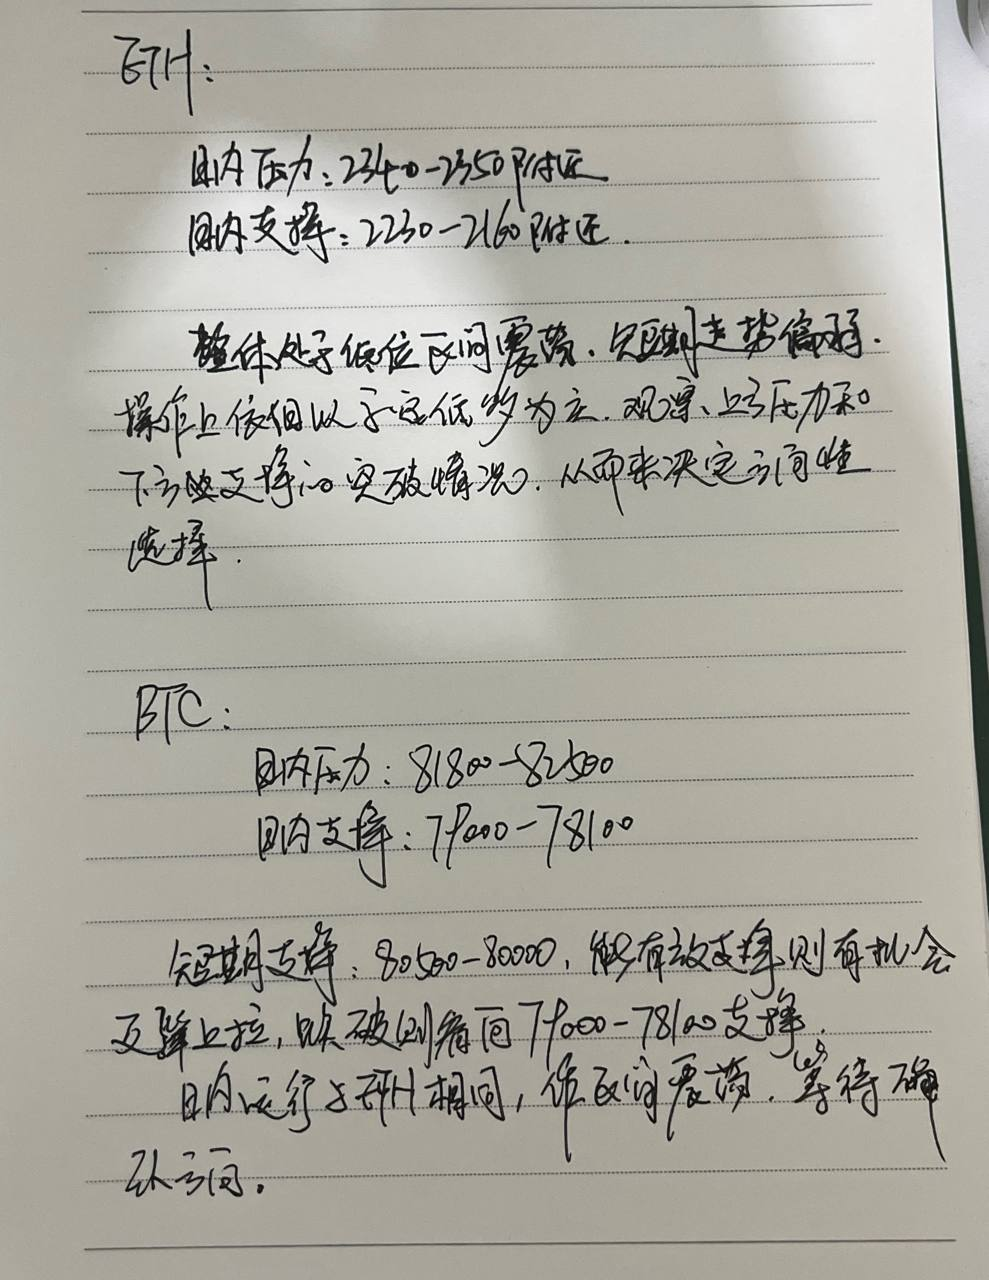
1. BTC Intraday Market Interpretation
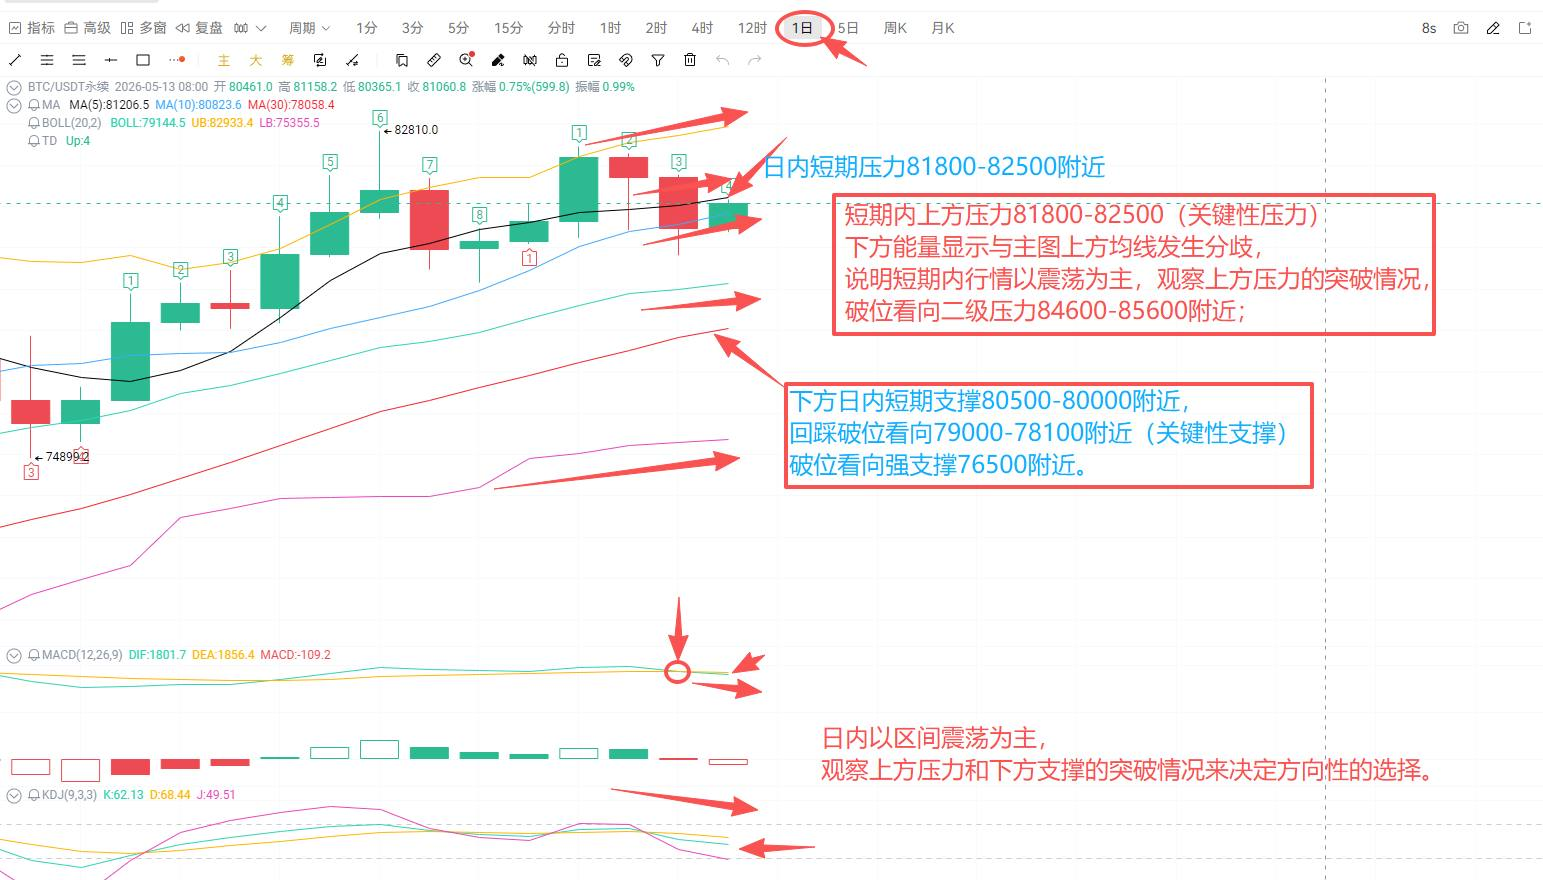
From the daily level, BTC is currently in a high range oscillation phase, with short-term bullish and bearish battles noticeably intensifying.
Key Intraday Resistance Level: Around 81800-82500, this is the core resistance zone for the short-term market. Only an effective breakout of this zone will allow bulls to open up space above, looking towards secondary resistance around 84600-85600.
Key Intraday Support Level: Around 80500-80000, if support can be held within this range, there remains a chance for the market to rebound and test resistance; if it breaks below, it will further probe key support around 79000-78100, with extreme scenarios looking at strong support around 76500.
From the indicators, the MACD and main chart moving averages show a certain divergence, indicating that the short-term market lacks clear unidirectional momentum and has strong oscillation characteristics. It is recommended to primarily focus on high-selling and low-buying within the range, paying close attention to the breakout situations of the upper resistance and lower support before making directional choices.
2. ETH Intraday Market Interpretation
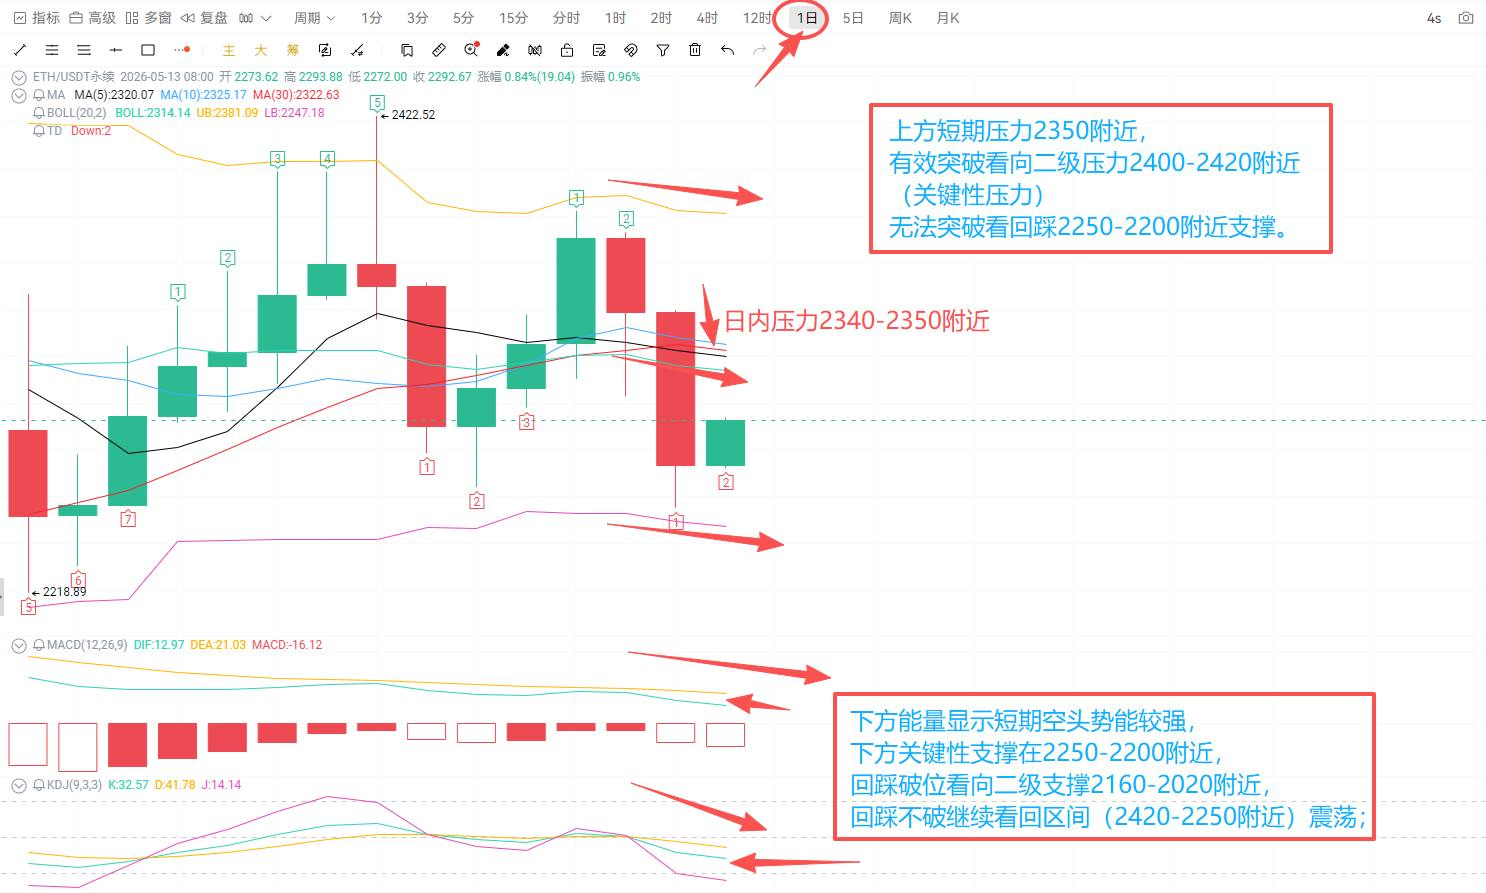
Compared to BTC, ETH's short-term bearish momentum is more apparent, staying in a low range oscillation overall, with a weak short-term trend.
Key Intraday Resistance Level: Around 2340-2350, with stronger resistance above at 2400-2420; only an effective breakout above 2350 will allow bulls to further test secondary resistance.
Key Intraday Support Level: Around 2250-2200, this is the core support zone for the short term; if it bounces back without breaking this zone, the market will likely maintain oscillation within the 2420-2250 range; if it breaks below, the next target will be secondary support around 2160-2020.
From the indicators, the MACD bearish momentum is still being released, and the KDJ indicator also shows a weak short-term pattern. It is similarly advised to focus on trading within the range, lightly positioning at low levels, waiting for effective breakouts of upper resistance or lower support before following the trend.
3. Overall Operational Strategy Summary
Whether BTC or ETH, they are currently in a consolidation preparation phase before directional choice, lacking clear unidirectional trend signals:
Core Strategy: High-sell low-buy within the range, follow the trend after breakouts, avoid blindly chasing increases or panicking during drop.
Key Observation Points: BTC's 80000/82500 and ETH's 2200/2350 are two key positions; once there is a significant breakout or breakdown, it will signal confirmation of direction.
Risk Control: In oscillating markets, it's crucial to maintain stop losses to avoid being swept out back and forth within the range, patiently waiting for clear trend signals to emerge.

免责声明:本文章仅代表作者个人观点,不代表本平台的立场和观点。本文章仅供信息分享,不构成对任何人的任何投资建议。用户与作者之间的任何争议,与本平台无关。如网页中刊载的文章或图片涉及侵权,请提供相关的权利证明和身份证明发送邮件到support@aicoin.com,本平台相关工作人员将会进行核查。