Hello everyone, I am Sister Qinglan! Welcome to the Qinglan Crypto Class. Today, we will use the TPV three-point verification trading system that I have polished for a long time to dissect the current Bitcoin market in detail. It's all practical content!
Step 1: First, look at the big direction (Multi-period trend overview)
Let's spread out the charts for four periods:
Daily line: The closing price is 71062.74, the price is below MA5 (71919.51), but MA5 is above MA10 (70778.00) and MA30 (69844.36), this is called "bullish arrangement" but the price is temporarily weak. The on-chain sentiment is "extreme fear," with an index of only 12, indicating that market sentiment is very panicked in the long term, which may suppress the rebound at the daily level.
4-hour line: The closing price is 71062.74, the price is near MA5 (71049.70), but far below MA10 (71809.51) and MA30 (71896.79), a typical "bearish arrangement." Fear sentiment also affects this period, making it difficult for a rebound.
1-hour line: The closing price is 71062.74, the price is entangled around MA5 (71050.62) and MA10 (71088.71) but below MA30 (71610.27), which is also a "bearish arrangement." Short-term sentiment and capital are very cautious.
15-minute line: The closing price is 71062.74, the price is in between MA5 (71106.60), MA10 (70962.53), and MA30 (71045.67), which is called "moving average intertwining," the direction is unclear, and it is oscillating in a small range.
In terms of news, "Trump blocks the Strait of Hormuz" and "US-Iran conflict" are core negative factors leading the price to break below 71000 dollars, resonating with the market's "extreme fear" sentiment.
Step 2: Find support points, draw key lines (effective highs and lows + trend lines)
Let’s find the recent key turning points for each period:
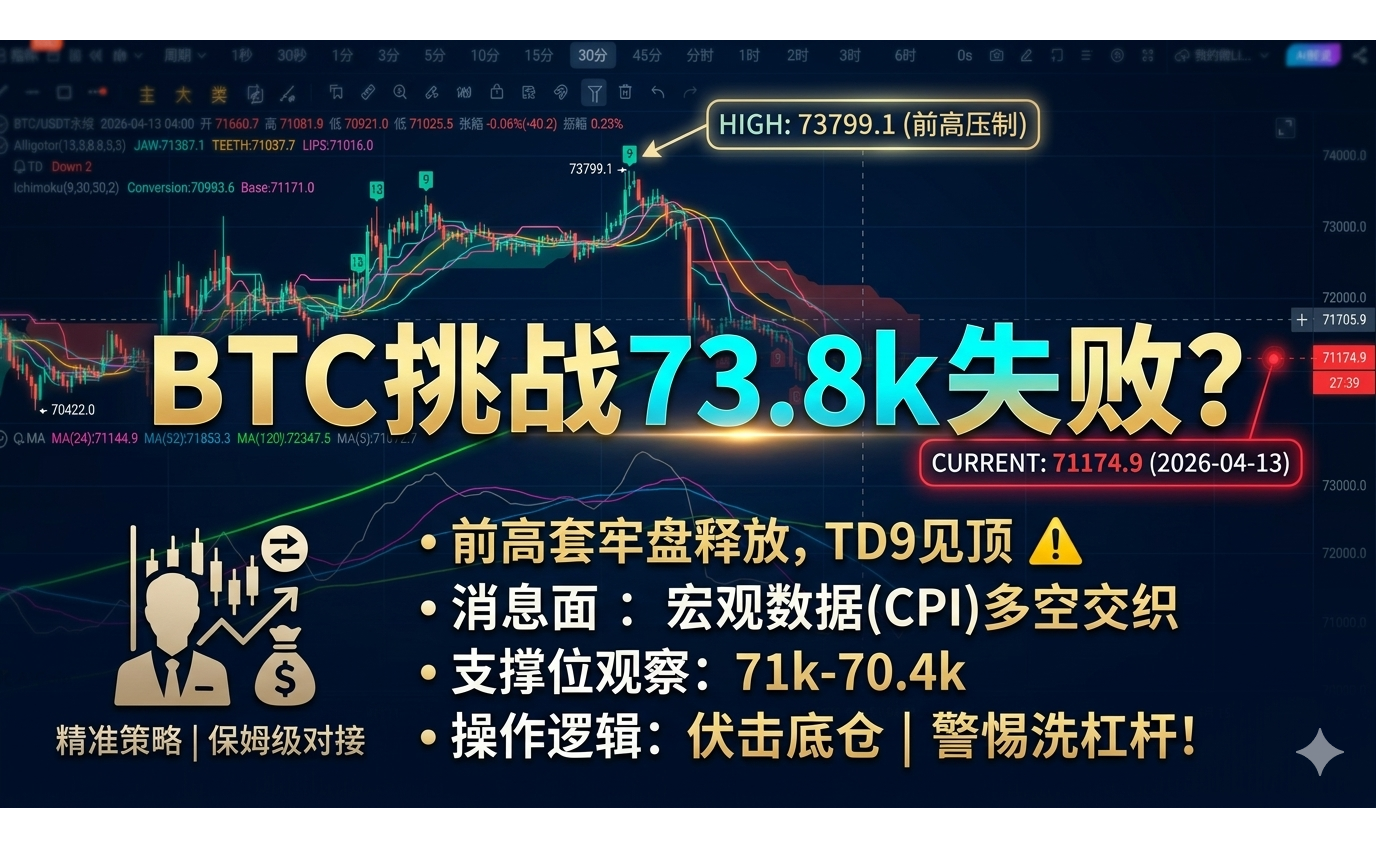
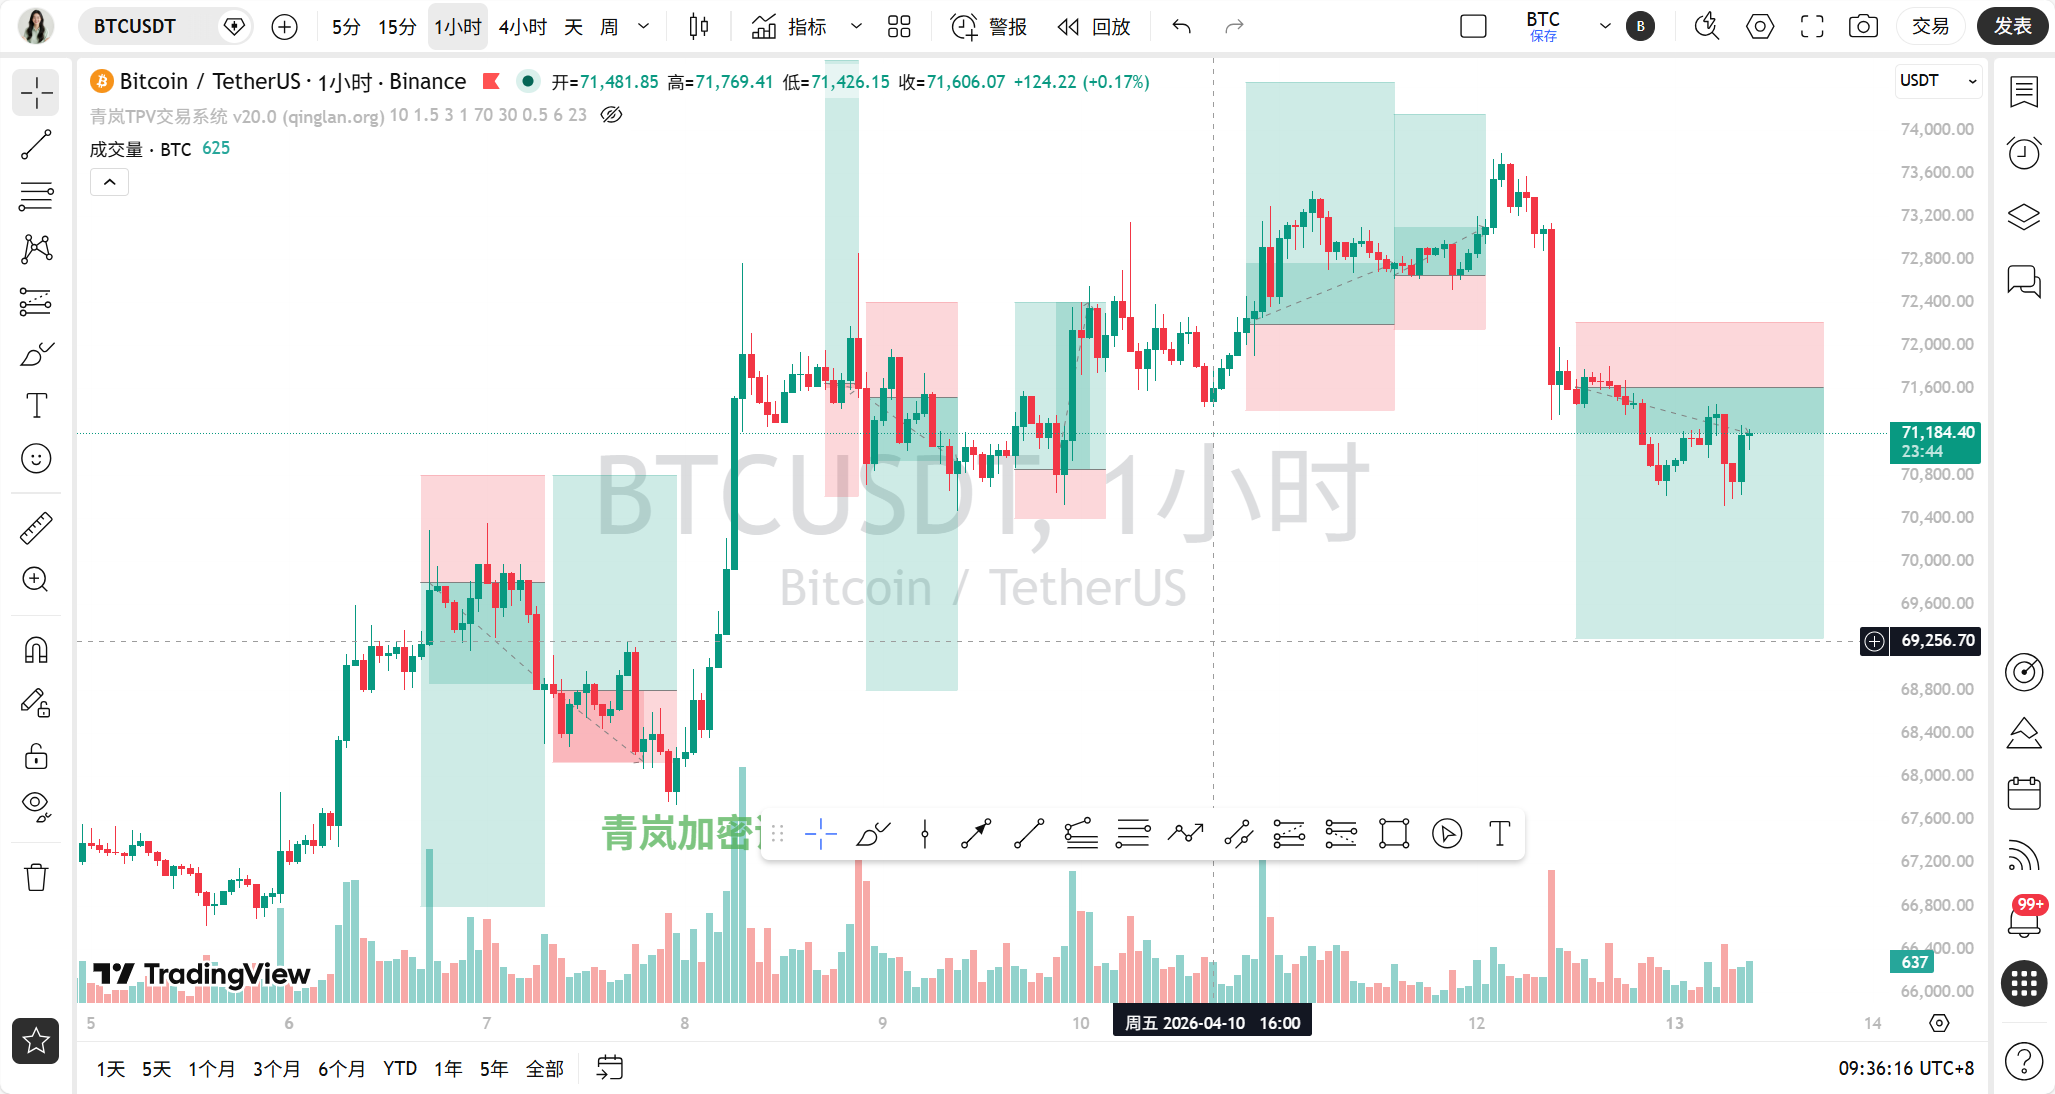
Daily line: The effective high point is at 73790.0 (around 04-12), and the effective low point is at 70505.88 (recent low). The high point was confirmed by subsequent declines, while the low point is still being tested.
4-hour line: The effective high point is at 73790.0, and the effective low point is at 70615.3. We can draw a descending trend line connecting the high point of 73790.0 and the recent second high, with the current price operating below this line.
1-hour line: The effective high point is at 73204.74, and the effective low point is at 70615.3. Similarly, the downward trend line is visibly suppressive.
15-minute line: The effective high point is at 71262.63, and the effective low point is at 70615.3, forming a small oscillating range.
When the news of "Trump blocks the Strait of Hormuz" came out, the price was just about to break below the critical support point of 71000 dollars, exacerbating the decline.
Step 3: Indicators assist (Technical indicators validation)
Let’s see what the indicators say:
Daily line: The MACD DIF is 712.84, DEA is 348.14, and the histogram is 364.70, with no crossover, but the bars are shortening, and the upward momentum is weakening. The RSI is 65.56, not considered overbought but not strong either.
4-hour line: The MACD DIF is 67.73, DEA is 405.19, histogram is -337.46, with a large negative value, strong bearish momentum, no golden cross. The RSI is 29.60, already entering the oversold zone! This is a signal worth noting.
1-hour line: The MACD DIF is -307.13, DEA is -355.10, histogram is 47.97, below the zero line, in a bearish pattern. The RSI is 42.24, weak.
15-minute line: The MACD DIF is -4.28, DEA is -35.99, histogram is 31.72, below zero but bars turned red, showing slight rebound signs. The RSI is 53.94, neutral.
Here is a small detail: The 4-hour RSI reached 29.6 in the oversold zone, but the price is still making new lows (close to 70615.3), which can be seen as a potential "bottom divergence" prototype, requiring the price to stop falling to confirm.
Step 4: Bull vs Bear struggle (News + On-chain)
News aspect:
Bearish factors (dominant): Escalation of the US-Iran conflict, Trump's threat to block the Strait of Hormuz, the market interpreting the ceasefire as a bearish signal, whales making substantial profits from shorting. The core is geopolitical risk, the fermentation period is now.
Bullish factors (sporadic): Michael Saylor advocates for long-term Bitcoin profits, ETH has rebounded. But the impact is far less than the bearish ones.
Conclusion: The bearish arrangement of the technical aspects and significant bearish news forms a strong resonance, with bears clearly in the advantage.On-chain data:
The fear and greed index is only 12, in "extreme fear," which is a strong bearish sentiment signal.
BTC dominance is 56.92%, data does not provide changes, but a high proportion indicates that funds may be leaning towards safe-haven assets.
The total market value is 2.5 trillion dollars, with a 24-hour change of -0.56%, indicating capital is flowing out.
Conclusion: The on-chain data (extreme fear, shrinking market value) and the technical decline are also resonating, confirming market weakness.
Step 5: The path of least resistance (Trading strategy)
In summary, the trends, news, and on-chain sentiment of all current periods point to a bearish market. The path of least resistance is still downward.
Key entry area (shorting): If there is a rebound near the 4-hour downward trend line (about 71500-71800 area, referencing the 1-hour high of 71805.85 and 4-hour MA10's 71809.51), or if the rebound is weak and breaks below the milestone of 71000.
Stop loss basis: Set above the key resistance, around 72000 (referencing the one-hour high of 72127.59).
Goal area: The first target is the previous low of 70615.3, if broken, it may test the psychological level of 70000.
Today's trading thought: Focus on shorting on rebounds, and be cautious about bottom fishing.
Step 6: How will it perform today (Market prediction)
Currently (within a few hours): Likely to weakly oscillate in the range of 70615.3 to 71500, digesting the negative news and oversold indicators.
Today's and recent key: The most important support level is 70615.3, if broken, the market will panic further. The most important resistance level is the 4-hour descending trend line (about 71500-71800) and 1-hour MA30 (71610.27).
Trading thought: The most suitable direction is "rebounds for shorting." Due to the triple suppression of trend, sentiment, and news, the risk of bottom fishing goes up significantly. The reason is that all three TPV points (trend, support point, validation) point towards the bearish side.
Summary: The core contradiction in the current market is the extreme panic sentiment under geopolitical black swan shocks, resonating with the technical downward trend.
Trading golden phrase: The strait blockade raises a thousand layers of waves in the market, and amidst the fear, one must grip the paddle of the trend tightly.
[Qinglan TPV trading system backtesting data]
Based on nearly 789 historical backtests, the accuracy rate is 70.6% (last backtesting time 04-13 07:00:01). Backtesting results are for strategy confidence reference only; past performance does not predict future returns.
[Qinglan's personal view]
Ah, seeing such an "extreme fear" index, Sister Qinglan also feels anxious for everyone. When the market is led by news, technical analysis may temporarily fail, but the TPV system helps us clearly see the ironclad fact that "the trend is on the bearish side." My insight is that during such times, do not rush to guess the bottom, and do not be deceived by the oversold RSI number to go ahead heavy on bottom fishing. Wait patiently for the bearish force to exhaust itself, and for the market to create a decent support point (such as no longer making new lows) before considering the next step. Remember, surviving allows you to dance in the bull market.
This TPV system is crafted from my years of watching the market, reviewing, and practical experience piece by piece. I can't say it's 100% accurate, but at least it can give us more confidence at key positions. If you want to receive the latest entry opportunities captured by me based on the TPV system in real time, welcome to the Qinglan Crypto Class official website www.qinglan.org
免责声明:本文章仅代表作者个人观点,不代表本平台的立场和观点。本文章仅供信息分享,不构成对任何人的任何投资建议。用户与作者之间的任何争议,与本平台无关。如网页中刊载的文章或图片涉及侵权,请提供相关的权利证明和身份证明发送邮件到support@aicoin.com,本平台相关工作人员将会进行核查。