Hello everyone, I am Sister Qinglan, welcome to the crypto class! Today we will use the TPV three-point verification system to take a good look at the latest market data and see where the opportunities and risks are hidden.
Step One: First, look at the big direction (multi-timeframe trend overview)
Let's organize the states of the four timeframes:
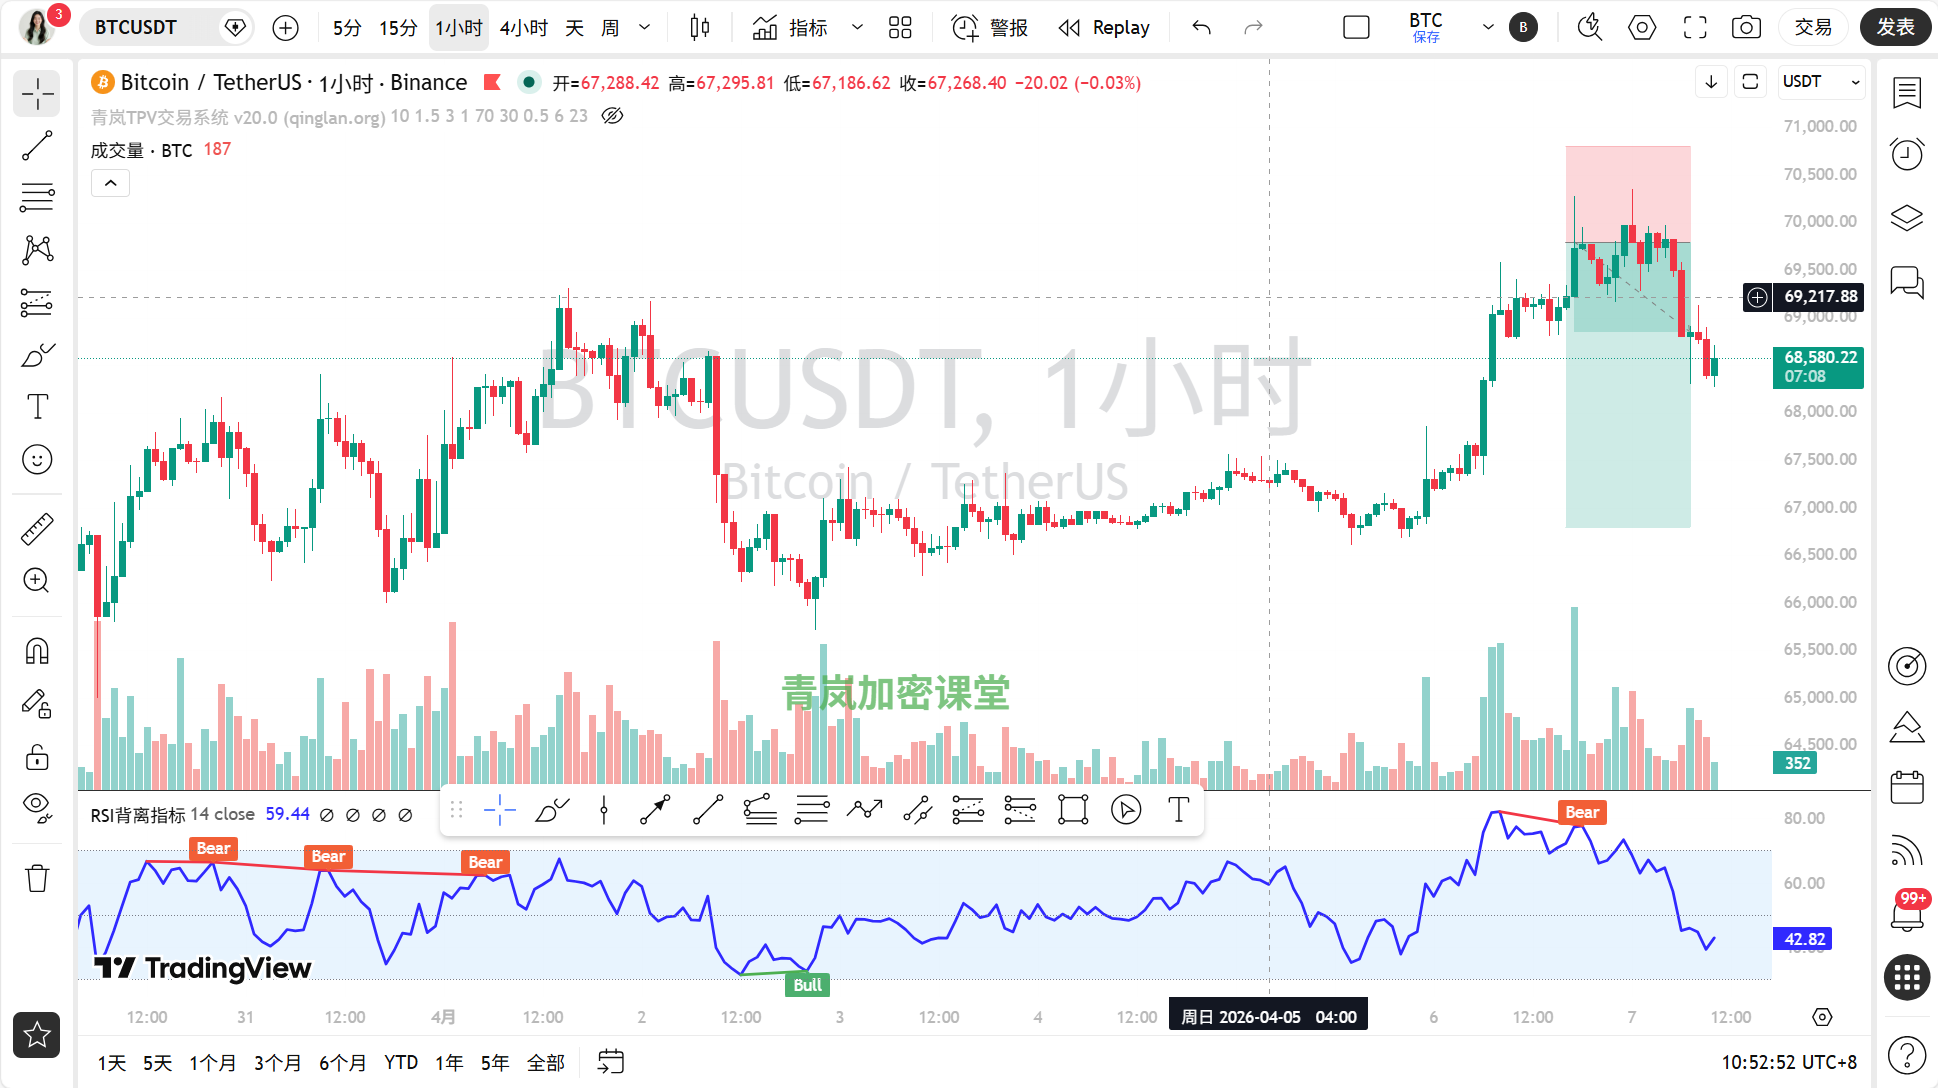
Daily timeframe: Closing price 68637.5. The moving average status is "moving averages intertwined", MA5 is 68158.01, MA10 is 67689.87, MA30 is 69421.09. The price is near the short-term moving averages, which indicates a stage of fluctuation in choosing a direction. On-chain sentiment is "extreme fear" (index 11), and this panic sentiment can easily put pressure on rebounds at the daily level.
4-hour timeframe: Closing price 68637.5. The moving average is "bullish arrangement", MA5 is 69362.89, MA10 is 68875.59, MA30 is 67596.56. The price has broken below MA5 and MA10 and is testing the strength of the bullish arrangement. News states "BTC retraced after breaking 70,000", which corresponds to this timeframe's decline from the high of 70283.32.
1-hour timeframe: Closing price 68637.5. The moving average is "bearish arrangement", MA5 is 68695.57, MA10 is 69201.20, MA30 is 69205.10. The price is below MA5, indicating a clear bearish trend. The total on-chain market value has decreased by 0.99% in 24 hours, resonating with the decline in the hourly chart.
15-minute timeframe: Closing price 68637.5. The moving average is "bearish arrangement", MA5 is 68533.48, MA10 is 68618.21, MA30 is 69101.97. The price is below the moving averages, indicating the weakest structural condition.
Step Two: Find pivot points, draw key lines (effective highs and lows + trend lines)
Let's find the key turning points for each timeframe:
Daily timeframe: Effective high at 69136.2 (from the 1-hour data series), effective low at 68273.34 (from the 4-hour data series). The price is currently between these two points.
4-hour: Recent effective high at 70283.32 (which was confirmed to decline by subsequent candlesticks), effective low at 68273.34 (currently testing). We can draw an upward trend line starting from the low point of 68273.34, which has been verified by touches.
1-hour: Effective high at 69128.2 (the news mentioned "Bitcoin dropped sharply after breaking 70,000", this high point is the starting point), effective low at 68273.34. This forms a descending channel, with clear resistance.
15-minute: Effective high at 68713.92, effective low at 68273.34. The fluctuation range is narrowing, searching for a breakout.
The news "Bitcoin whale adds long positions, limit order at 69574 USD" is close to a previous high in the 1-hour timeframe, indicating that whales are active at this technical price level.
Step Three: Indicators to assist (technical indicator verification)
Let's see what the indicators say:
15-minute: The MACD shows a golden cross, histogram 8.34, but the RSI is 53.92 neutral. The small timeframe has rebound momentum, but the strength is not strong.
1-hour: The MACD has no cross, histogram -211.52, RSI is 38.94 close to oversold. Bearish momentum is still being released, but approaching short-term oversold conditions.
4-hour: The MACD has no cross, histogram 139.87, RSI is 63.53 slightly strong. The long-term trend momentum is still favorable, consistent with the bullish arrangement of moving averages.
Daily timeframe: The MACD has no cross, histogram 74.19, RSI is 42.19 slightly weak. The daily level momentum is insufficient, in a weak consolidation phase.
There is a small divergence here: 4-hour RSI (63.53) is slightly strong, but the price has fallen from its highs, and caution is needed for weakening bullish momentum at the 4-hour level.
Step Four: Bull and bear arm wrestling (news + on-chain)
News:
Positive factors: "BTC strongly broke through the 70,000 USD barrier" (although it has pulled back), "The Coinbase Bitcoin premium index has turned positive", "The Bitcoin network's daily transaction volume has reached a nearly six-month high". The core is active on-chain activity and local capital in premium.
Negative factors: "Bitcoin sharply fell after breaking 70,000", "The US-Iran situation caused market turbulence", "The fear and greed index is in extreme fear". The core issue is that geopolitical conflicts have exacerbated market panic.
The technical and news aspects are somewhat at odds: the technical aspect on the 4-hour timeframe is still slightly bullish, but the panic and conflict in the news is bearish, forming a divergence.On-chain data:
Sentiment: The fear and greed index is only 11, indicating "extreme fear". This is a strong contrarian sentiment indicator.
Funding: BTC dominance is 56.59%, and there has been no significant outflow of capital from Bitcoin. Total market value is 2.426 trillion, down 0.99% in 24 hours, indicating a contraction adjustment.
The on-chain data and the short-term technical aspect (bearish on the 1-hour) resonate with each other, both leaning bearish; however, they are divergent from the long-term (bullish on the 4-hour).
Step Five: The path of least resistance (trading strategy)
Overall, there is a conflict between multiple timeframes; the long timeframe (4-hour) wants to rise, but the short timeframes (1-hour, 15-minute) and sentiment are dragging behind. Currently, the path of least resistance may be "fluctuating downward" or "range oscillation".
Key entry area: If shorting, focus on the rebound to the resistance area of the 1-hour moving averages around 68875-69128. If going long, it is necessary to wait for the price to stabilize above the key support level of 68273.34 on the 4-hour and show a stabilization signal.
Stop-loss basis: For short positions, set the stop loss above the key pivot high at 69128.2; for long positions, set the stop loss below the pivot low at 68273.34.
Target area: First look down at the 68273-68000 range; upwards, a breakthrough at 69128 is needed to see higher prices.
Step Six: How will it go today (market forecast)
Current (within a few hours): Most likely fluctuating within the range of 68273-68875, leaning towards weakness.
Key for today and in the near future: Today's most important support level is 68273.34, and if broken, it will turn weak in the short term. The most important resistance level is 69128.2; a breakthrough is needed to relieve the bearish pressure on the hourly chart. The 4-hour upward trend line (connecting low points) also needs to be closely monitored.
Trading thought: The most suitable approach right now is "mainly short, with support for longs." Due to the small timeframe's bearish arrangement + extreme panic in the market, the risk-reward ratio for shorting at the resistance level may be better. Going long requires patience to wait for clearer stabilization and signals of alleviating panic sentiment.
Summary: The current market's core contradiction lies in the pull between long-term technical support and short-term market panic sentiment.
Trading wisdom: The news is "talking while fighting", the market is "falling while bouncing", seek pivot points in fear, and protect principal in fluctuations.
[Personal Opinion of Qinglan]
Oh dear, this market looks really tangled, both sides are testing. Personally, I feel that the market is quite scared by the news, but the whales are secretly accumulating at critical prices, indicating that there are buyers below. Let's not be frightened by "extreme fear," but don't rush to catch the bottom. Wait until the hourly chart shows signs of stabilizing or clear signals of reversing the downward trend. Remember, in such a market, surviving is more important than how much is earned.
This TPV system is something I have refined over the years of monitoring, reviewing, and practical experience, and I can't say it's 100% accurate, but it can at least give us more confidence at critical positions. If you want to get the latest entry opportunities captured by my TPV system first, welcome to the Qinglan Crypto Class official website www.qinglan.org
免责声明:本文章仅代表作者个人观点,不代表本平台的立场和观点。本文章仅供信息分享,不构成对任何人的任何投资建议。用户与作者之间的任何争议,与本平台无关。如网页中刊载的文章或图片涉及侵权,请提供相关的权利证明和身份证明发送邮件到support@aicoin.com,本平台相关工作人员将会进行核查。