Welcome to the Qinglan Crypto Classroom, I am Sister Qinglan! Today we will use the TPV three-point verification trading system to break down the market and analyze it thoroughly, all practical and useful content!
Step 1: First, look at the overall direction (multi-timeframe trend overview)
Daily timeframe: Closing price 68866.0. Moving averages are intertwined (MA5=67813.38, MA10=67465.06, MA30=69332.62). The price is oscillating between moving averages, with pressure from the 30-day moving average above. On-chain sentiment is extremely fearful (index 13), which may suppress the daily level upward momentum.
4-hour timeframe: Closing price 68866.0. Bullish arrangement (MA5=67913.37, MA10=67550.60, MA30=67363.29). The price is above the moving averages, indicating a bullish trend. However, extreme fear in the market may bring adjustment pressure.
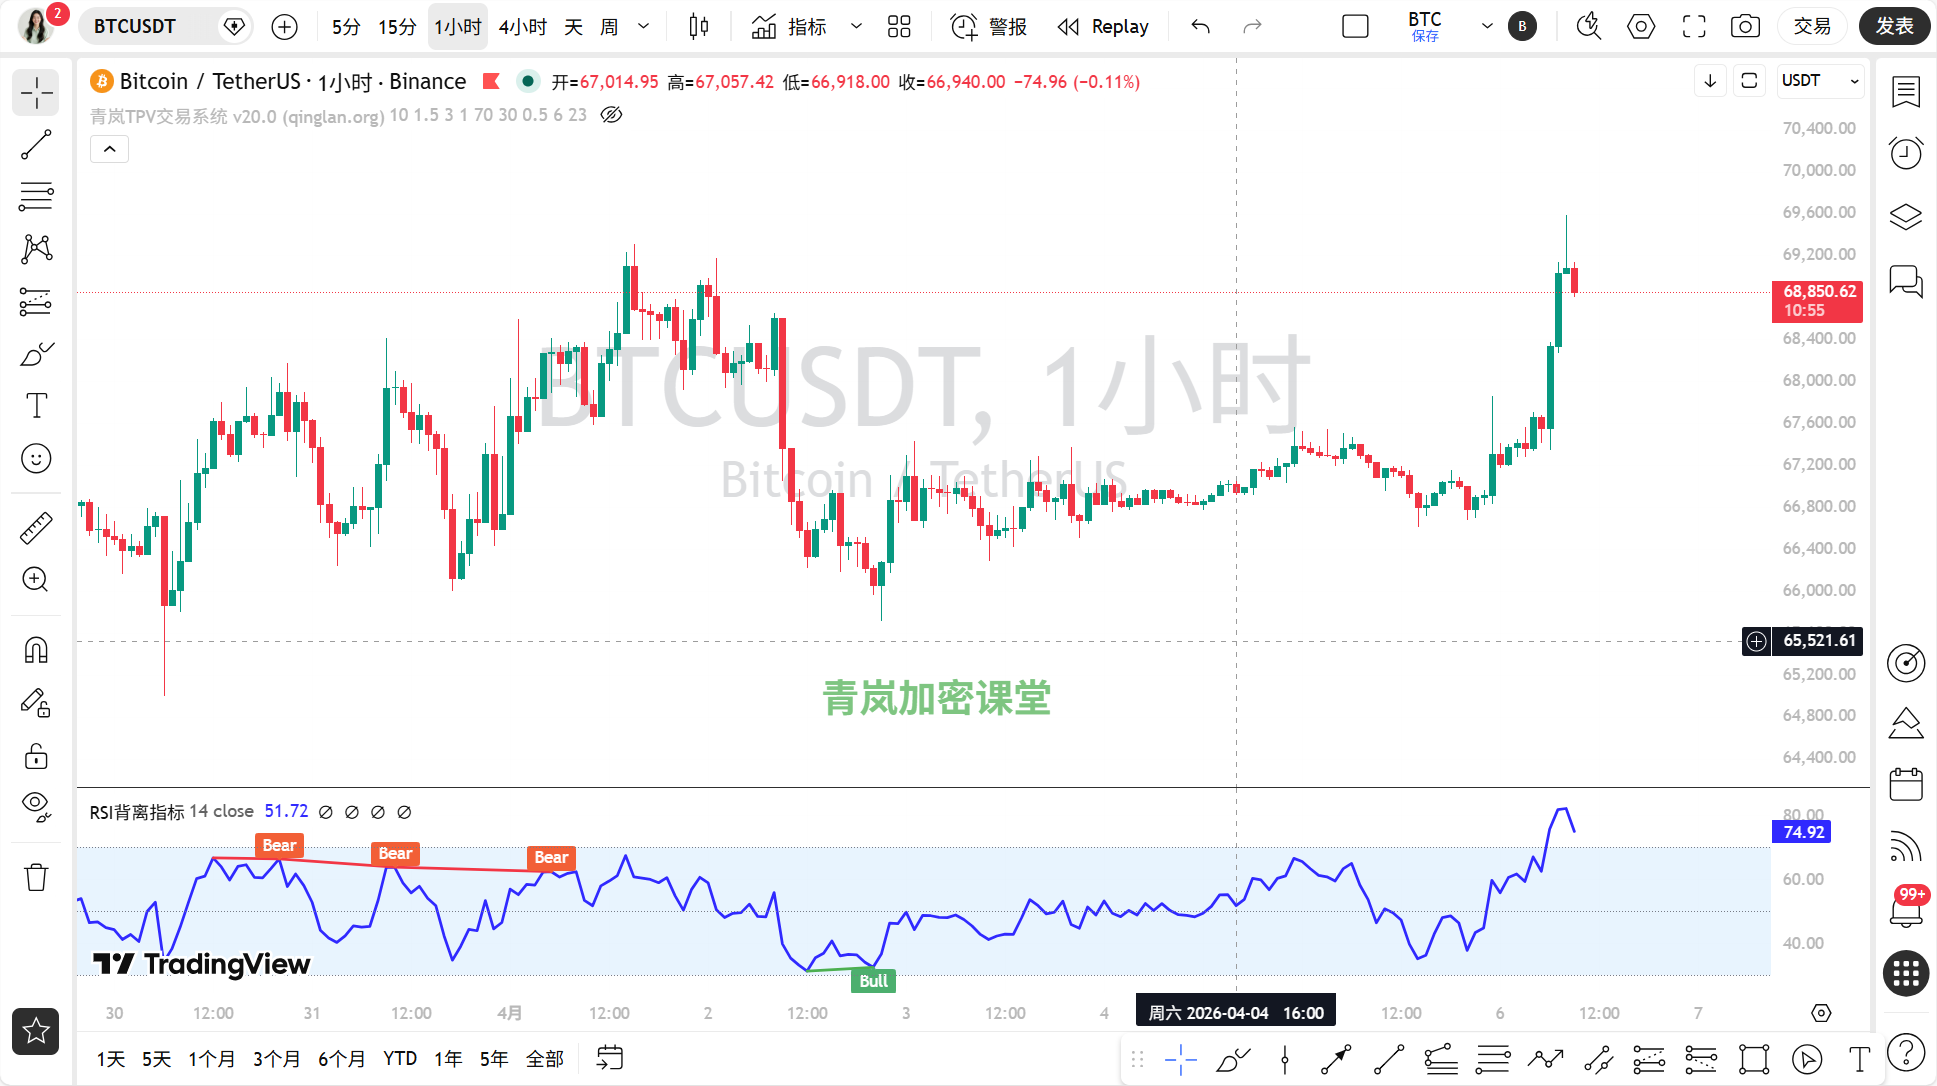
1-hour timeframe: Closing price 68866.0. Bullish arrangement (MA5=68575.16, MA10=67989.52, MA30=67380.59). The short-term trend is strongly upward. News reports "Bitcoin breaks through the $69,000 barrier", resonating with the short-term upward trend.
15-minute timeframe: Closing price 68866.0. Moving averages are intertwined (MA5=69020.47, MA10=69030.74, MA30=68066.25). The price is near the moving averages, in a short-term consolidation. Trading volume data is not provided, but the total market cap on-chain has changed by 2% in the last 24 hours, indicating some capital inflow.
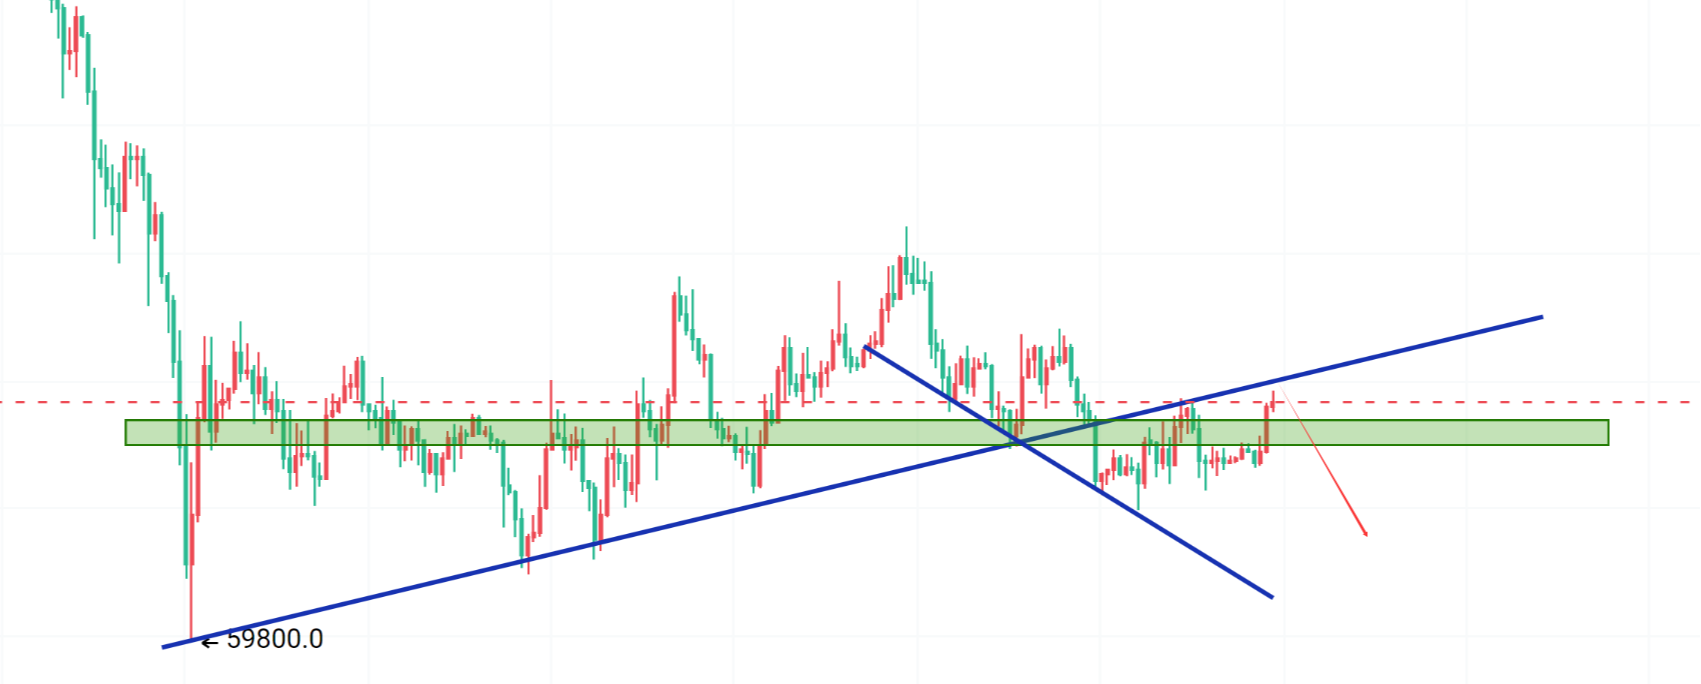
Step 2: Find pivot points, draw key lines (valid highs and lows + trend lines)
Daily valid high: 69588.0 (from the latest value of the 1d highest price sequence). Valid low: 68834.2 (from the latest value of the 1d lowest price sequence). The low has just formed, and its validity is yet to be observed.
4-hour valid high: 69588.0 (from the latest value of the 4h highest price sequence). Valid low: 68834.2 (from the latest value of the 4h lowest price sequence). Similarly, the low has just formed.
1-hour valid high: 69588.0 (from the latest value of the 1h highest price sequence). Valid low: 68834.2 (from the latest value of the 1h lowest price sequence). A short-term support line can be drawn from the low upwards.
15-minute valid high: 68985.21 (from the latest value of the 15m highest price sequence). Valid low: 68838.01 (from the latest value of the 15m lowest price sequence). The price fluctuates within a small range.
The news "Bitcoin breaks through $69,000" is related to the recent high, providing psychological resistance levels.
Step 3: Indicators to assist (technical indicators validation)
Daily MACD: Golden cross (DIF=-437.90, DEA=-467.33, histogram=29.43). However, both lines are below the zero axis, and the strength of the golden cross is yet to be observed. RSI=41.78, in the neutral but slightly weak area, not oversold. Validates the daily oscillation pattern.
4-hour MACD: No cross (DIF=224.12, DEA=12.15, histogram=211.97). The momentum histogram is positive, indicating upward momentum. RSI=76.54, close to overbought, indicating short-term adjustment risk. Validates the upward trend but needs to be wary of adjustments.
1-hour MACD: No cross (DIF=429.12, DEA=218.98, histogram=210.14). Strong momentum. RSI=78.84, has entered the overbought area, increasing adjustment pressure. Validates strength but overheated.
15-minute MACD: No cross (DIF=431.73, DEA=418.50, histogram=13.23). Weak momentum. RSI=73.88, close to overbought. Validates short-term consolidation and possible lack of strength.
No significant divergence has been found at present.
Step 4: Bull and bear arm wrestling (news + on-chain)
News:
Bullish: Bitcoin breaks through the $69,000 barrier; Charles Schwab will launch spot trading; corporations significantly increased holdings in Q1; Saylor supports and plans to increase holdings.
Bearish: Market extremely fearful (on-chain data); geopolitical risks (US-Iran conflict); large-scale token unlocking; huge whales selling ETH, etc.
Core factors: The market's extreme fear sentiment (index 13) diverges significantly from the strong technical aspect of price breaking through $69,000. This is the current core contradiction.On-chain data:
Fear and Greed Index 13, extremely fearful, indicates that market sentiment is extremely pessimistic.
BTC dominance is 56.53%, no data provided on changes, indicating Bitcoin's dominance in the market.
Total market cap is 2.438 trillion, with a 24-hour change of +2%, indicating a slight overall rise in the market.
Technical and on-chain sentiment data show significant divergence: price strengthens, but sentiment is extremely fearful.
Step 5: The route of least resistance (trading strategy)
Overall, the short-term (1 hour, 4 hours) technical aspect is showing a bullish arrangement and price has set new highs, but the daily oscillation and market sentiment being extremely fearful, create divergence. The path of least resistance may be to first pull back to release overbought pressure, and then determine the direction based on whether sentiment improves.
Key entry area: Wait for a pullback to near the hourly moving average support, such as the 1-hour MA10 (67989.52) or MA30 (67380.59) area.
Stop-loss basis: If the price falls below the recent valid low of 68834.2 and confirms, be wary of a weakening trend.
Target area: Look upwards to the previous high of 69588.0, and if broken, look for higher levels.
Step 6: How will it go today (market prediction)
Current (within a few hours): Highly likely to oscillate between 68834.2 and 69588.0 at high levels, or even slightly pull back, as the short timeframe RSI is overbought.
Today's and recent key points: The most important support level is 68834.2 (today's low), if broken, it will trend weaker in the short term. The most important resistance level is 69588.0 (previous high), if broken, it will open up space.
Trading thought process: The most suitable direction to trade right now is—wait for a pullback before going long. This is because the longer-term trend (4h, 1h) remains in a bullish arrangement, but the shorter timeframes are overbought and sentiment diverges, directly chasing higher carries significant risks. Wait for the price to pull back to key support (like near 1-hour MA30 at 67380.59) and stabilize before considering a long position.
Summary: The current core contradiction in the market is the strong price versus the extremely fearful sentiment.
Trading golden phrase: Breaking through in fear is exactly the touchstone to test the quality of the trend; just like in the news where Saylor fights back at Schiff, time will prove who is mainstream.
[Qinglan's Personal View]
Oh dear, this market is quite twisted, the price is rising while everyone is scared to death. Personally, I feel that this divergence will not last long; either sentiment will recover and rise with it, or sentiment will drag the price down. Let's not rush to chase the price, patiently wait for a decent pullback, and see if there are signs of improvement in market sentiment, that way trading will feel more solid. Remember, we need to stay clear-headed when others are fearful, but it doesn't mean we rush in blindly.
This TPV system is something I have refined over the years of monitoring, reviewing, and practical trading, I can't say it's 100% accurate, but it can at least help us be more confident at critical positions. If you want to get the latest entry opportunities I capture using the TPV system first-hand, welcome to the Qinglan Crypto Classroom official website www.qinglan.org
免责声明:本文章仅代表作者个人观点,不代表本平台的立场和观点。本文章仅供信息分享,不构成对任何人的任何投资建议。用户与作者之间的任何争议,与本平台无关。如网页中刊载的文章或图片涉及侵权,请提供相关的权利证明和身份证明发送邮件到support@aicoin.com,本平台相关工作人员将会进行核查。