Charts
DataOn-chain
VIP
Market Cap
API
Rankings
CoinOSNew
CoinClaw🦞
Language
  • 简体中文
  • 繁体中文
  • English
Leader in global market data applications, committed to providing valuable information more efficiently.

Features

  • Real-time Data
  • Special Features
  • AI Grid

Services

  • News
  • Open Data(API)
  • Institutional Services

Downloads

  • Desktop
  • Android
  • iOS

Contact Us

  • Chat Room
  • Business Email
  • Official Email
  • Official Verification

Join Community

  • Telegram
  • Twitter
  • Discord

© Copyright 2013-2026. All rights reserved.

简体繁體English
|Legacy

Sometimes looking at this kind of data is really frustrating.

CN
Phyrex
Follow
20 hours ago
AI summarizes in 5 seconds.

Sometimes looking at this kind of data really makes people angry. It's not that the data is wrong; the data is correct. Indeed, the holdings of #BTC in the range of 1,000 to 10,000 have decreased over the past year. But this does not mean that the largest buyers in the market have turned into sellers.

This is absolutely incorrect, because within this range there could be institutional accounts, exchange accounts, custodial accounts, or even wallet reorganizations by exchanges. More should be viewed from a higher dimension.

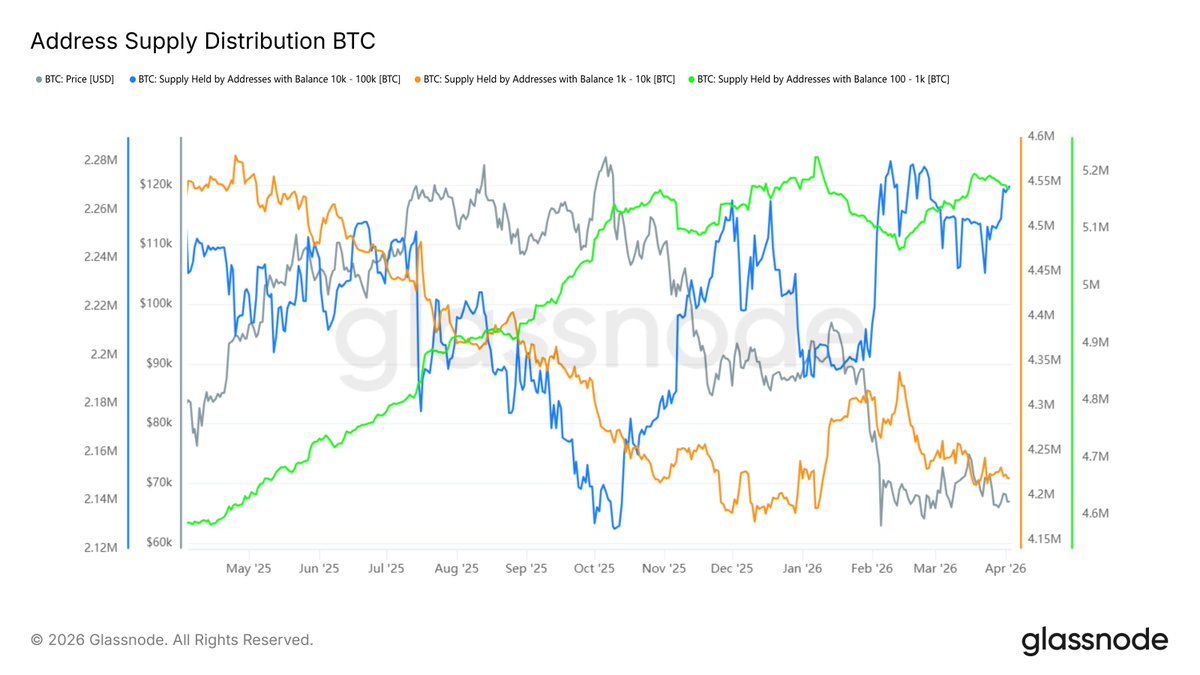
For example, in the chart I used, the yellow line represents Bitcoin addresses holding between 1,000 and 10,000 coins, which is decreasing. However, the blue line represents BTC holdings between 10,000 and 100,000 coins, and this portion of addresses has seen an increase in holdings over the past year.

Additionally, the largest holdings are represented by the green line, which shows addresses holding between 100 and 1,000 BTC. This portion's holdings have been steadily increasing. Therefore, looking at just one line and concluding that it’s the whales selling off is simply being mischievous!


免责声明:本文章仅代表作者个人观点,不代表本平台的立场和观点。本文章仅供信息分享,不构成对任何人的任何投资建议。用户与作者之间的任何争议,与本平台无关。如网页中刊载的文章或图片涉及侵权,请提供相关的权利证明和身份证明发送邮件到support@aicoin.com,本平台相关工作人员将会进行核查。

别等反弹空手看!领$10000捡漏
广告
|
|
APP
Windows
Mac
Share To

X

Telegram

Facebook

Reddit

CopyLink

|
|
APP
Windows
Mac
Share To

X

Telegram

Facebook

Reddit

CopyLink

Selected Articles by Phyrex

4 minutes ago
This statement is consistent with the bullish and bearish judgment given by GlassNode's NUPL data.
42 minutes ago
I think this friend's private message question is very representative.
4 hours ago
I felt quite conflicted when I saw this kind of tweet.
View More

Table of Contents

|
|
APP
Windows
Mac
Share To

X

Telegram

Facebook

Reddit

CopyLink

Related Articles

avatar
avatarPhyrex
4 minutes ago
This statement is consistent with the bullish and bearish judgment given by GlassNode's NUPL data.
avatar
avatarPhyrex
42 minutes ago
I think this friend's private message question is very representative.
avatar
avatarPhyrex
4 hours ago
I felt quite conflicted when I saw this kind of tweet.
avatar
avatarPhyrex
5 hours ago
I actually think that.
avatar
avatarPhyrex
5 hours ago
In fact, data is this thing.
APP
Windows
Mac

X

Telegram

Facebook

Reddit

CopyLink