On March 1, 2026, the global macro market experienced an epic "black swan" event: the direct military strike by the United States and Israel against Iran resulted in the death of Iran's Supreme Leader Khamenei.
This extreme tail risk event instantly reshaped the risk premium model for global asset classes. The complete detonation of the Middle East powder keg not only caused traditional oil and safe-haven assets to fluctuate sharply, but also pushed the cryptocurrency market, which is at a critical game-theoretic juncture, to the crossroads of liquidity and pricing power.
Combining Binance's spot market and Deribit options data, this analysis deeply examines the immediate impact of this geopolitical crisis on the cryptocurrency market from the perspective of quantitative and derivative gaming, as well as forecasts future volatility paths and market directions.
The essence of geopolitical conflict lies in the reshaping of global supply chains, energy prices, and the resulting inflation expectations. The recent U.S.-Israeli raid on Iran triggered a textbook-level risk aversion model in the financial market: commodities such as crude oil and gold became the preferred safe havens, while high-risk assets faced indiscriminate sell-offs at the first instance.
The outbreak of high-intensity conflict in the Middle East immediately impacted global energy supply chains and fiat currency credit systems, causing a wave of risk aversion. In traditional financial markets, Brent crude oil was likely to open sharply higher due to panic over supply disruptions, and traditional safe-haven assets like gold would see intensively built positions from institutional capital. However, in the realm of crypto assets, the "digital gold" narrative of BTC and its "high-elastic risk asset" properties are experiencing severe internal conflict.
From the perspective of macro liquidity, the panic induced by geopolitical factors (as shown by a spike in the VIX index) usually triggers an indiscriminate sell-off across assets to exchange for U.S. dollar liquidity. Yet, after a brief liquidity squeeze, Bitcoin—uncontrolled by any specific sovereign nation, with its anti-censorship and portability attributes—often absorbs some of the capital fleeing from high-risk emerging market fiat currencies.
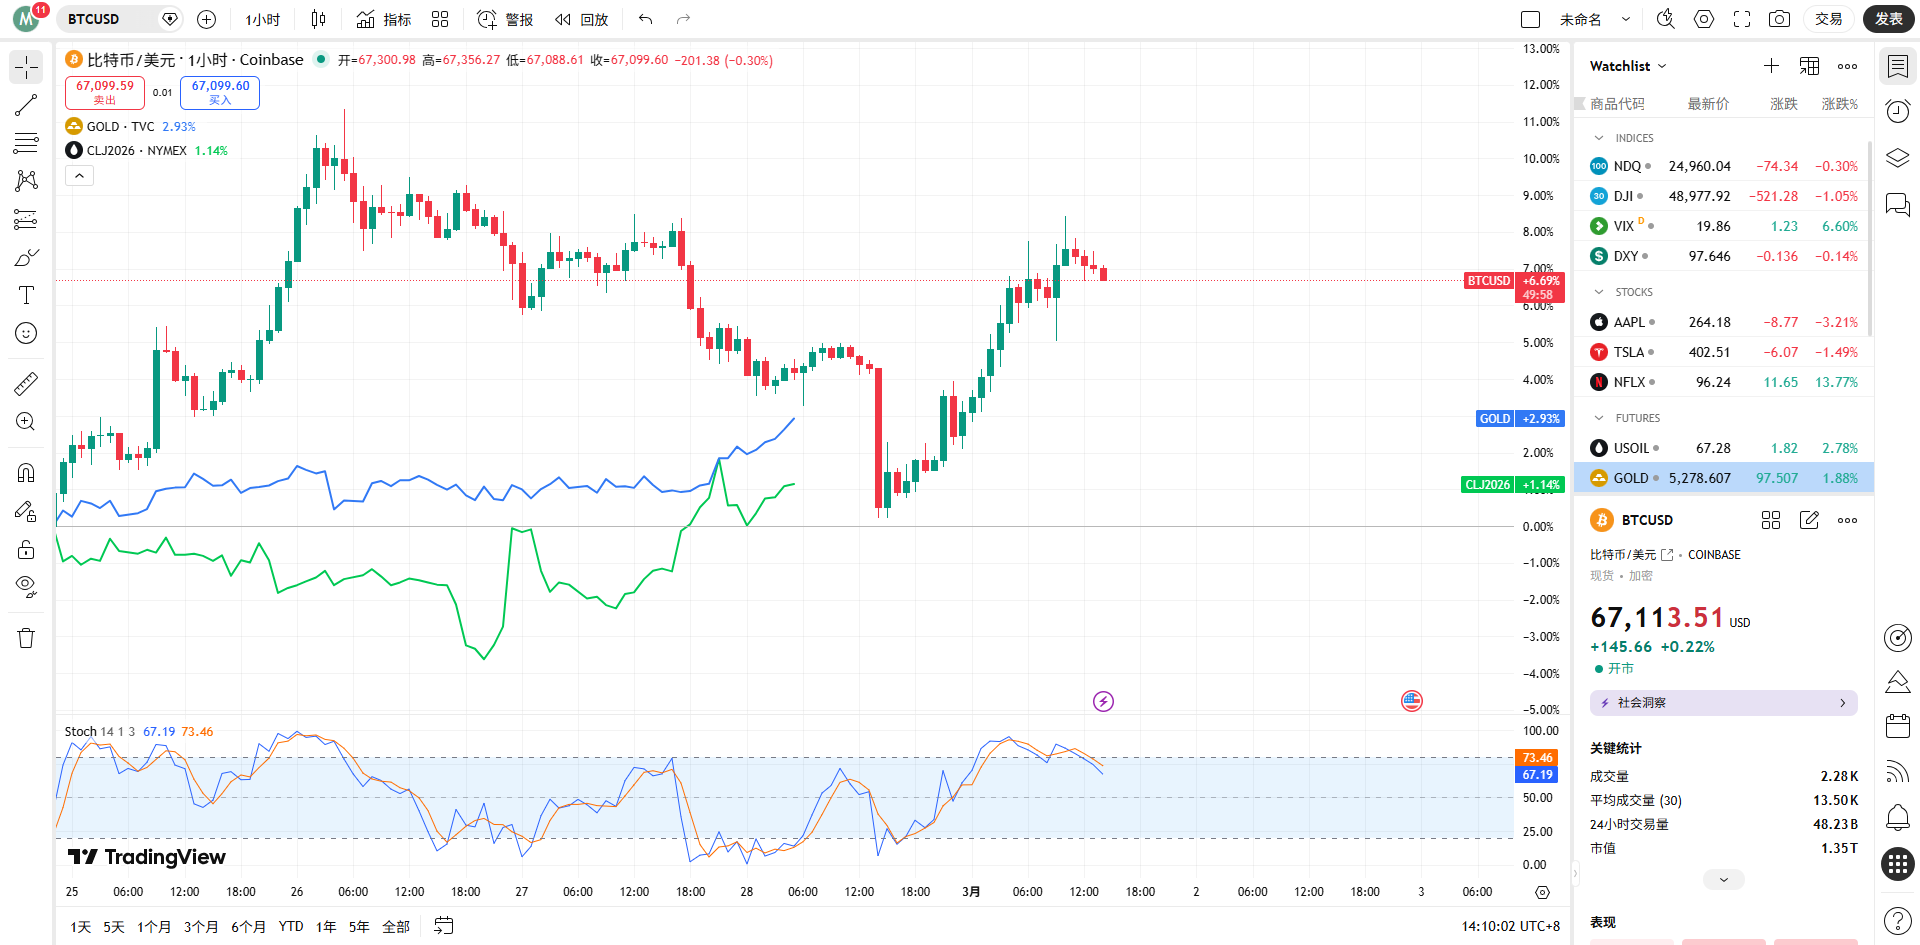
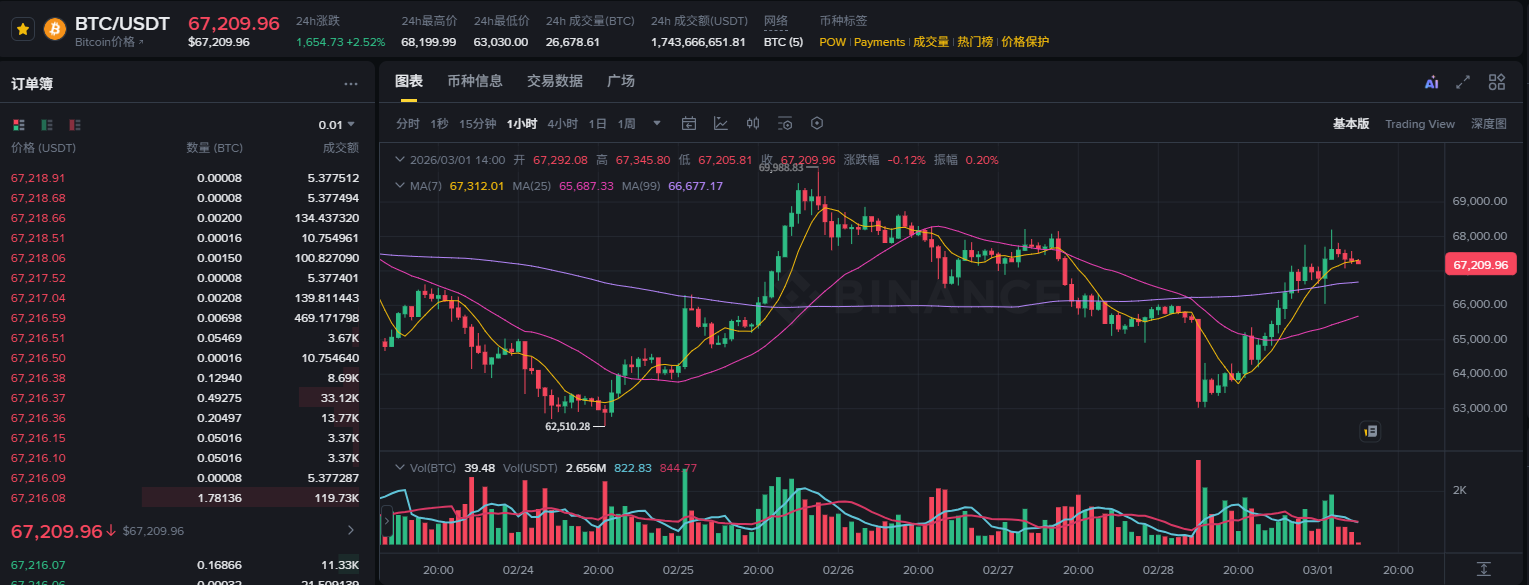
As of 2 PM on March 1, 2026, combining Binance's spot and futures market data, the current BTC/USDT price oscillated around $67,392. At the onset of such a significant geopolitical crisis, BTC did not plunge like in the "312" incident of 2020, but rather held steadfast at the critical support level of $67,000.
The trading volume over the past 24 hours reached $1.74 billion, indicating huge divergence and turnover between bulls and bears at this position. The moving average system in the price chart shows a high-level oscillating pattern following a bullish arrangement, demonstrating that despite the shock from breaking news, the buy-side strength in the spot market remains exceptionally robust, and institutional capital's long-term base allocation has not fundamentally shifted.
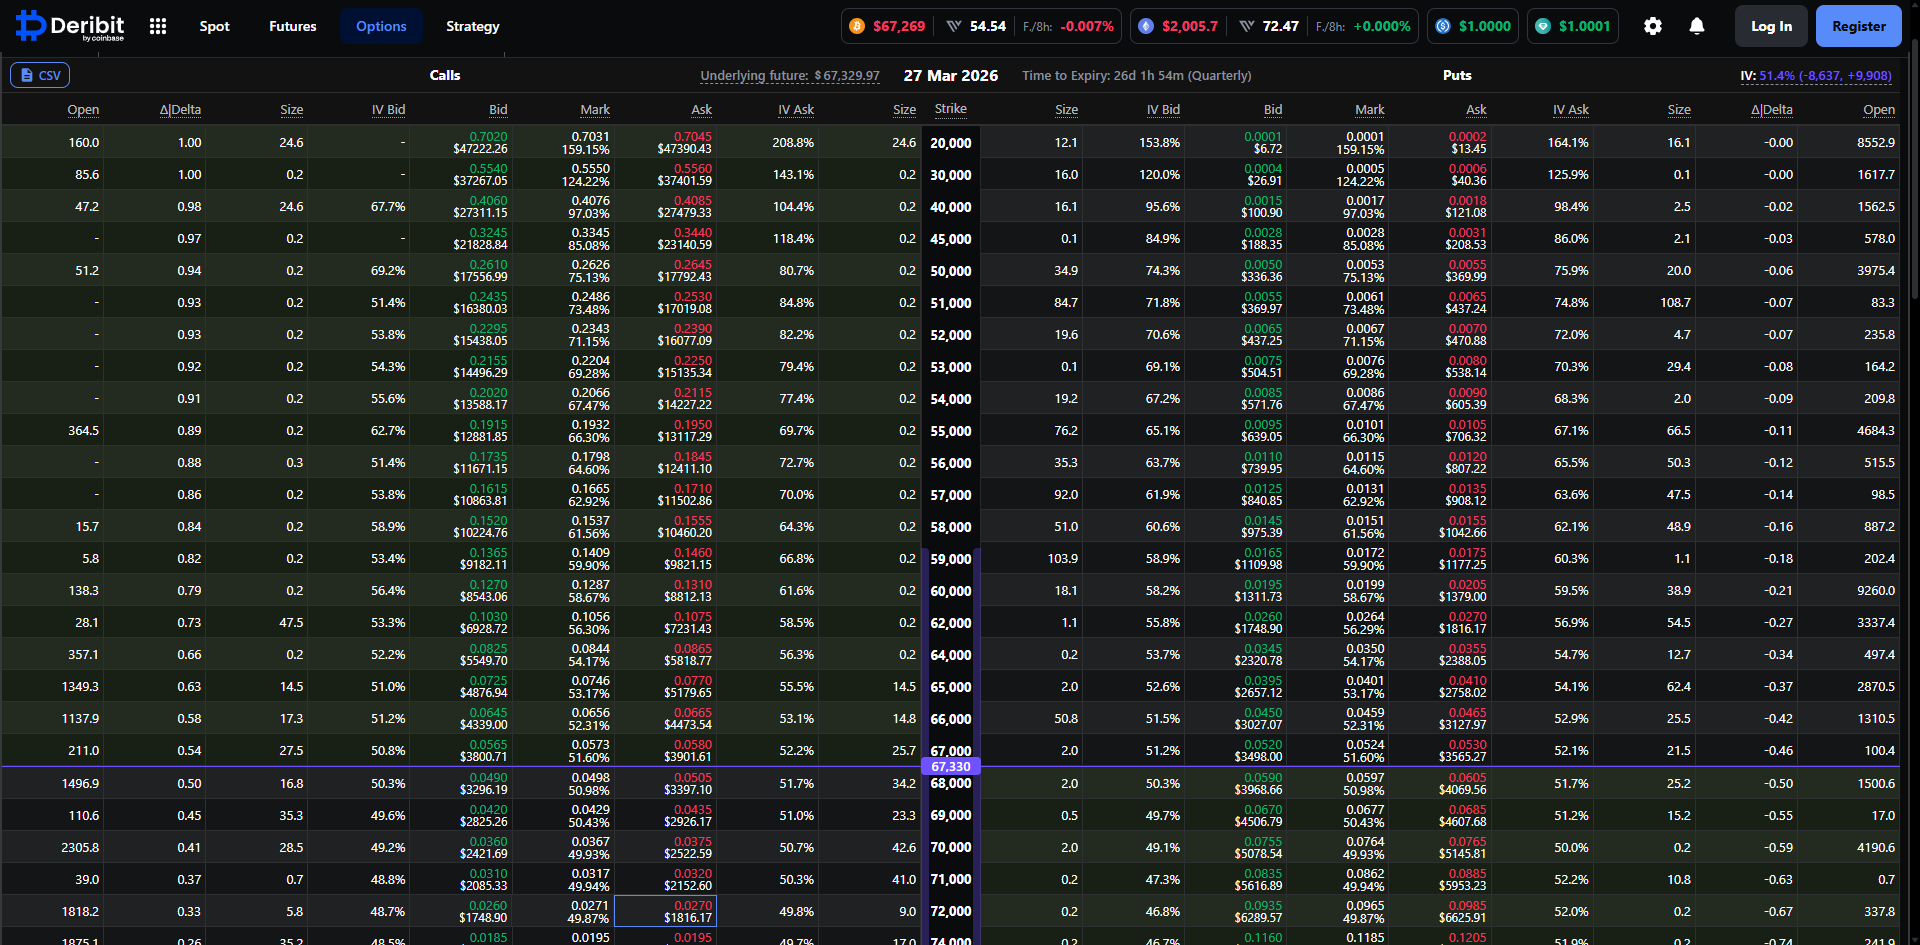
To gain insight into the real intentions of smart money, the derivatives market, particularly the options data, provides the most intuitive quantitative cross-section. By analyzing BTC options data set to expire on March 27, 2026, on the Deribit platform, we can clearly illustrate the main institutions’ pathway projections for the next month.
Currently, the implied volatility (IV) of the BTC options expiring on March 27 stands at a relative high of 51.3%. Against the backdrop of a geopolitical crisis, options sellers have swiftly lifted the volatility curve to address the potential Gamma exposure risks posed by extreme market conditions. An IV above 51% indicates that the market is hedging against potential wide fluctuations that may occur in the next two to three weeks. For quantitative traders, the risk-reward ratio for shorting volatility is extremely poor at this time, and the market is largely in a "buying straddle" or constructing tail risk protection frenzy.
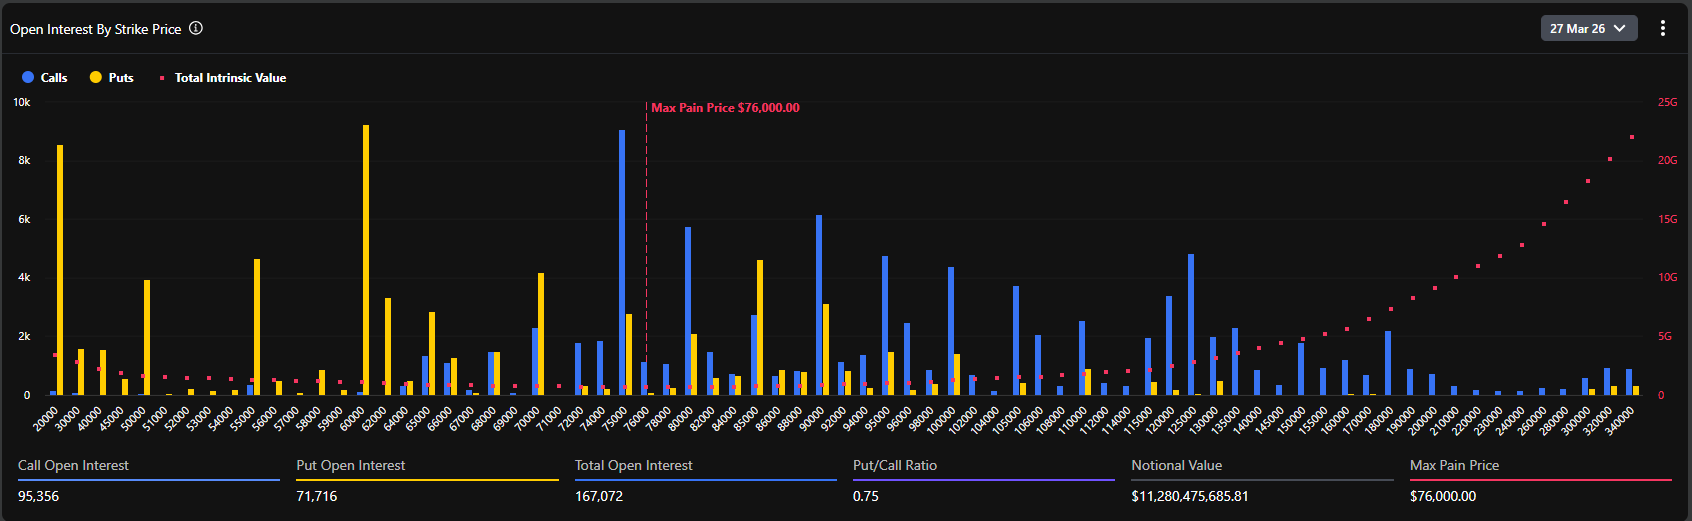
According to the distribution chart of open interest in options, the highest pain point across the market currently stands at $76,000. This is a highly forward-looking and controversial data point.
Typically, as expiration approaches, there is a tendency for the underlying asset price to gravitate towards the maximum pain point, minimizing the overall value for options buyers. However, the current spot price (around $67,400) is nearly 12% discounted from the maximum pain point ($76,000). This significant divergence reveals two core logics:
First, before the crisis exploded, the market was in an extremely optimistic bullish sentiment, with a substantial amount of capital betting on breaking the historical high in late March (the range of $75,000–$80,000), which directly drove up the level of the maximum pain point.
Second, the outbreak of the geopolitical crisis constituted a strong external shock that suppressed the upward momentum of spot prices. However, with a total holding volume of as much as 167,072 BTC (with a nominal value exceeding $11.2 billion), the bulls did not see widespread liquidation due to war-related news.
Data shows that the current put/call ratio (Put/Call Ratio, based on open interest) is 0.75. This value is below 1, indicating that from a global stock perspective, call options still dominate in terms of open interest. Especially at strike prices of $75,000, $80,000, and even $100,000, there is an accumulation of massive call positions (with the highest single strike price nearing a scale of 10k BTC).
However, it is noteworthy that the 24-hour volume PCR (Put/Call Volume Ratio) reached 1.37. The divergence between the excess bullish stock (0.75) and the excess bearish increment (1.37) perfectly encapsulates the current market psychology: long-term institutions still maintain their existing bullish exposure (not selling spot, not closing long calls), but in the short term following the outbreak of the Middle East war, a large amount of capital flowed into purchasing out-of-the-money put options for tactical hedging, leading to a surge in short-term put trading volume.
Combining the detailed options data from Deribit, we observed that in the range of $67,000 to $70,000, the Delta values of options are extremely dense. The current spot price of $67,495 is right in the battleground of bulls and bears' contention.
If the geopolitical situation worsens further, leading macro funds to withdraw significantly, and if the spot price falls below $65,000 (a strong support level), market makers will have to sell in the spot or futures market to hedge their short put exposures, potentially triggering a wave of local liquidity negative feedback and testing the psychological level downward at $60,000.
Conversely, if the situation in the Middle East enters a stalemate phase with major power mediation after a brief period of violence, once the market fear peaks and recedes, the rebound in the cryptocurrency market will be extremely fierce. Since a large number of call options are accumulated in the range of $70,000 to $76,000, if the spot price stabilizes and breaks through the $70,000 resistance level, market makers will be forced to buy spot to hedge their negative Gamma exposures. This classic "Gamma Squeeze" effect could push the BTC price to the maximum pain point near $76,000 at an unprecedented speed.
The aftershocks of the geopolitical turmoil in the Middle East will continue to ferment. The subsequent actions of the United States and Iran will determine the final destination of global safe-haven funds. In the foreseeable short term, the BTC spot price is likely to see intense fluctuations within a wide range of $62,000 to $70,000. The leverage in the derivatives market will be repeatedly washed in this process. Quantitative strategies should focus on "reducing leverage and capturing volatility," which are suitable for constructing calendar spreads or market making at key support and resistance levels to avoid directional trend exposure.
From the perspective of options position structure, the massive settlement on March 27 is an irresistible gravitational center for the market. Unless a global, uncontrollable liquidity drought of World War III proportions occurs, as panic sentiment marginally diminishes, the "safe-haven property" and "anti-inflation property" of BTC will be repriced. In mid to late March, the market will likely initiate a corrective rebound, with the spot price having a strong motive to gravitate towards $75,000–$76,000 (maximum pain point and dense Call strike area).
This event marks a new, higher-risk phase in geopolitics. Whether it is the resurgence of inflation expectations (with oil prices soaring) or the crisis of fiat currency trust triggered by financial sanctions against specific countries, these factors fundamentally strengthen Bitcoin's strategic value as a "borderless, non-sovereign hard asset." For large institutions such as family offices and macro hedge funds, the conventional 60/40 combination of dollar-denominated bonds and U.S. stocks can no longer cope with current tail risks. The allocation ratio of BTC as a "low-correlation asset" in investment portfolios is set to experience a systematic leap following this crisis.
The U.S. and Israel's strike against Iran marks the first thunderclap in reshaping the global financial landscape in early 2026. Beneath the veneer of panic, the data from the cryptocurrency options market calmly reveals the underlying strategy of institutional funds: "short-term defensive hedging, long-term still bullish."
For professional financial practitioners, stripping away emotional noise and closely watching the trends in implied volatility and market makers' Gamma exposure shifts is the core cipher to penetrate the fog of war and seize the next round of asset pricing power. With the maximum pain point of $76,000 standing like a lighthouse, every deep correction caused by panic accumulates momentum for future breakthroughs.
免责声明:本文章仅代表作者个人观点,不代表本平台的立场和观点。本文章仅供信息分享,不构成对任何人的任何投资建议。用户与作者之间的任何争议,与本平台无关。如网页中刊载的文章或图片涉及侵权,请提供相关的权利证明和身份证明发送邮件到support@aicoin.com,本平台相关工作人员将会进行核查。


