Bitcoin key pressure level game, after the channel breakout, is it a rebound or another drop?
As usual, in this issue, I will clarify the current viewpoint. Next, I will continue to observe until next Monday, and then update based on market changes. Yesterday, the market showed some changes, so I will provide a structural follow-up here and share my personal view at the moment.
First, the current segment of Bitcoin's movement still belongs to a fluctuating downward structure overall, which is very similar to the previous segment of channel-like fluctuations downward. The previous wave was running within a standard descending channel, and then the price broke upward through the channel, completing a phase of rebound upward.
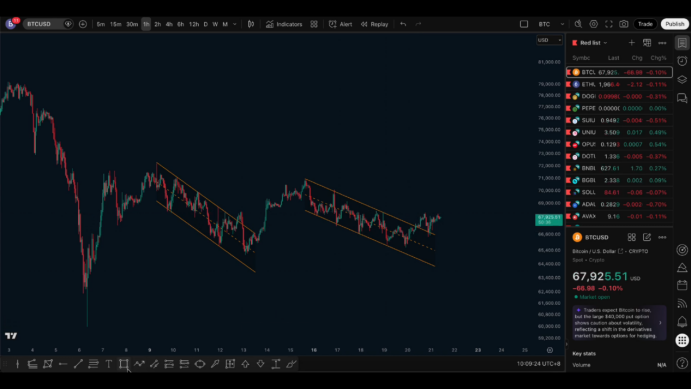
We can see that yesterday, the price also broke through this descending trend line, which is also a fairly standard channel downward structure. After the channel breakout, the price experienced a downward pullback, retreating from above 68,000 to around 66,500.
———
Why did this drop occur?
The core reason is: in the current entire fluctuating structure, around 68,000 is a very critical area for support and resistance to interchange positions. In other words, 68,000 is currently an important pressure level, and it is also a historical area for support and resistance conversion.
Looking back at previous movements, after the V-shaped rebound at the bottom, the price once had a retest at around 68,000; subsequently, there was a second test here followed by a rebound; furthermore, it was tested multiple times and eventually became a phase support.
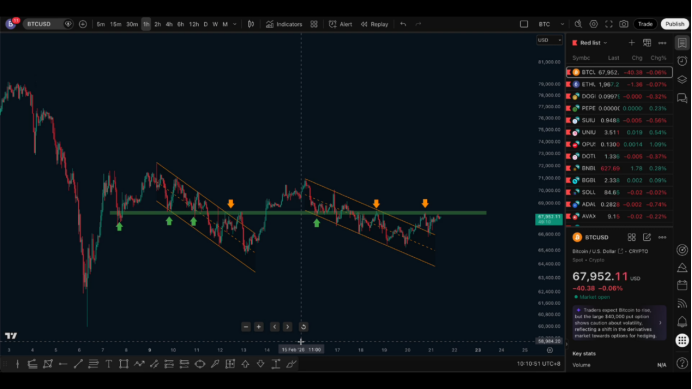
But once this support was broken, the price retraced multiple times, completing a typical support-resistance interchange here. Afterward, when the price rebounded again and broke through, there was another retest.
At that time, we mentioned that if this retest could stabilize effectively, there would be a chance to challenge the previous high of 72,000. However, that rebound ultimately did not break the previous high; instead, it fell below the support again, confirming the pullback and completing another support and resistance interchange.
Therefore, when the price reached this position again yesterday, it was bound to face pressure.
———
From a trading psychology perspective, many traders in the market would adopt similar technical analysis ideas at this position. In other words, the technical patterns that everyone sees are actually highly consistent.
During the previous breakout-retest phase, there was indeed a batch of long positions entering the market. However, the subsequent downward fluctuations were not enough to completely wipe out these long positions. Many people may have even added to their positions during the decline because most people's stop losses are typically placed at previous low positions, which were not effectively broken.
Thus, a large number of long positions were actually in a state of floating losses.
When the price returns to their opening cost area, there will be centralized unwinding behavior. And the unwinding of long positions essentially tends to bring about a correction.
Therefore, I prefer to understand this wave of decline as pressure from the exit of long positions in the futures market rather than active selling in the spot market.
Based on this logic, after the breakout of the trend line yesterday, we chose not to chase long but participated in a short position when the price approached the key pressure level.
From the outcome, the short-term profit space is between more than 1,000 points to over 2,000 points, which is a relatively normal short-term profit range under the recent fluctuating market, and the overall position control is also relatively reasonable.
———
Let’s return to the market structure itself.
Yesterday, the price encountered resistance and fell back at the key pressure level, but there’s a detail to note: this time the pullback did not create a new low.
Compared to the previous segment, every "decline-rebound" structure had gradually lowering highs and lows; however, this time, the low points began to rise.
This indicates that when the price tests the resistance area again, we need to focus on whether the resistance will be effectively broken.
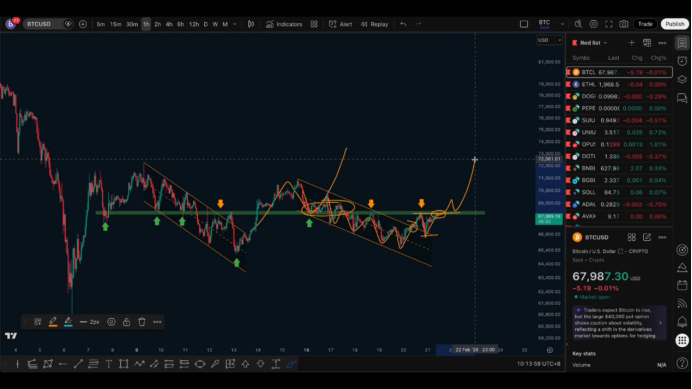
Recapping my expectation given yesterday: if a channel breakout forms here, there is a chance to break into a new high first and then enter a new continuation of the bearish segment.
Currently, the price has completed the channel breakout, and the real key moving forward is the core pressure level in front of us.
If the pressure level is effectively broken, there is a high probability of starting a new upward rebound; if it encounters resistance and falls back again, we need to continue to pay attention to the support effect of the 0.5–0.68 retracement range below.
As long as the key support area below is not effectively broken, the overall structure still tends towards a fluctuating upward trend, which is the path I currently believe has a relatively high probability.
———
Additionally, I want to emphasize again:
Long-term bearish positions are not recommended to enter hastily at the moment. It carries higher risk to set up long-term shorts at these levels. The expectation for a rebound objectively exists, and once a rebound occurs, the space could be significant; hence there’s no need to take high-risk chances here.
In the short term, I still prefer to first observe a period of fluctuating rebound upward rhythm.
Follow me, join the community,and progress together.

免责声明:本文章仅代表作者个人观点,不代表本平台的立场和观点。本文章仅供信息分享,不构成对任何人的任何投资建议。用户与作者之间的任何争议,与本平台无关。如网页中刊载的文章或图片涉及侵权,请提供相关的权利证明和身份证明发送邮件到support@aicoin.com,本平台相关工作人员将会进行核查。


