比特币 目前可能对交易者来说并不有趣,但今天至少有一种山寨币让市场热议——这一切都源于与美国领先的加密货币交易所 Coinbase 的惊人合作。
首先,背景:全球加密货币市场目前并没有太大动静,市值约为 3.25 万亿美元,在过去 24 小时内几乎持平。但这对已经在本周早些时候遭受重大损失的加密投资者来说,可能是个好消息。此外,如果我们放眼长远,今年的总加密市场市值有所上升,在过去三个月中增加了大约 5 亿美元。
加密恐惧与贪婪指数 目前接近 65,反映出中性到看涨的情绪,支持逢低买入而非恐慌性抛售。最近与以色列-伊朗冲突相关的地缘政治紧张局势、美国可能参与战争以及 12 亿美元的杠杆清算,造成了市场动荡。
但尽管短期波动性较大,机构对加密货币的支持依然强劲,过去两周美国本土的 ETF 仍保持净流入,而黑石的 iShares 比特币信托迅速超过了 $700 亿 的管理资产规模。
比特币:测试支撑位
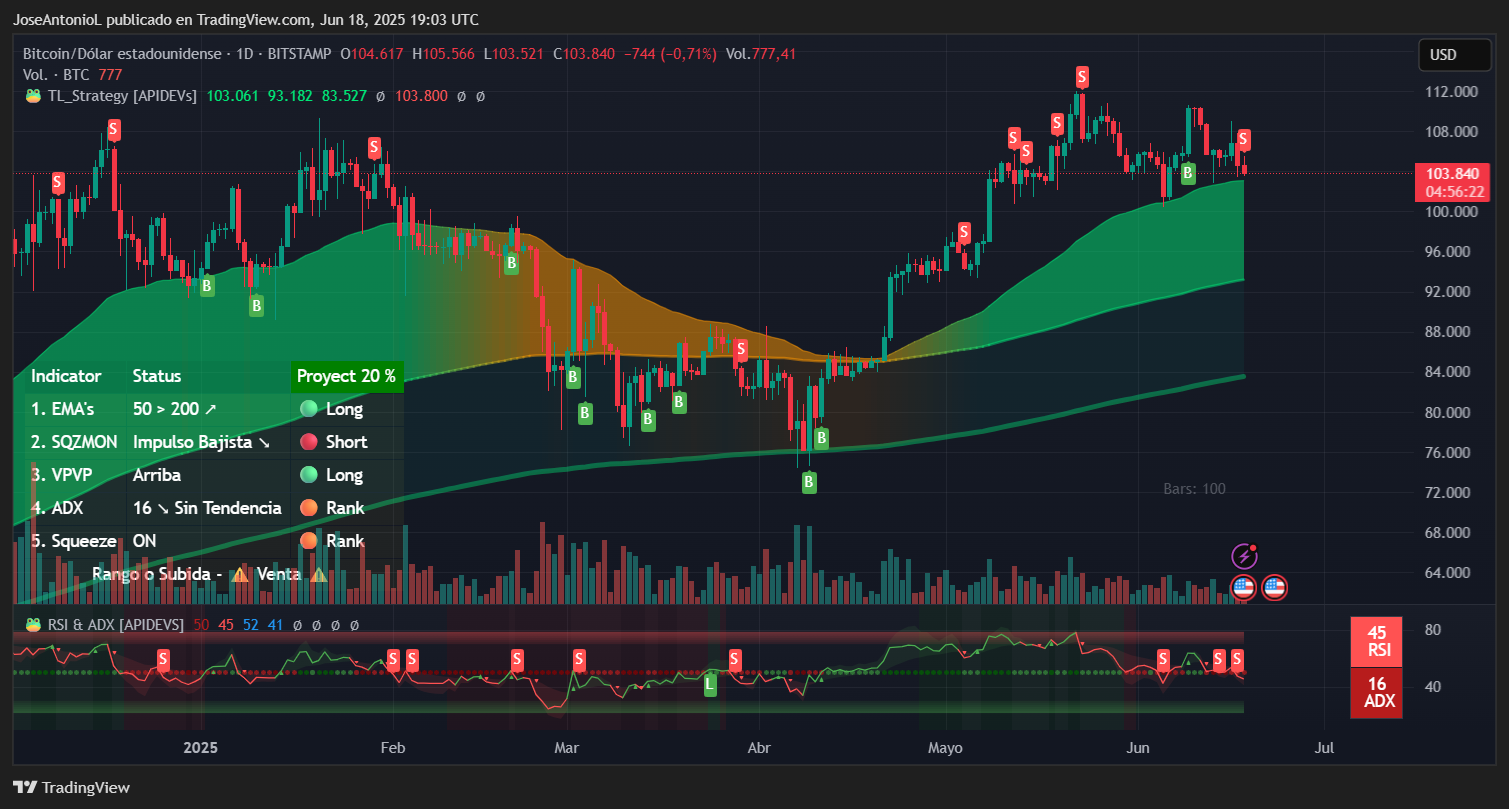
比特币交易数据。图片来源:TradingView
比特币目前交易价格约为 $103,7410,接近 $104,000 的支撑位。日线图显示出一个整合阶段,这可能决定下一个重大走势。交易量减少至 494 亿美元,较昨日下降 10%。
技术图形显示比特币处于一个关键的拐点,但基于自 5 月以来的整体模式(低点逐渐降低:$112k, $110k, $108k),仍然是中性到看跌的,这意味着多头仍然能够使价格反弹——只是力度不足以保持动能。
平均方向指数(ADX)用于衡量价格趋势的强度,确认了这一模式。当前位于 16 点的“无趋势”区域,该指标指向一个整合阶段,而非强烈的方向性动能。这种横盘走势通常预示着未来某一方向的重大变动。一般来说,当指标超过 21 点时,趋势被视为稳固。
相对强弱指数(RSI)用于衡量某种币的价格运动的自然程度。目前,它徘徊在 45,表明比特币处于中性区域,交易者在等待接下来的发展。
50 日和 200 日指数移动平均线(EMA)均显示出长期信号,金叉模式仍然完好,支持长期看涨结构。在交易者的术语中,“金叉”发生在短期价格(由 EMA50 表示)穿越长期平均线(由 EMA200 表示)时,通常被解读为看涨信号。
需要关注的关键技术水平:
近期阻力位:$106,500(近期拒绝区)
主要阻力位:$108,800-$110,000(卖方持续防守的心理区)
关键阻力位:$112,000(历史最高点区域)
近期支撑位:$102,000-$103,000(当前测试区)
主要支撑位:$100,000(心理水平)
关键支撑位:$93,200(200 日 EMA 区域)
AERO:挑战市场重力
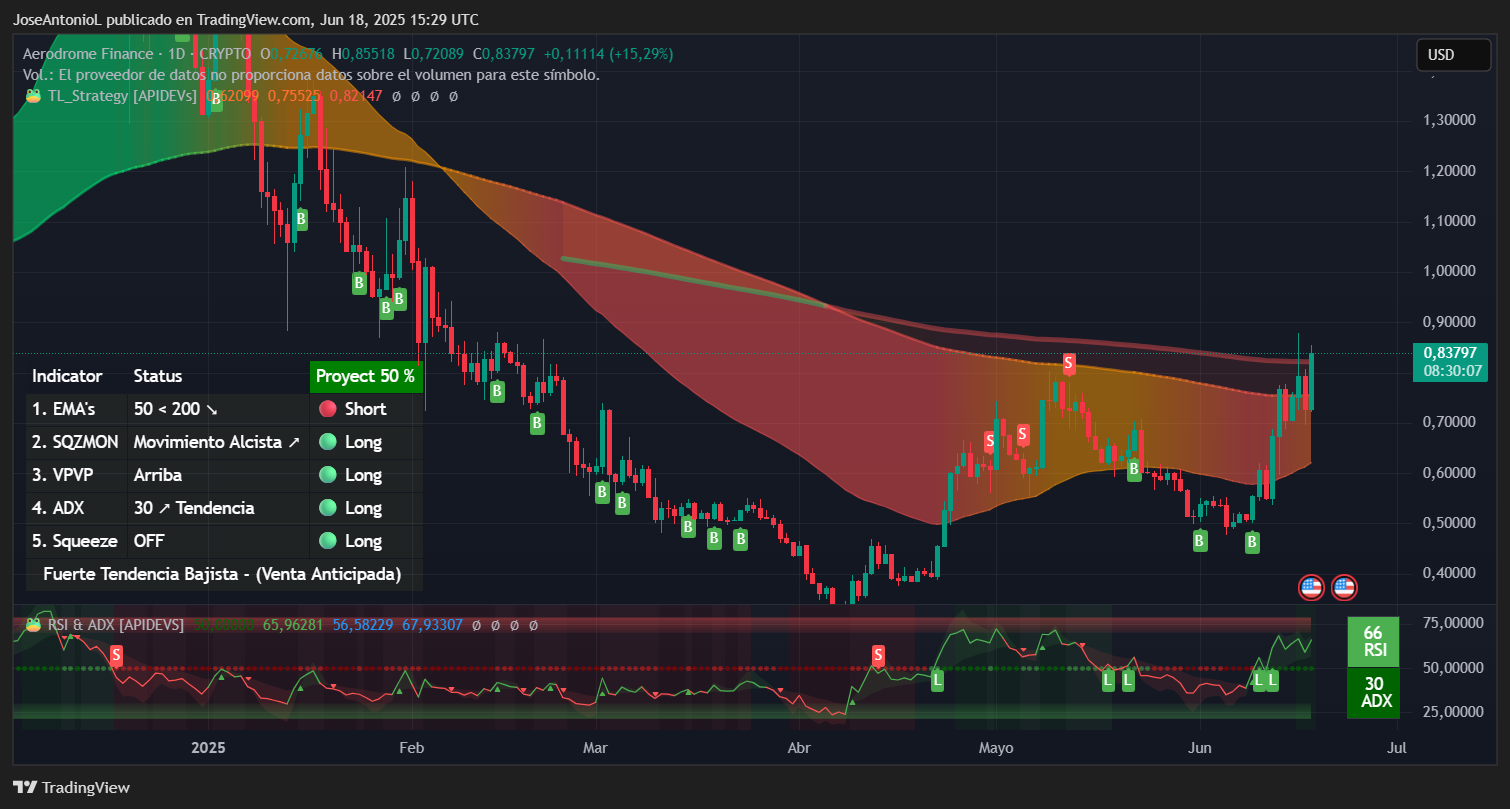
AERO 交易数据。图片来源:TradingView
在比特币整合的同时,大多数 山寨币正在下跌,Aerodrome Finance(交易名为 AERO)今天成为最耀眼的明星,6 月份上涨超过 80%,今天上涨 14.78%,当前价格为 $0.8379。Aerodrome 自我宣传为 Coinbase 的以太坊二层网络 Base 上的“中央交易和流动性市场”。
上周末,Aerodrome Finance 宣布其去中心化交易所(DEX)将“直接”集成到主 Coinbase 应用中。你可能已经在手机上安装了这个应用。这意味着 Aerodrome 很快将接触到 Coinbase 的 1080 万 月活跃用户。因此,很容易理解为什么交易者对 AERO 持乐观态度,目前其市值为 6.8 亿美元,完全稀释估值为 13 亿美元。
AERO 的日线图确认了明显的趋势:异常强劲的看涨动能。价格已果断突破关键的 $0.78 阻力位。此次突破发生在大量交易量下,确认了至少在短期内的真实买入兴趣。
ADX 指标读数为 30,伴随长趋势信号,表明趋势强度正在中等到强劲发展。与比特币无方向的 16 的 ADX 不同,AERO 的 30 读数表明正在进行方向性移动,且动能在增加。
RSI 当前为 65.96——看涨但未达到超买区域(70 以上)。这为进一步上涨留出了空间,直到技术指标暗示疲软。50 日 EMA 正在上升,预计将穿越 200 日 EMA 形成金叉。如果发生这种情况,那么看涨修正可以被确认为一个严重的价格趋势,因为短期内代币的平均价格将高于很久以前的价格。
关键技术目标和水平:
近期阻力位:$0.88(23.6% 斐波那契水平和本周高点)
主要阻力位:$1.30(50% 斐波那契回撤、心理水平以及死亡交叉发生的点)
扩展目标:$1.40-$1.60(如果动能持续)
支撑位:$0.70(心理水平)
下一个支撑位:$0.66(弱目标)
关键支撑位:$0.55
作者表达的观点和意见仅供信息参考,并不构成财务、投资或其他建议。
免责声明:本文章仅代表作者个人观点,不代表本平台的立场和观点。本文章仅供信息分享,不构成对任何人的任何投资建议。用户与作者之间的任何争议,与本平台无关。如网页中刊载的文章或图片涉及侵权,请提供相关的权利证明和身份证明发送邮件到support@aicoin.com,本平台相关工作人员将会进行核查。


