Establishing a Position, Managing Holdings, Selecting a Position - The Three Steps to Success!
Overall, the Bitcoin weekend market is following a retracement trend, with each downward low gradually decreasing and rebound highs also moving lower. Currently, it is within a downward channel, with the resistance level decreasing.
Last week, it was mentioned that Bitcoin was at a high level, with no reference for upward pressure, and only short-term highs as a reference standard. It is important to be vigilant against market downturns, especially after continuous new highs without a deep retracement and consolidation, which is clearly unhealthy. As expected, the market downturn occurred, but this time it was not a short-lived dip, but a steady retracement over time.
In terms of the weekly chart, last week closed with a doji star candlestick, with a high of 73850, a low of 64500, and a close of 68400. The upper and lower shadow lines are quite severe, indicating obvious market manipulation. After the line change today, it first showed a bearish trend, with signs of further downward movement and support from the Stan. On the daily chart, there are three long bearish candlesticks, completely breaking the bullish trend. Fortunately, it closed with a bullish candlestick over the weekend, temporarily slowing down the bearish trend. However, the 5-day moving average and the 10-day moving average have formed a death cross and turned downwards, which is not a good sign. It is necessary to look at the support near the 30-day moving average around 63000.
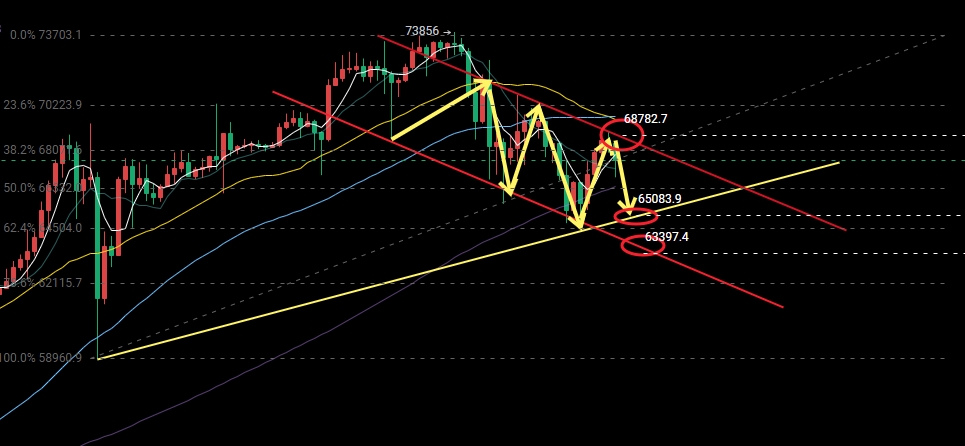
On the smaller time frame, 73400, 70600, and 69300 form the upper boundary of the downward channel, while 68600, 66200, and 64800 form the lower boundary. Currently, the market is running in the middle of the channel. The 5-day and 10-day moving averages are turning upwards, with dual resistance from the 60-day and 30-day moving averages. If it can break through and stabilize, the market can continue to move upwards; otherwise, it will continue to be pushed down and test the support below. At the same time, the next support at 65000 is at the 0.63 Fibonacci retracement level, which is an important support level for the previous upward channel. During the day, we need to pay attention to the strong resistance at 68600. If it is not broken, it is appropriate to enter short positions to anticipate a retracement. Look at how the support at 64800 holds below. If it breaks virtually, you can directly enter long positions. If it dips, there is a high probability of going to 63800, which is a safe entry point for long positions.
Recommendations: Focus on short positions for rebounds. Enter defensive short positions at the upper boundary of the downward channel (68600-69200). Pay attention to the virtual break and dip at the 64800 support. In the event of a sudden market change, adjust positions in real time.
Due to the impact of the review time, for subsequent real-time adjustments, offline strategies are the main focus. The suggestions are for reference only. Follow my lead in trading and profit - you can do it too! Rain or shine, I'll be waiting for you at Wolong.
Official Account: Zhuge Talks Coin

免责声明:本文章仅代表作者个人观点,不代表本平台的立场和观点。本文章仅供信息分享,不构成对任何人的任何投资建议。用户与作者之间的任何争议,与本平台无关。如网页中刊载的文章或图片涉及侵权,请提供相关的权利证明和身份证明发送邮件到support@aicoin.com,本平台相关工作人员将会进行核查。


