Trend, Position Control, and Selection are the Three Steps to Success!!!
Bitcoin finally paused yesterday, and the bulls regained ground during the day, followed by a volatile consolidation in the evening. The bears can be said to have been short-lived, and the volume of the decline is unstable and lacks continuity.
On the daily chart, there are two bullish candles sandwiching a bearish one, accompanied by an upper shadow line yesterday, but lower than the previous bearish candle. It can only be slightly repaired later. It will be difficult to break through to new highs in the next few days, and a period of accumulation is needed. All moving averages are in an upward trend, forming multiple supports. To completely retrace, there needs to be a large bearish candle breaking through like the day before yesterday, otherwise it will gradually repair the indicators over time to release the risk.
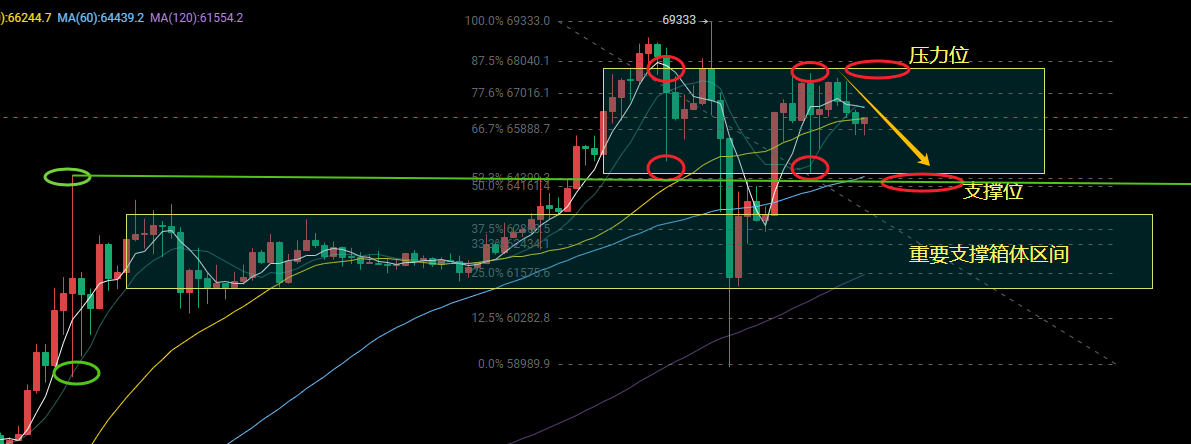
On the smaller time frame, the oscillation range of two pin bars is between 61000-63000, forming a critical turning point range. If this range is not breached, the bulls will dominate, and the consolidation will continue to be bearish, further retracing and probing lower. The current high-level consolidation also forms a range. Without considering the situation of breaking through the range, the upper side is at 68100, and the lower side is at 64500. Recently, the pressure has returned to this level, and the support has rebounded from this level.
On the technical side, the five-day moving average and the ten-day moving average are slightly stuck, forming a death cross. The five-day moving average shows signs of turning downwards, while the thirty-day moving average is also in a parallel state. If the five-day moving average and the thirty-day moving average also form a death cross later, the market will decline again to test the support at 64500, which is also an important Fibonacci 0.5 level. The red volume of the MACD is gradually decreasing, and the DIF and DEA are converging, but the death cross has not yet formed. In terms of volume, there has been serious washing of positions recently, which has also led to the low trading volume today. It has been shrinking all along, indicating that most traders are in a wait-and-see state regarding the current price and market conditions.
Today's strategy will be provided in real time during the trading session. We will pay attention to the resistance at 68000-68300 and the support at 64500-64200. If the market undergoes a sudden change, we will make adjustments during the session.
Due to the impact of the review process, for subsequent real-time adjustments, offline real-time strategies will take precedence. The suggestions are for reference only. Follow my lead, make a profit, and you can too!!! Waiting for you through wind and rain, like a sleeping dragon.
WeChat Official Account: 诸葛谈币

免责声明:本文章仅代表作者个人观点,不代表本平台的立场和观点。本文章仅供信息分享,不构成对任何人的任何投资建议。用户与作者之间的任何争议,与本平台无关。如网页中刊载的文章或图片涉及侵权,请提供相关的权利证明和身份证明发送邮件到support@aicoin.com,本平台相关工作人员将会进行核查。


