Trend, Position Control, and Selection - The Trilogy of Success!!!
Ethereum quickly saw a wave of bulls in the morning, once again refreshing the short-term high, but unfortunately the space is limited and unable to increase volume and continue, so it is under pressure to retrace. Currently, it also presents a double-needle top pattern.
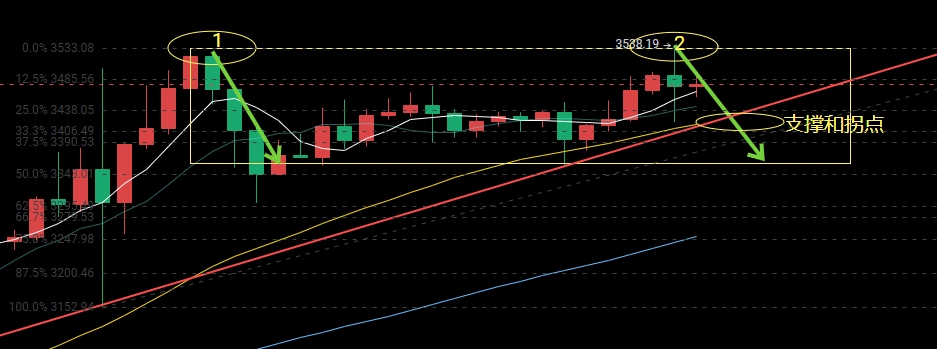
On the four-hour chart, after the weekend's oscillation and consolidation, the various moving averages have broken free from the adhesive state. The five-day moving average has turned upwards, and the other moving averages are also in a divergent state, providing multiple supports. The Bollinger Bands are showing signs of contraction. The morning's up and down needles have caused both bulls and bears to quickly release volume. The overall trend is bullish, but ultimately it oscillates near the high, only to see a short-term small retracement. The Bollinger Bands show signs of contraction, with resistance at the upper rail of 3500, support at the middle rail of 3422, and this position is also the 0.33 Fibonacci level. This can be used as a temporary reference price during the day.
After the one-hour chart showed the "Tian Di Zhen" (Heaven and Earth Needle), the market once again moved upward, but was affected by resistance. The upper shadow line was not successfully repaired, and the five-day moving average and the ten-day moving average formed a death cross, gradually testing downwards. The middle rail obviously cannot withstand the retracement, and the lower rail is also imminent. After the formation of the moving average death cross, the MACD is also below the 0 axis, and the green volume column is gradually increasing, indicating the need for another retracement.
Today's strategy: After the "Tian Di Zhen," double-needle top, watch for retracement. Defend short positions at 3495-3515 for Ethereum, and look for support at 3420-3400 below. If it does not directly break the support with a single bearish candle, you can appropriately enter long positions. In the event of a sudden change in the market, we will make intraday adjustments.
Due to the impact of the review time, for subsequent intraday adjustments, real-time offline strategies are the main focus. The suggestions are for reference only. Follow my lead, make a profit, and you can too!!! Through wind and rain, Wolong awaits you.
WeChat Official Account: Zhuge Talks Coins

免责声明:本文章仅代表作者个人观点,不代表本平台的立场和观点。本文章仅供信息分享,不构成对任何人的任何投资建议。用户与作者之间的任何争议,与本平台无关。如网页中刊载的文章或图片涉及侵权,请提供相关的权利证明和身份证明发送邮件到support@aicoin.com,本平台相关工作人员将会进行核查。


