The trend is progressing as expected. As predicted a few days ago, the daily chart has initiated a rebound. I have been delayed in updating the article these days, but I have reminded the community whenever there is an opportunity. Congratulations to the partners who have followed the rhythm.
When the market rebounds, various external voices will emerge, especially from some newcomers who are starting to get excited again, seeing the market turning green. Little do they know that the main force may be brewing the next round of correction. What we need to do is to respond accordingly, buy when it's time to buy, sell when it's time to sell, without predicting or fantasizing. We should act based on the signals the market gives us. This is the way to survive in this market.
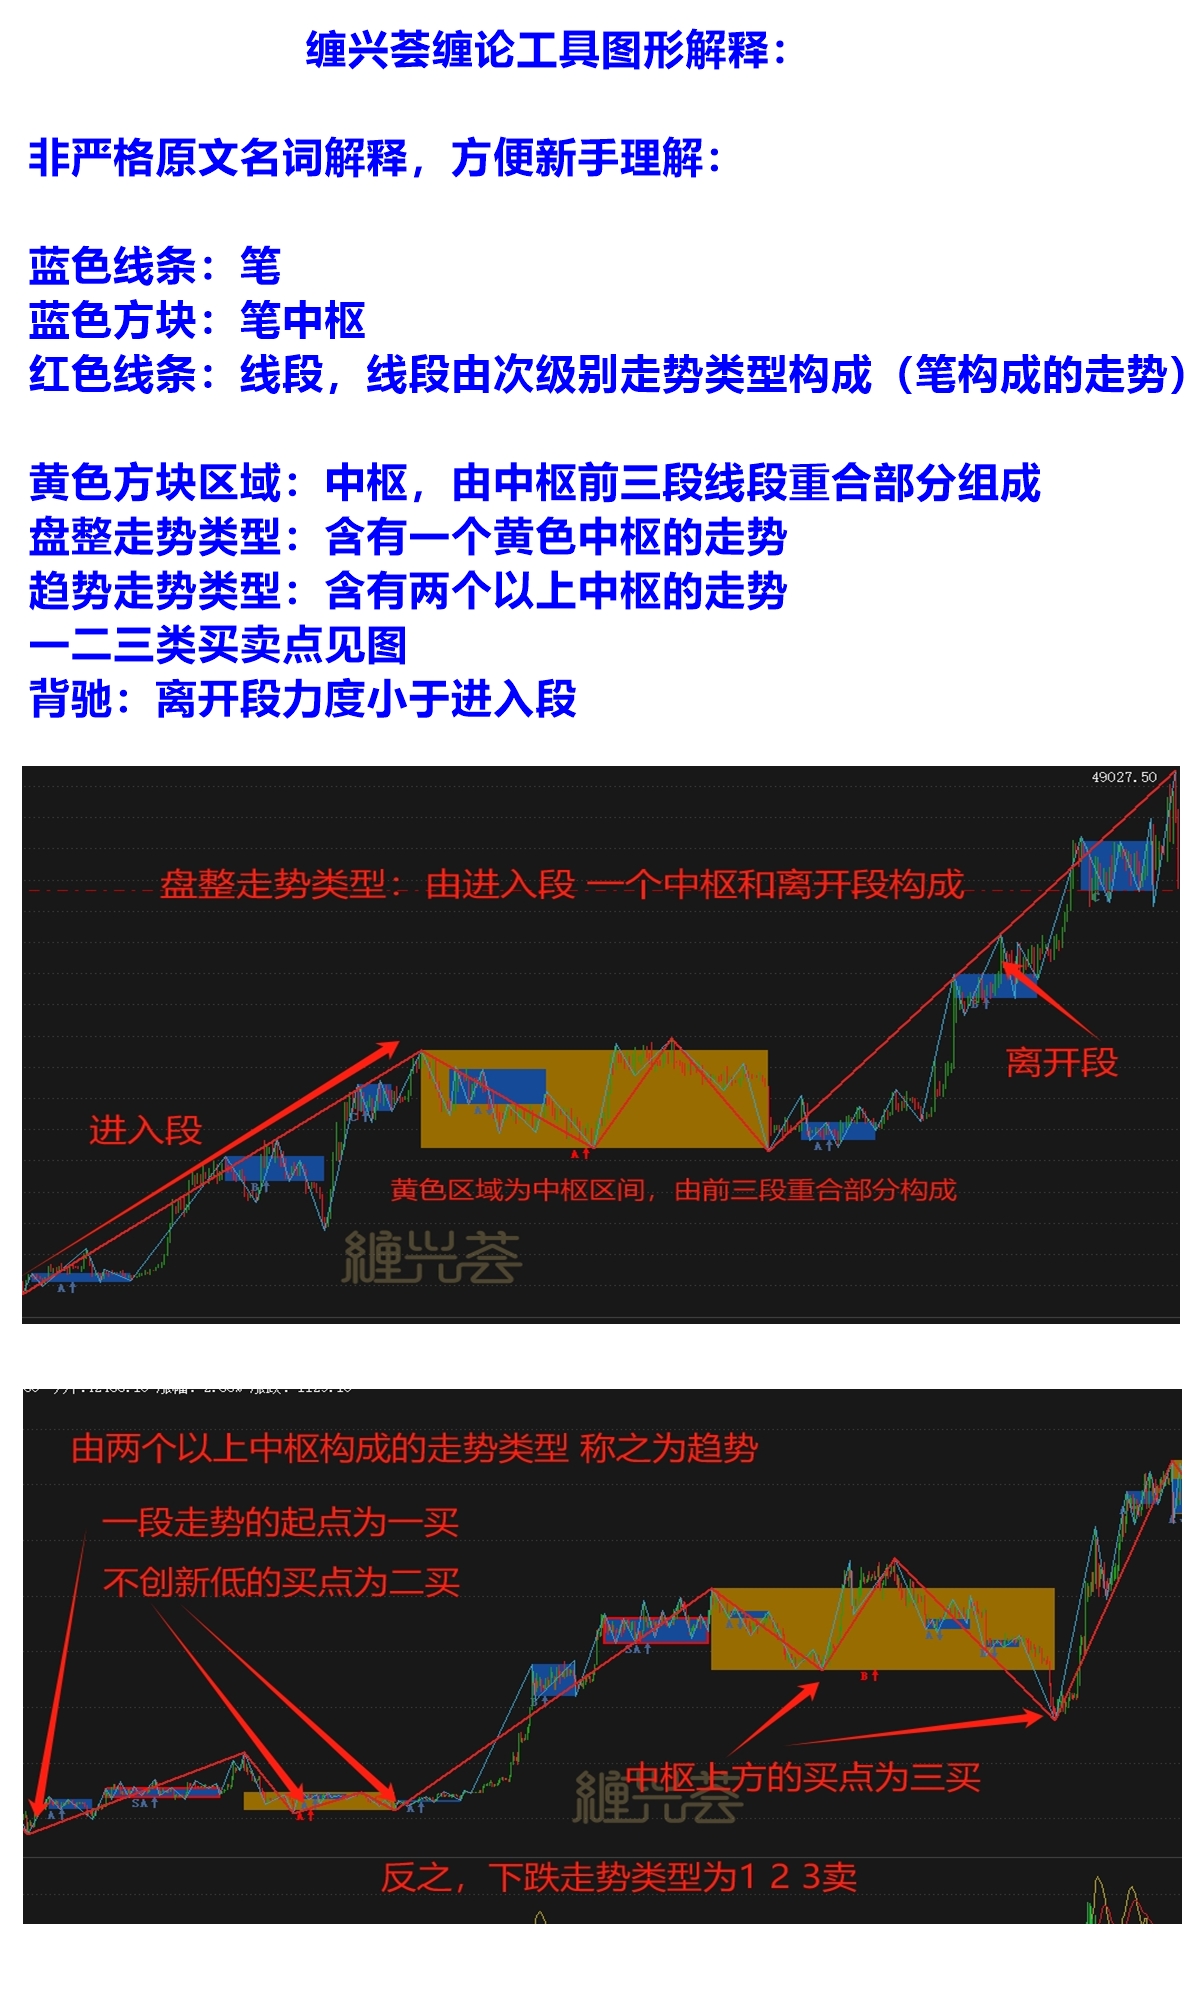
As usual, for the convenience of everyone's understanding, I will first provide some explanations of the terms. The displayed chart is generated using the automatic drawing tool of the Chángéng Huì Chán Lùn.
Now let's start today's market analysis:
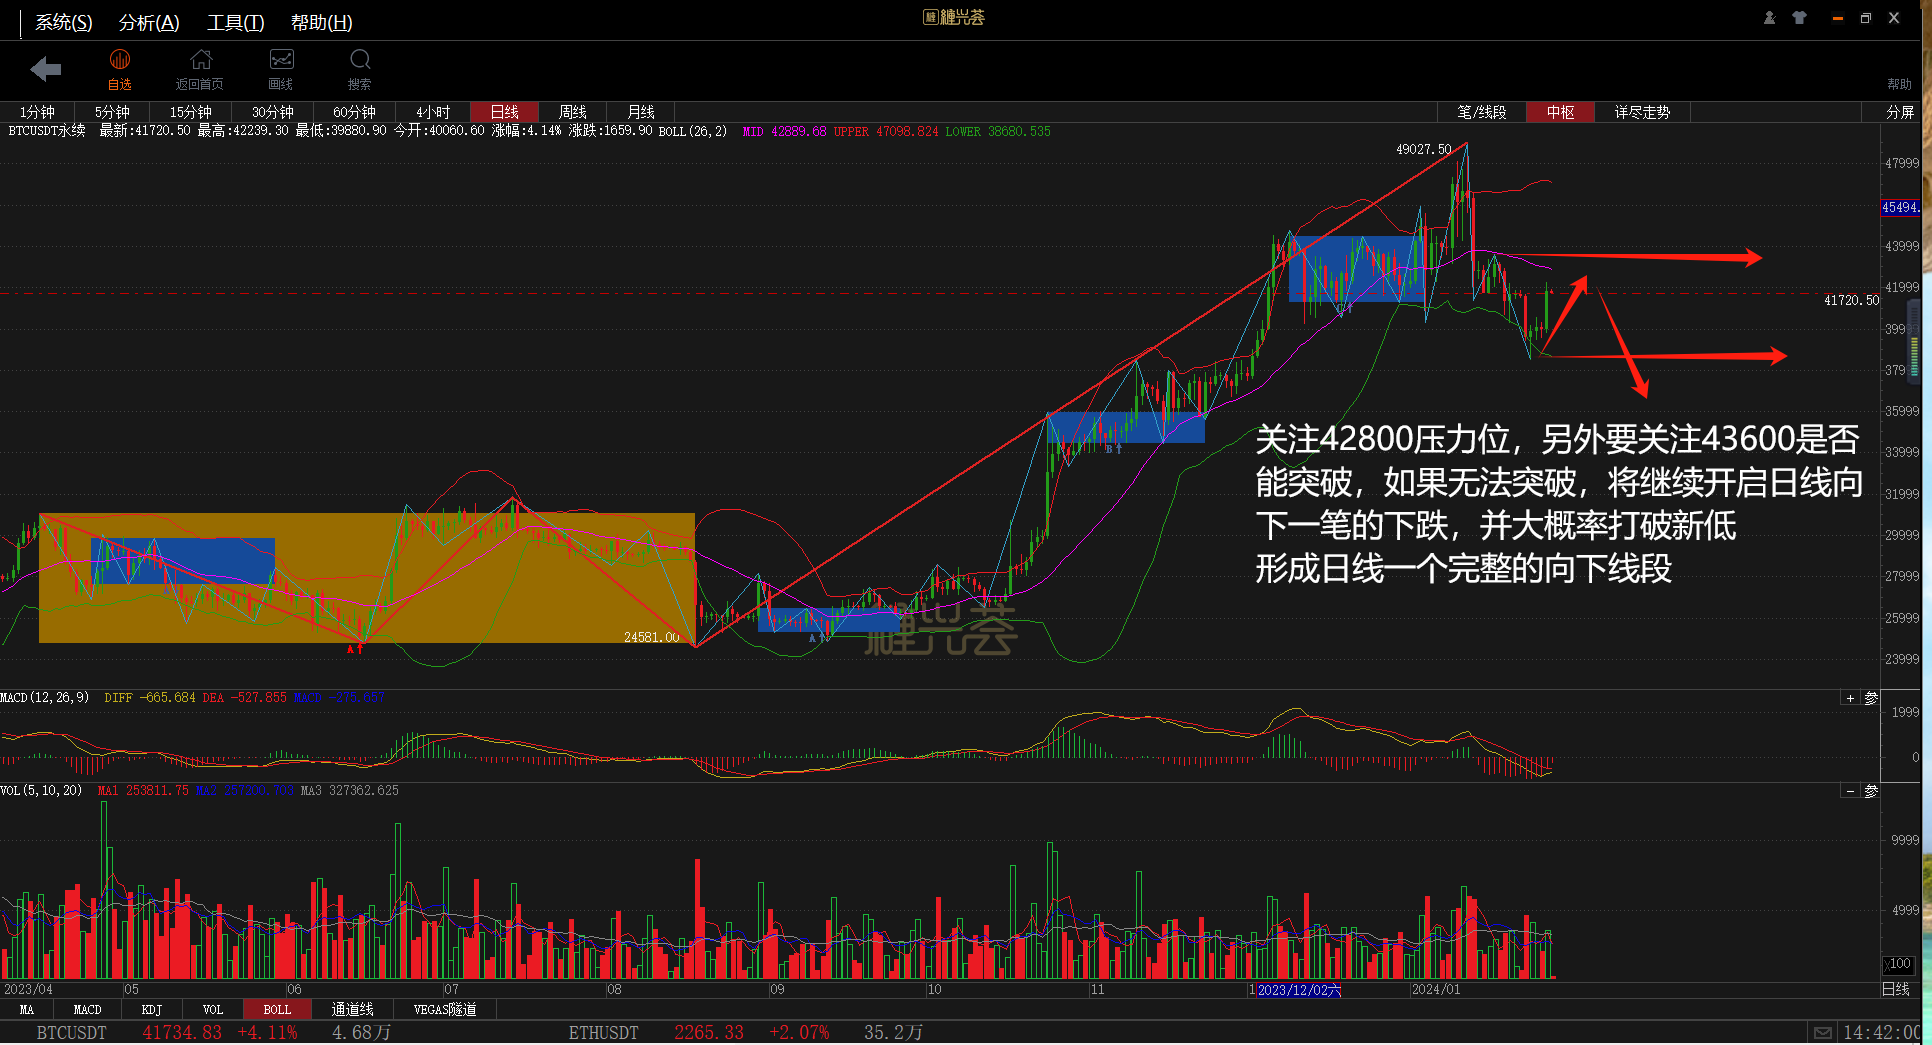
Daily chart: The establishment of the bottom sub-wave has triggered an upward rebound. Along with the growth of this sub-wave, we need to pay attention to the pressure level of the Bollinger Bands' midline at 42800.
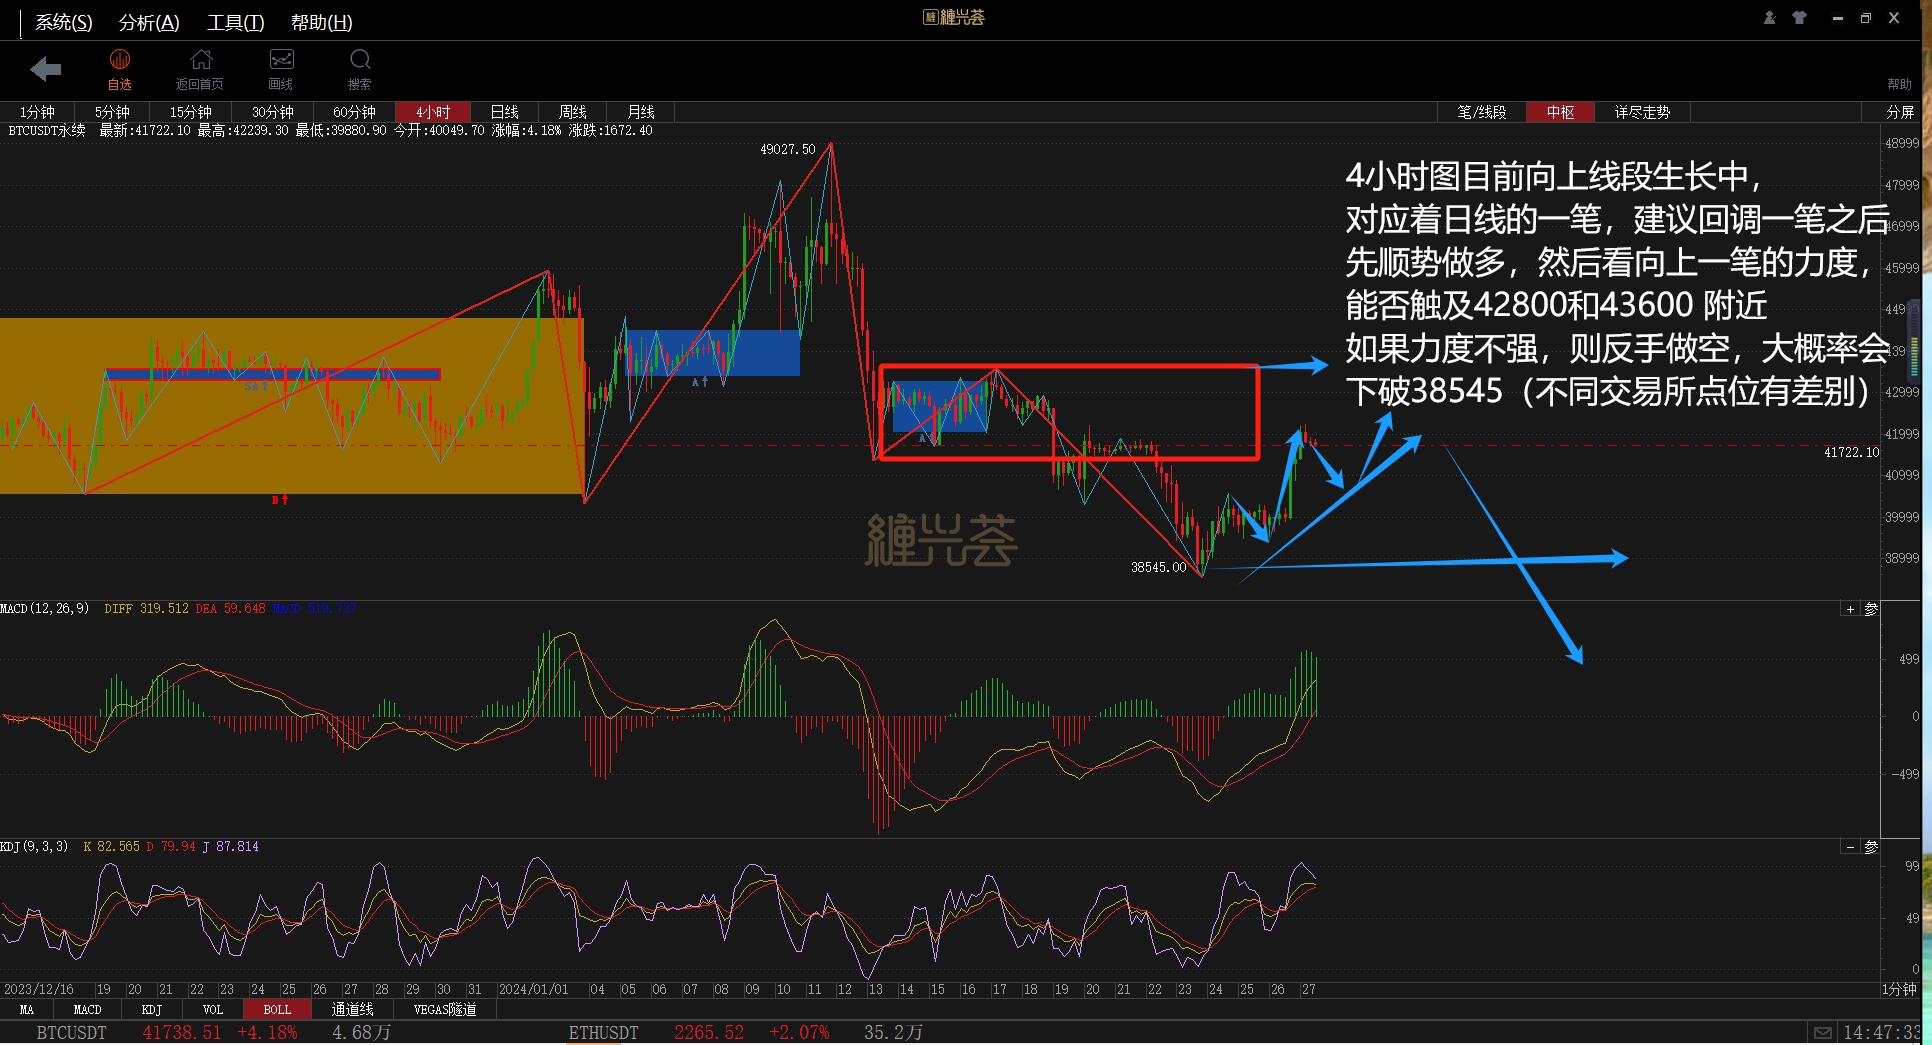
4-hour chart: During the upward trend, combined with the daily chart, observe the strength of the upward trend. It is recommended to focus on long positions during minor retracements.
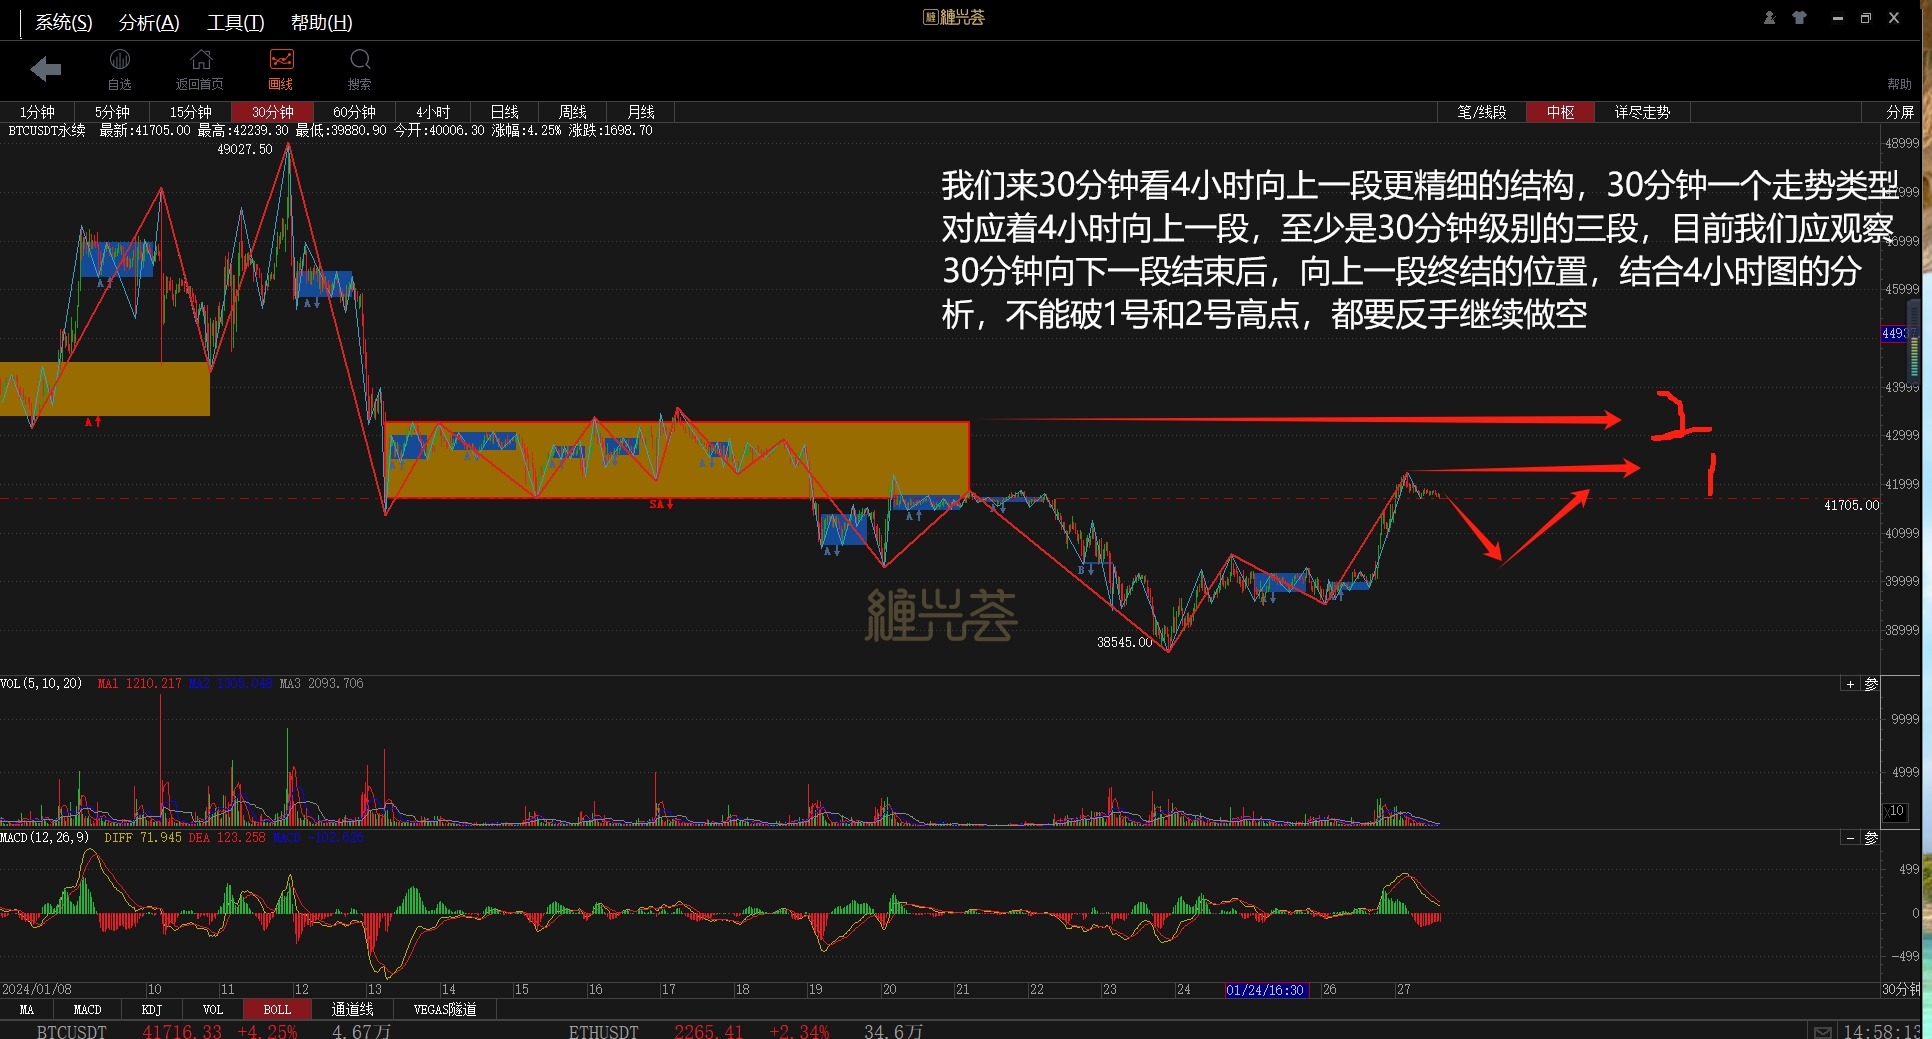
The 30-minute chart provides a more detailed display of the upward trend on the 4-hour chart. Each segment on the 4-hour chart corresponds to a trend type on the 30-minute chart. This is also an important level relationship in the Chángéng theory. Different charts at different levels correspond to different structures.
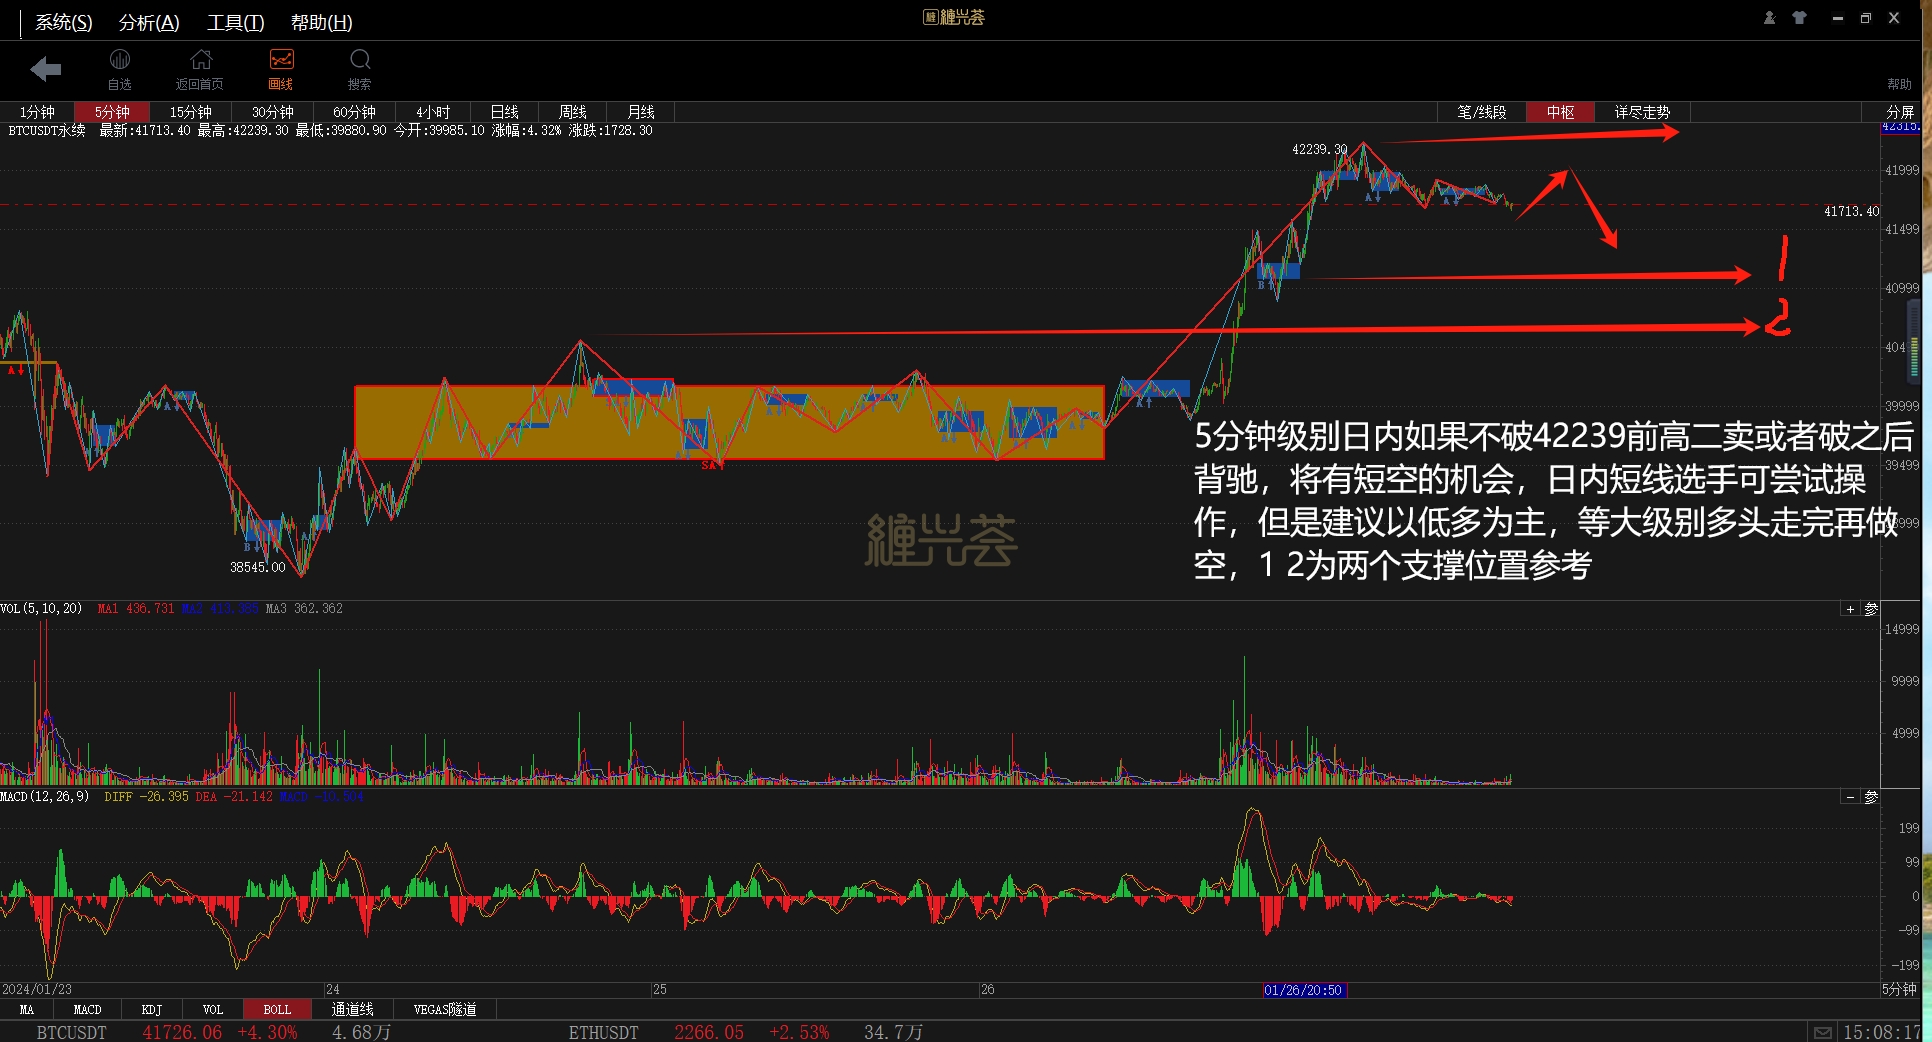
Moving down to the 5-minute chart, which represents the intraday trading opportunities, short positions can be attempted. However, the long-term bullish trend has not been confirmed yet. It is necessary to pay attention to profit-taking and stop-loss. It is recommended to focus on long positions on dips, and then wait for the establishment of a bearish opportunity at a higher level before switching to short positions.
[If you also like Chángéng theory and want to learn and discuss it, you can search for CZSC1319 on WeChat to join the Chángéng Huì community. More exciting market analyses of mainstream and popular altcoins such as BTC, ETH, and LTC will be shared with you.]
The way of Chángéng theory, the source of wealth [Welcome everyone to actively leave comments. If you like my analysis, you can also leave the cryptocurrency you want to analyze in the comment section.]
免责声明:本文章仅代表作者个人观点,不代表本平台的立场和观点。本文章仅供信息分享,不构成对任何人的任何投资建议。用户与作者之间的任何争议,与本平台无关。如网页中刊载的文章或图片涉及侵权,请提供相关的权利证明和身份证明发送邮件到support@aicoin.com,本平台相关工作人员将会进行核查。


