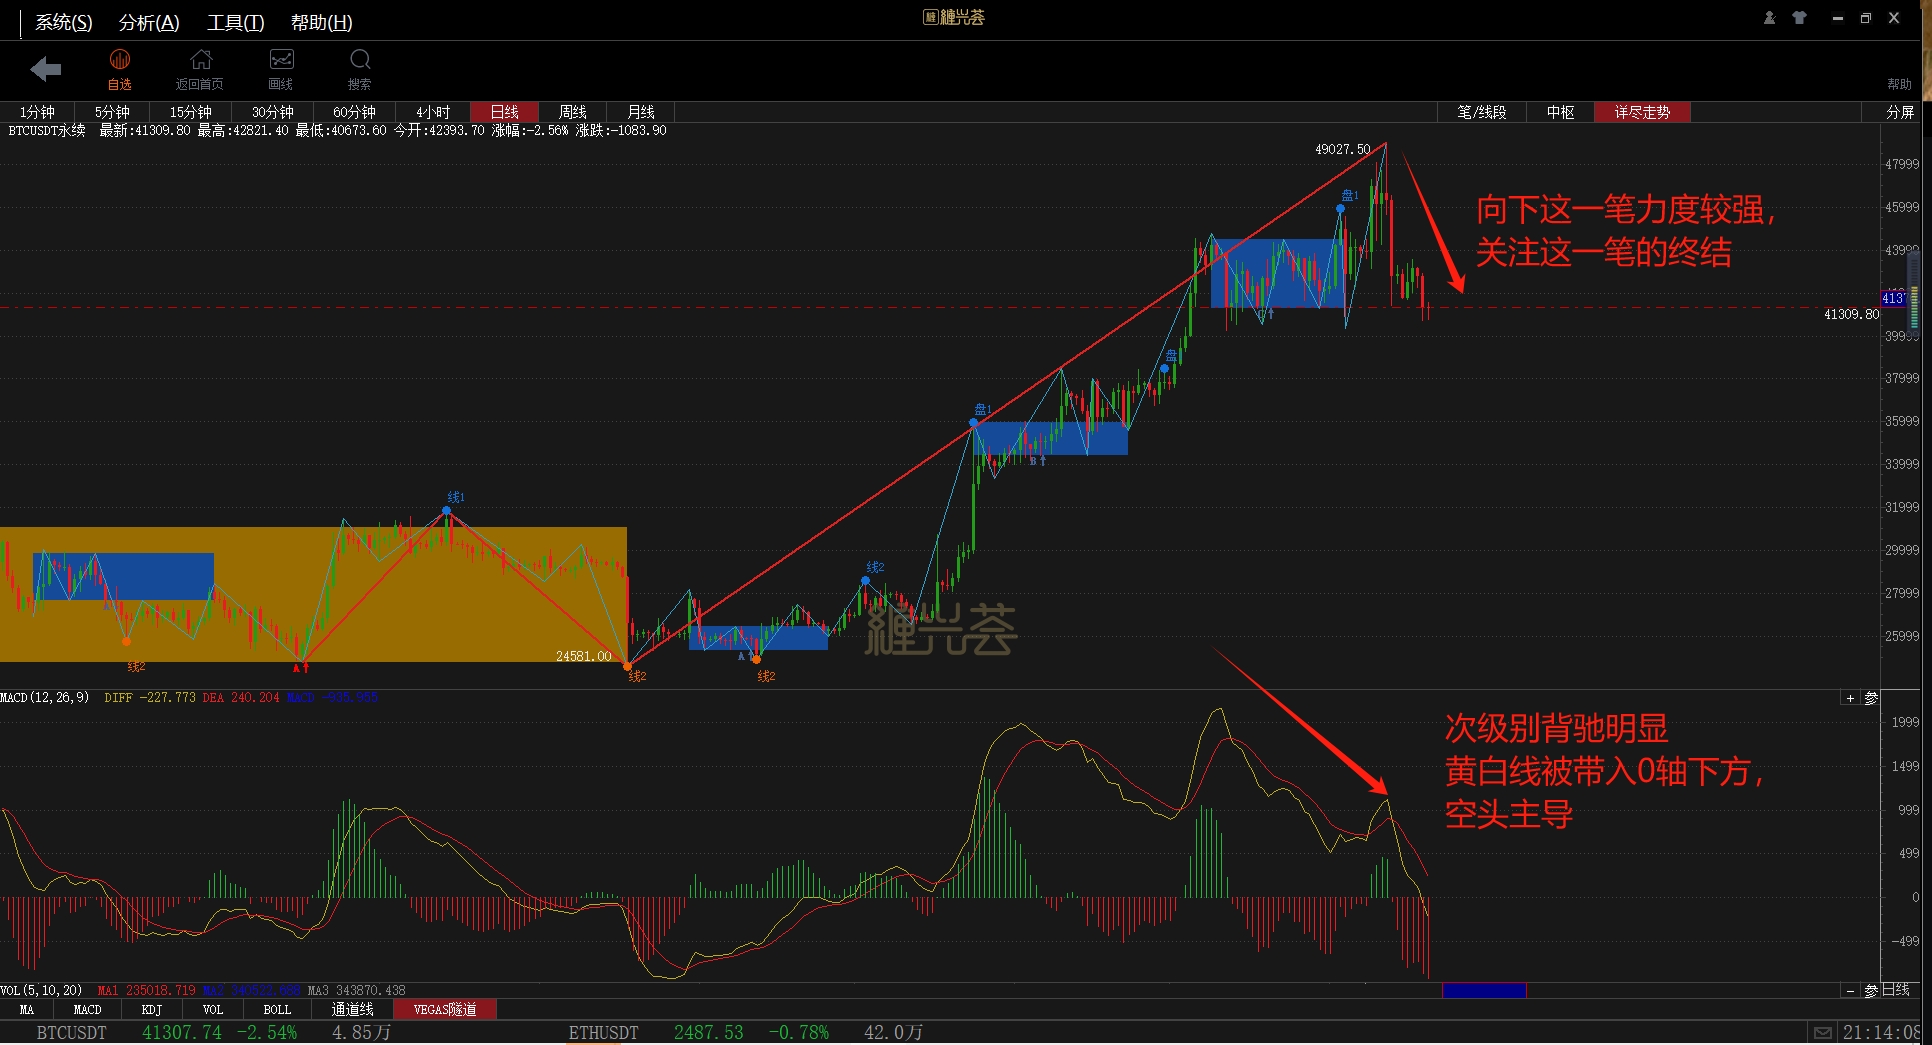
From the daily chart, after the formation of a strong top pattern on January 12th, the daily chart moved down as expected, and after several days of fluctuation, it eventually broke the low point near 41380 as scheduled, completing a downward 30-minute consolidation trend. This account has also been bearish in recent days, reminding everyone to be cautious of the risks. As for the next steps, please refer to the analysis in the following chart.
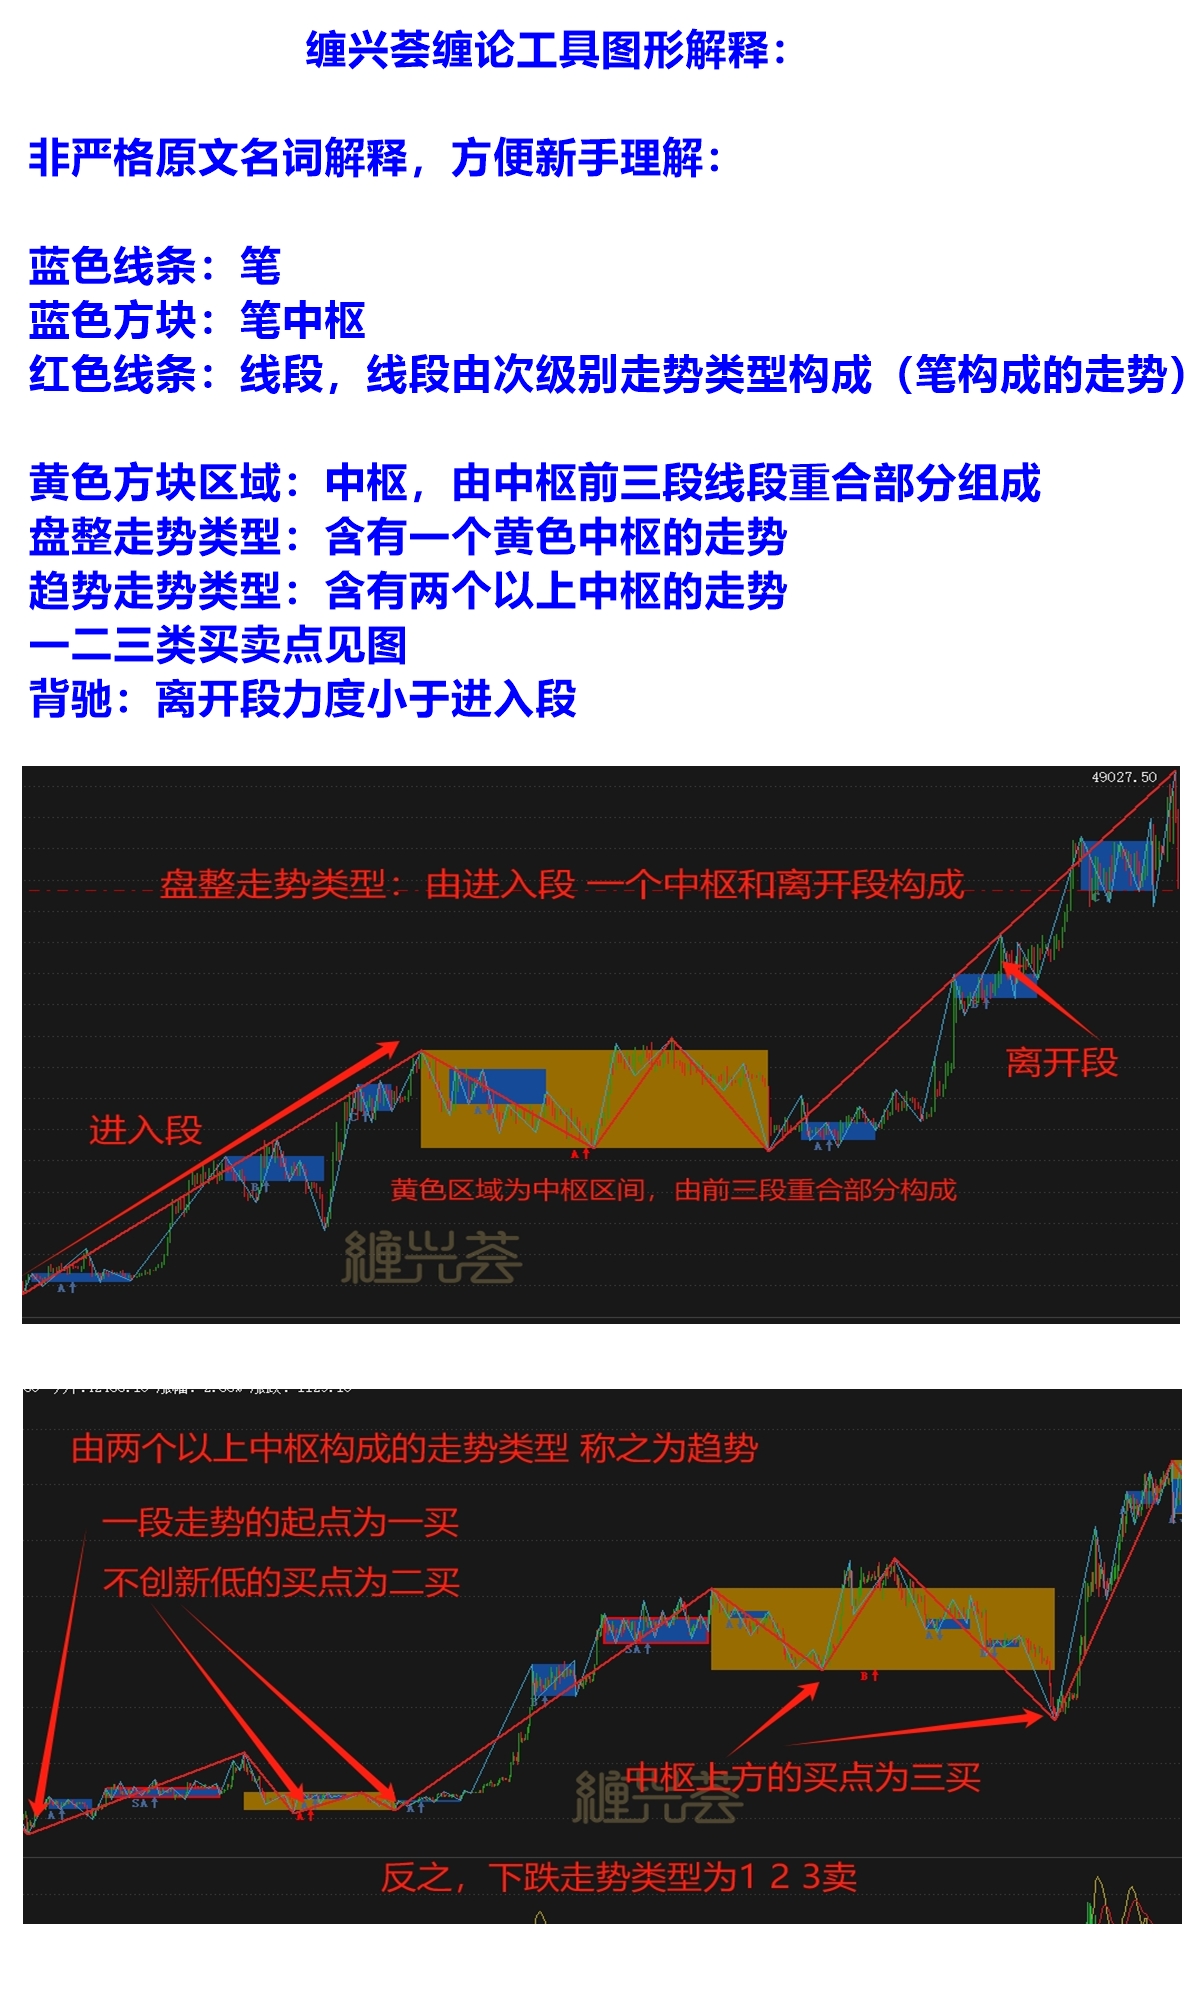
For easy understanding, here are some explanations of the terms:
From the daily chart, the current downward momentum is strong, and the MACD yellow line has crossed below the zero axis, indicating a high probability of initiating a daily chart counter-trend pullback. Therefore, at present, it is still necessary to be cautious about long positions in the rebound.
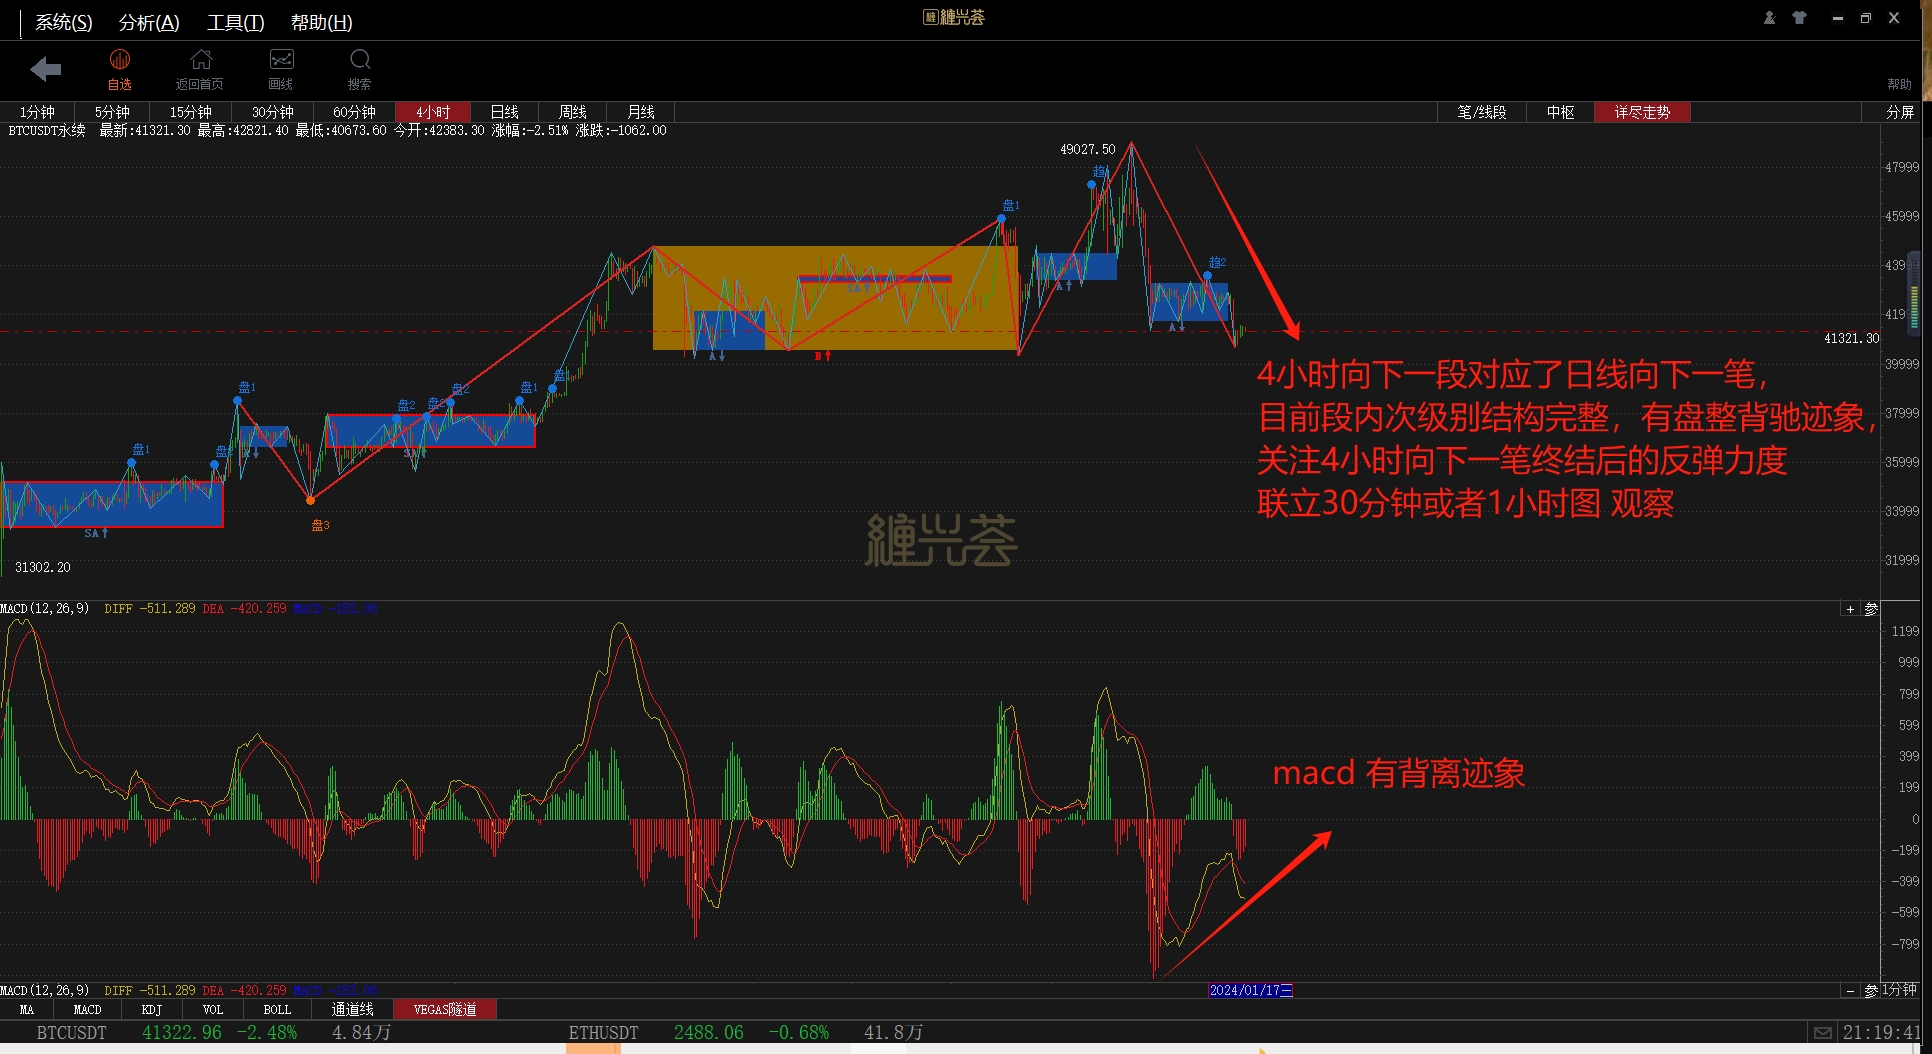
4-hour chart: After a complete downward segment, observe the strength of the rebound after the consolidation divergence. If a secondary level three-sell continues to be bearish, if a rebound followed by a non-new low occurs, then follow the long position first and see if a non-new high 4-hour level two-sell appears.
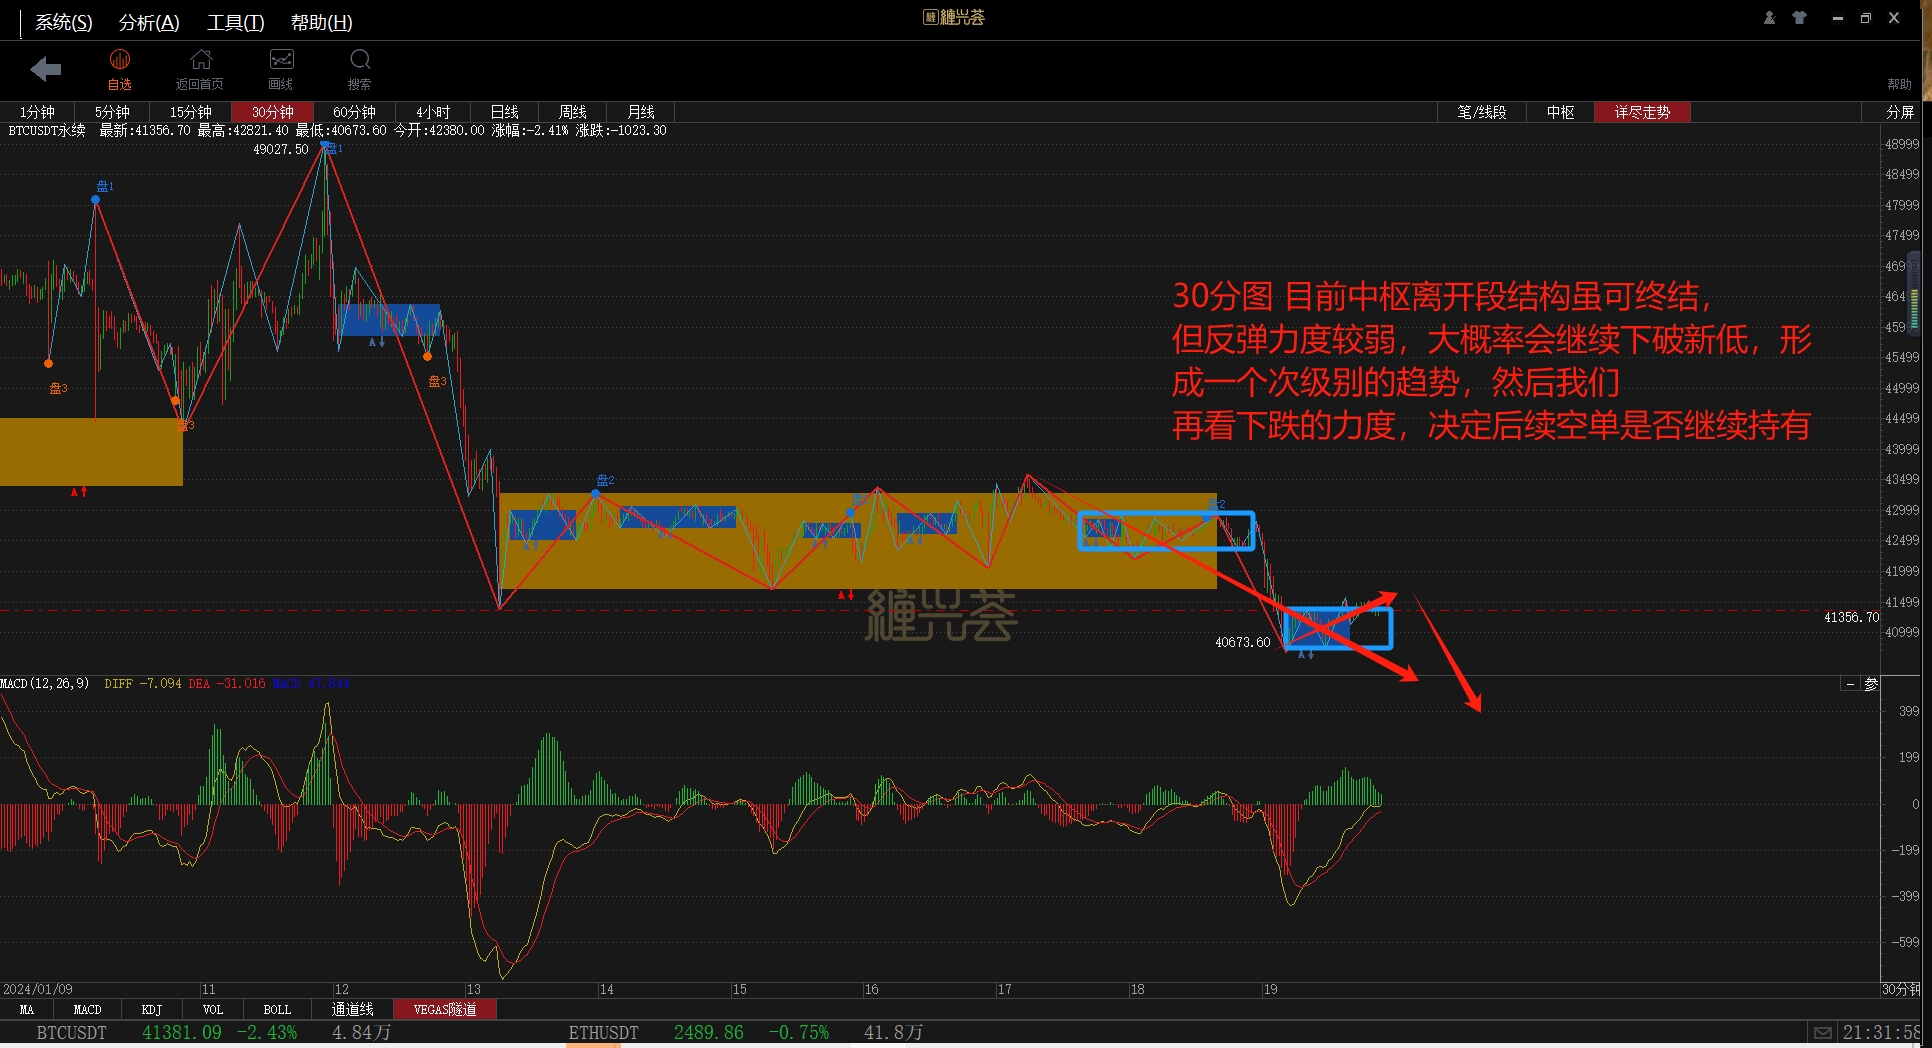
30-minute chart: The 30-minute trend corresponds to the downward segment of the 4-hour chart. The departure segment corresponds to a downward move in the 4-hour chart. Currently, from the chart, the departure segment structure is not complete, and those holding short positions can continue to observe.
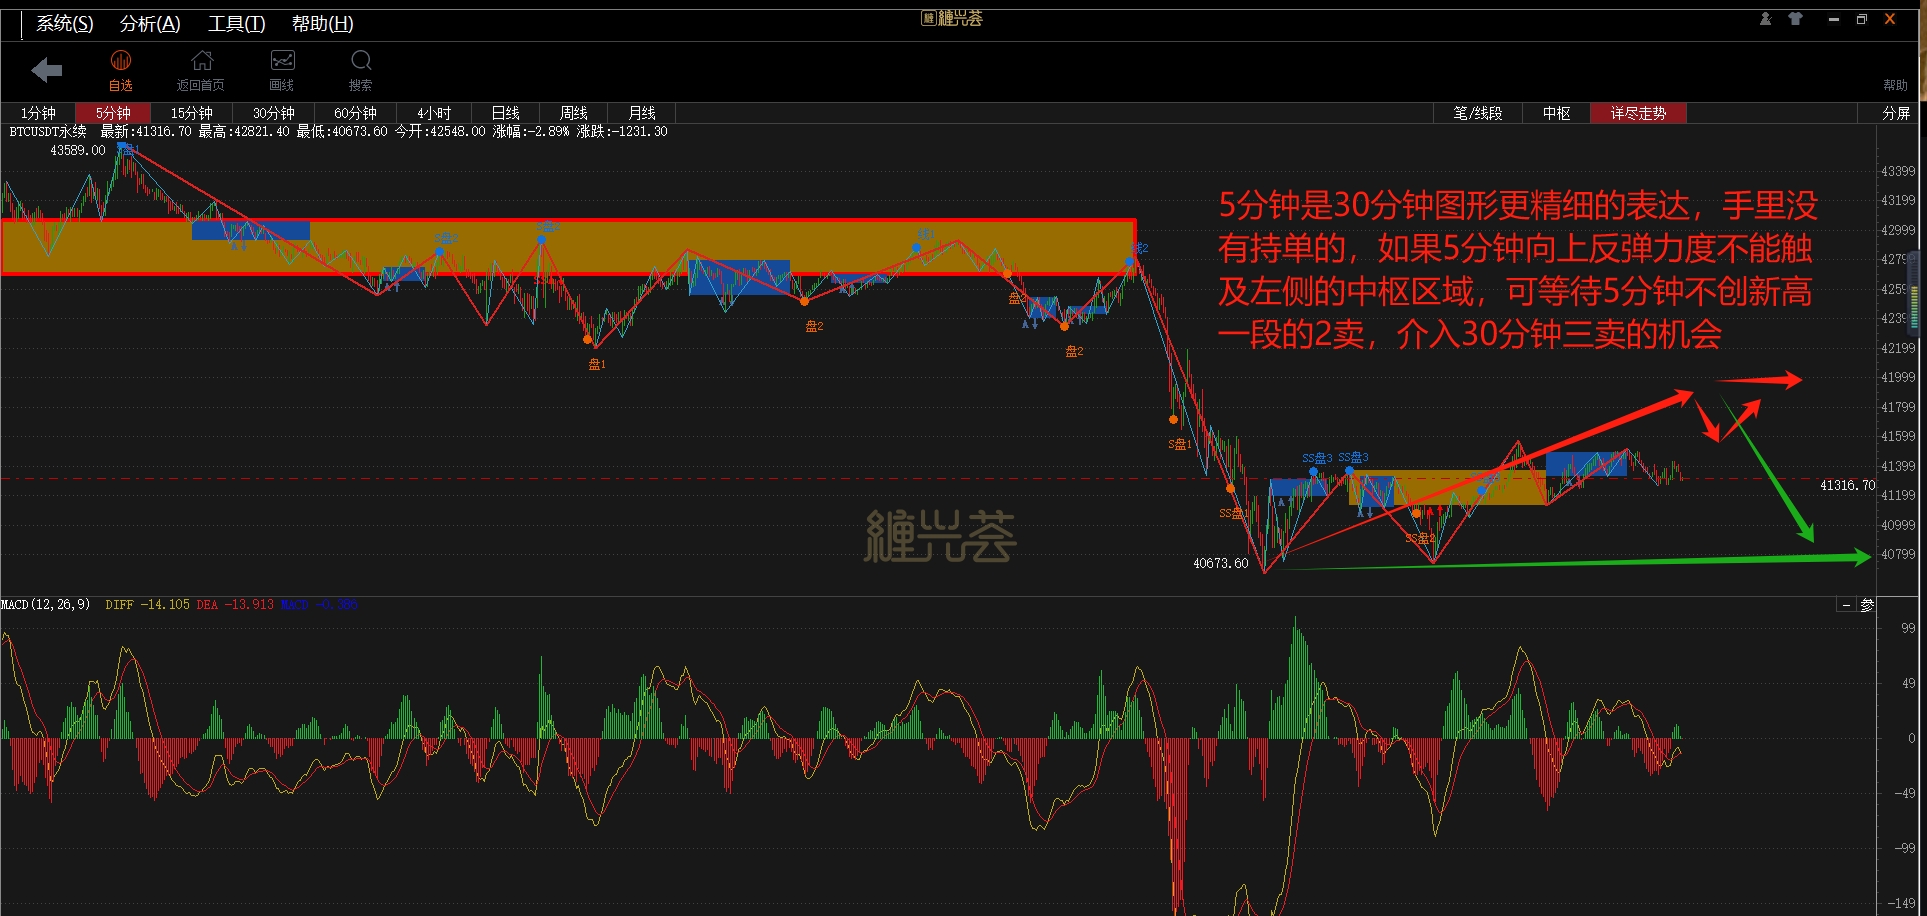
5-minute chart
Overall, the larger time frame is currently dominated by bearish sentiment. At least wait for the 30-minute trend type to end and for a non-new low two-buy to appear before considering long positions. Also, pay attention to the strength of the rebound. If it cannot continue to make new highs, be cautious of the 4-hour two-sell. At that time, continue to be bearish, and it is expected to be a daily chart counter-trend. It will also be the best opportunity for long-term bullish trends. Everyone can continue to follow this account and will definitely not let you miss out!
[Welcome everyone to actively leave comments. If you like my analysis, you can also leave the cryptocurrencies you want to analyze in the comment section.]
[If you also like the Chan theory and want to learn and exchange Chan theory, you can also search for CZSC1319 on WeChat to join the Chan Xing Hui community for more exciting market analysis and opportunities to share with you.]
免责声明:本文章仅代表作者个人观点,不代表本平台的立场和观点。本文章仅供信息分享,不构成对任何人的任何投资建议。用户与作者之间的任何争议,与本平台无关。如网页中刊载的文章或图片涉及侵权,请提供相关的权利证明和身份证明发送邮件到support@aicoin.com,本平台相关工作人员将会进行核查。


