Charts
DataOn-chain
VIP
Market Cap
API
Rankings
CoinOSNew
CoinClaw🦞
Language
  • 简体中文
  • 繁体中文
  • English
Leader in global market data applications, committed to providing valuable information more efficiently.

Features

  • Real-time Data
  • Special Features
  • AI Grid

Services

  • News
  • Open Data(API)
  • Institutional Services

Downloads

  • Desktop
  • Android
  • iOS

Contact Us

  • Chat Room
  • Business Email
  • Official Email
  • Official Verification

Join Community

  • Telegram
  • Twitter
  • Discord

© Copyright 2013-2026. All rights reserved.

简体繁體English
|Legacy

Analysis of the Key Points of BTC Price Trend and Important Nodes at Present

CN
森哥本森
Follow
2 years ago
AI summarizes in 5 seconds.

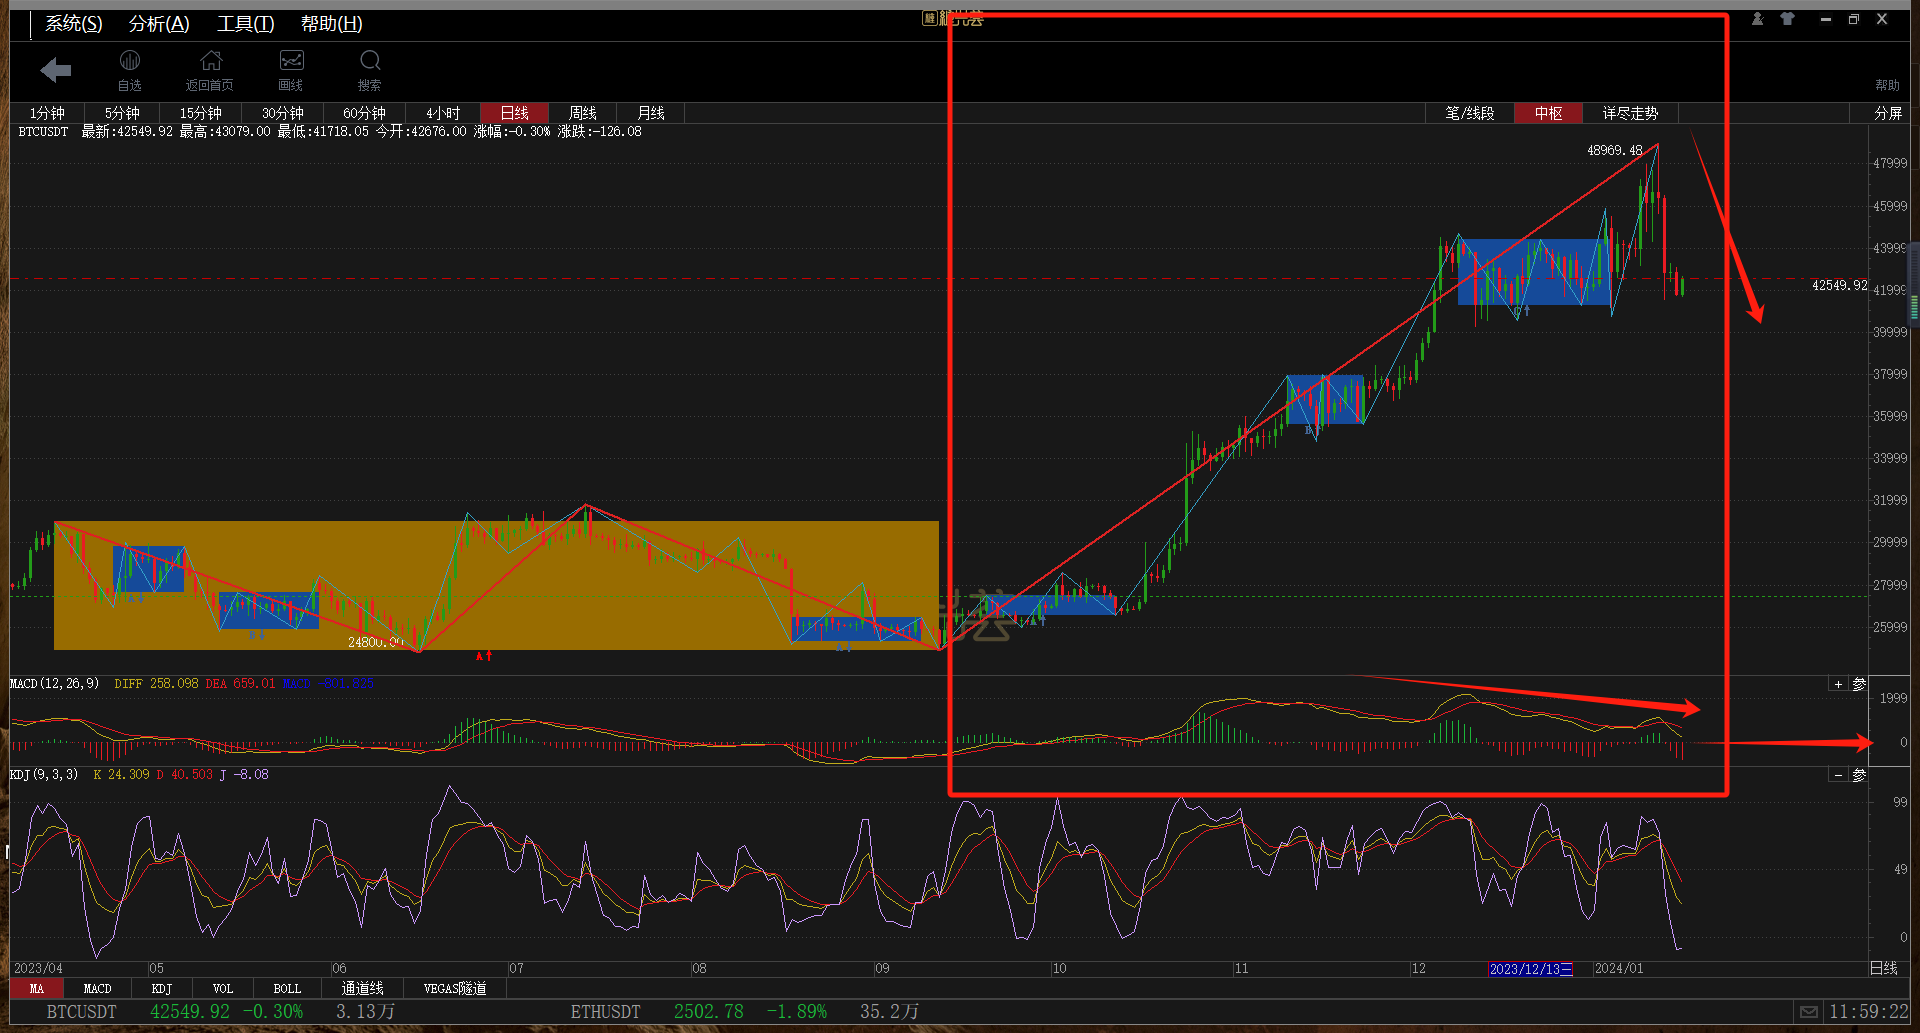
Daily chart: The bearish divergence within the upward segment has caused the current reverse pullback of a wave. Continue to follow the growth and completion of the downward wave, and pay attention to whether the MACD yellow line will break below the zero axis.

Image

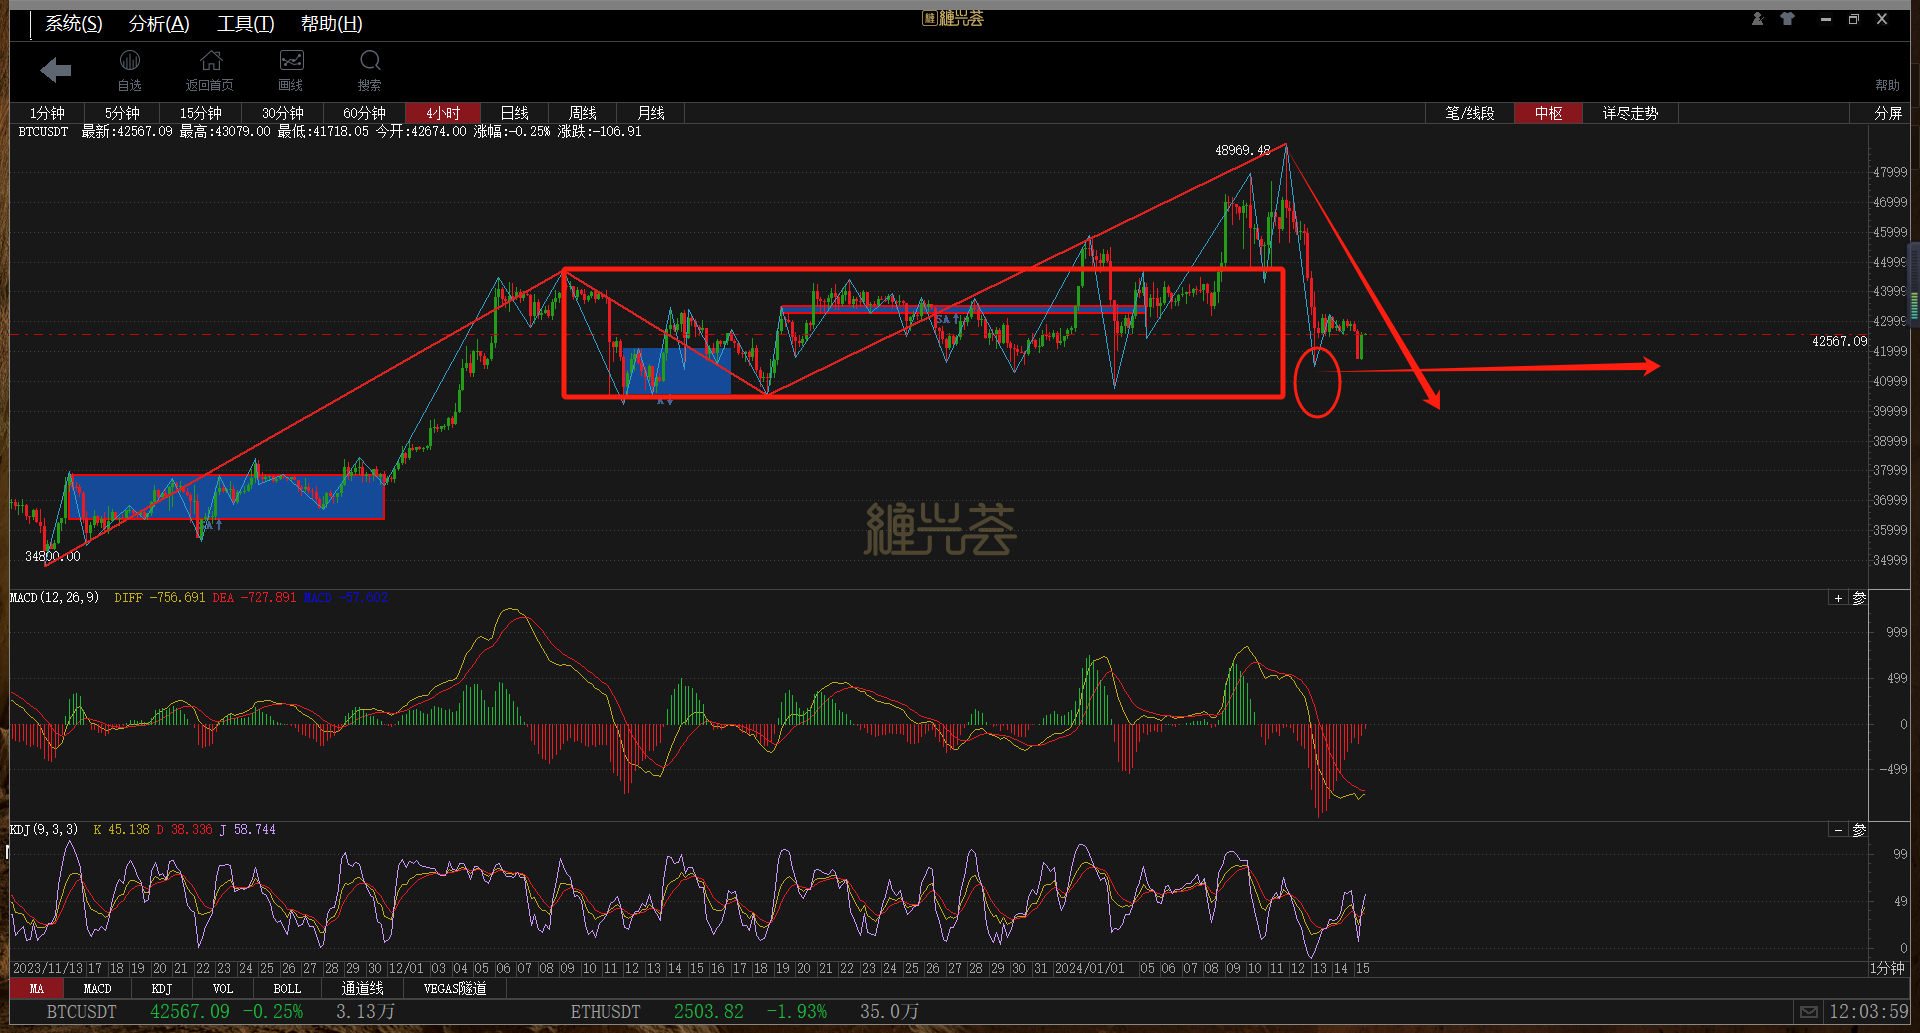
4-hour chart: Combined with the daily downward wave, follow the growth of the subsequent downward segment. The current strong downward momentum within the segment, incomplete structure, and the construction of a sub-level center. The low point at the circle is highly likely to be broken again. Reduce positions or hedge on the short side at the sub-level high, then decide on subsequent operations based on the completion of the structure. The red box area can be used as a reference.

Image

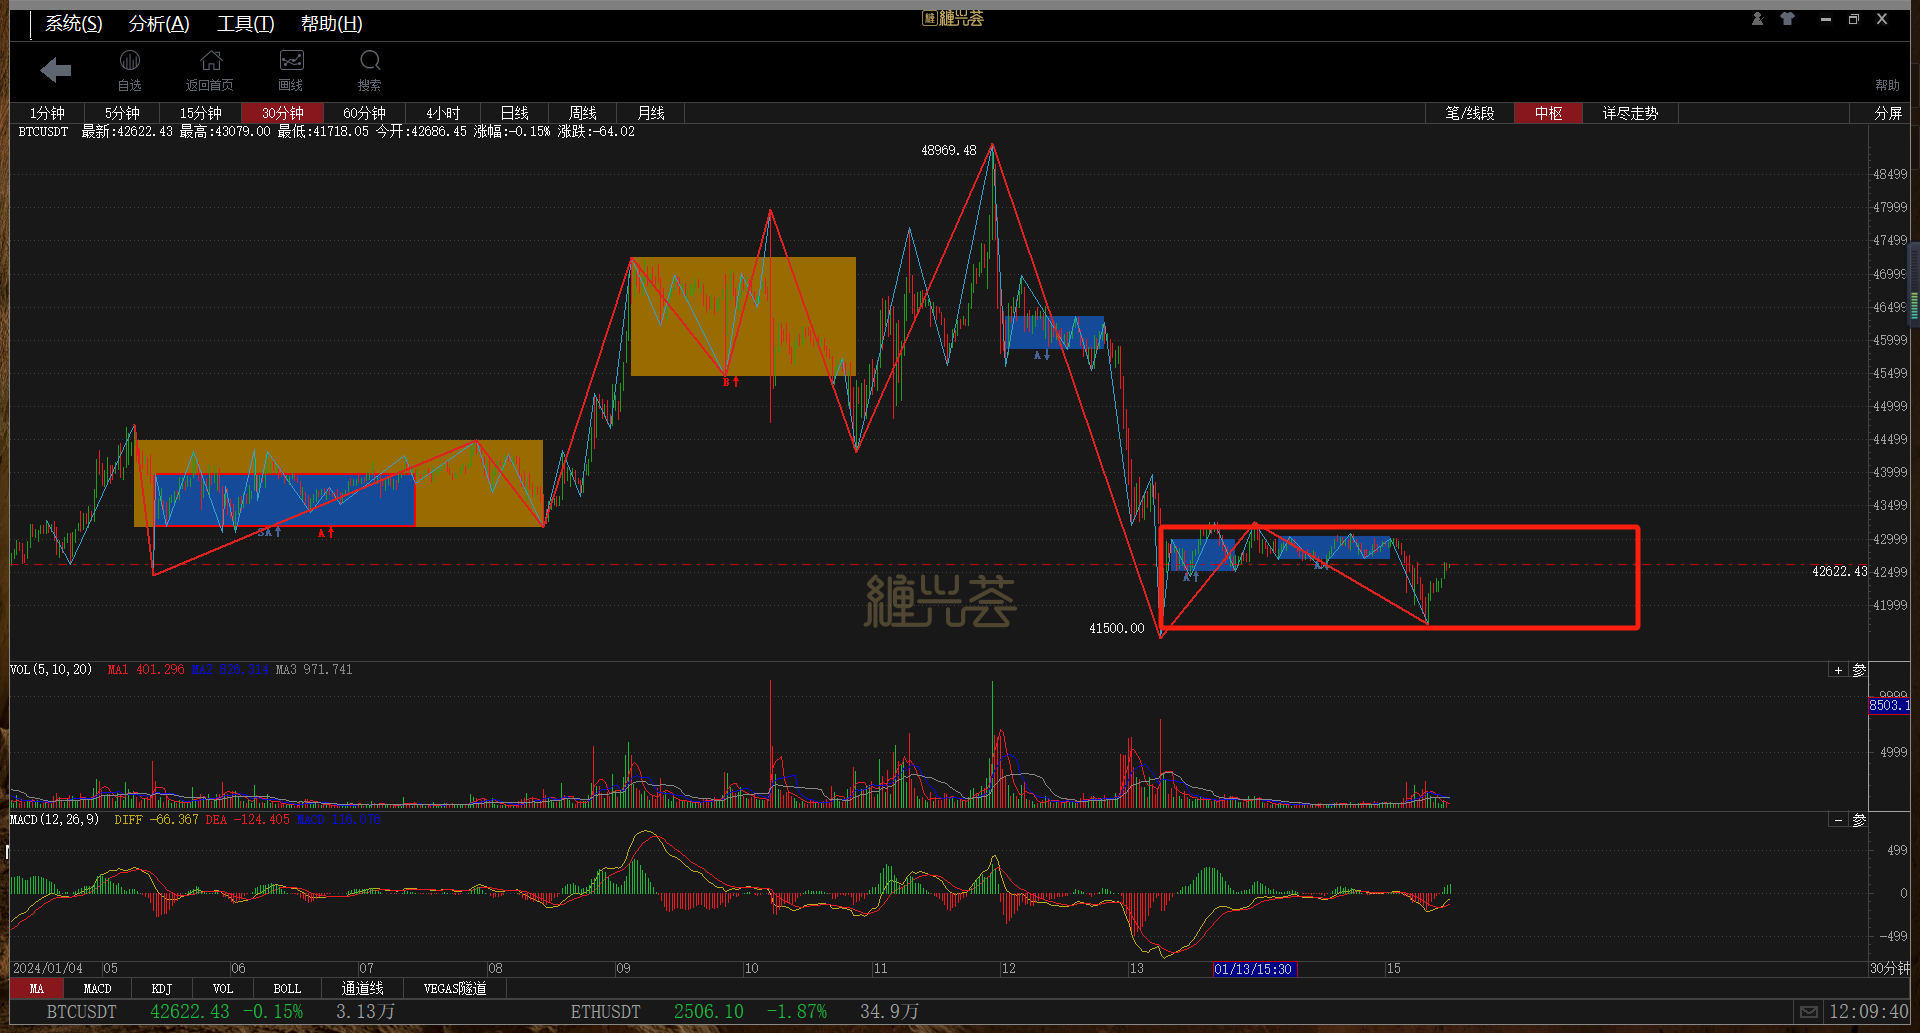
30-minute chart: The center is under construction, with a focus on shorting at lower levels. Pay attention to the strength after breaking 41500, and continue to follow the community strategy to avoid missing important reminders.

Image

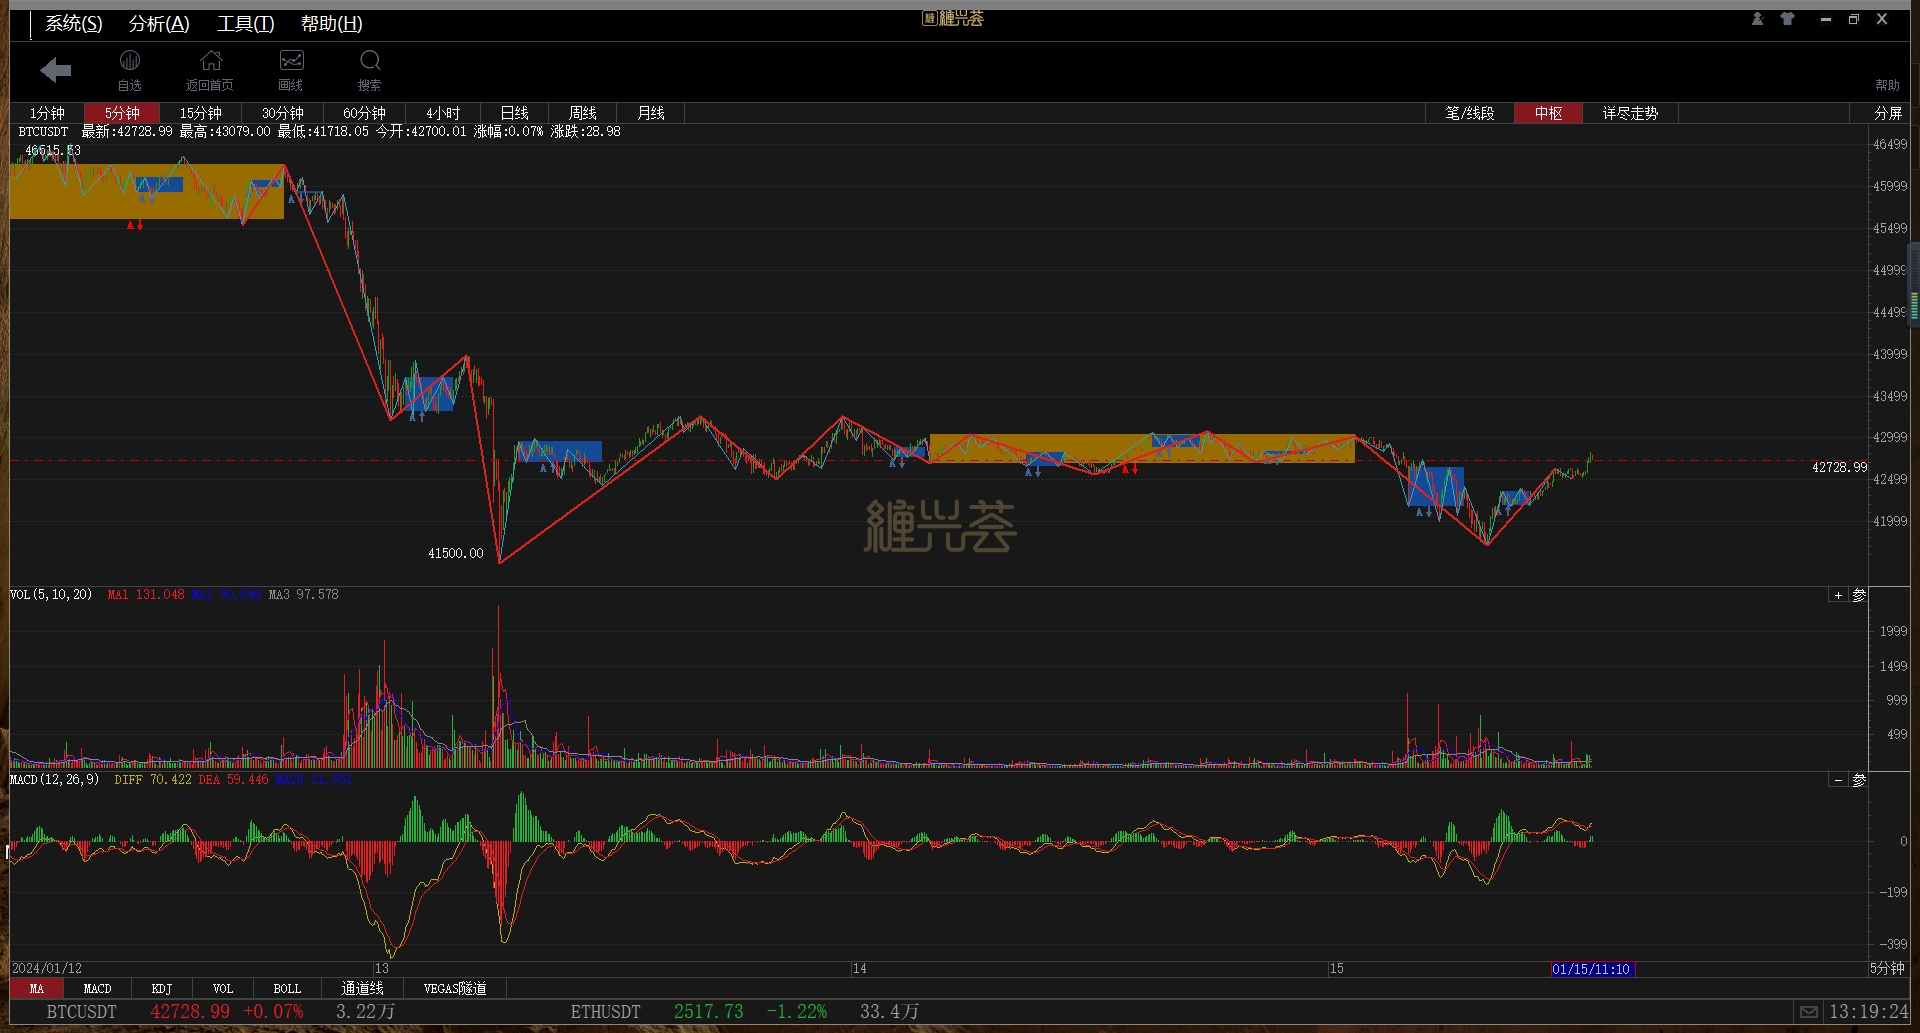
5-minute chart: Combined with 1-minute level operations, if a selling point appears at the 1-minute level, it is recommended to short first, and then consider a long position when a 5-minute level 2 buy signal appears.

Image

[Feel free to leave comments, and if you like my analysis, you can also leave the cryptocurrency you want to analyze in the comment section]

[If you also like the study and exchange of Chan theory, you can search "缠兴荟" on Baidu search engine to join our community]

免责声明:本文章仅代表作者个人观点,不代表本平台的立场和观点。本文章仅供信息分享,不构成对任何人的任何投资建议。用户与作者之间的任何争议,与本平台无关。如网页中刊载的文章或图片涉及侵权,请提供相关的权利证明和身份证明发送邮件到support@aicoin.com,本平台相关工作人员将会进行核查。

交易抽顶奢帐篷,赢小米新 SU7!
广告
|
|
APP
Windows
Mac
Share To

X

Telegram

Facebook

Reddit

CopyLink

|
|
APP
Windows
Mac
Share To

X

Telegram

Facebook

Reddit

CopyLink

Selected Articles by 森哥本森

2 years ago
Is BTC currently rebounding or reversing?
2 years ago
The daily chart of BTC is in an upward trend, pay attention to the strength of the rebound.
2 years ago
BTC hits a new low as expected, is it time for a rebound?
View More

Table of Contents

|
|
APP
Windows
Mac
Share To

X

Telegram

Facebook

Reddit

CopyLink

Related Articles

avatar
avatar币圈院士
3 hours ago
Cryptocurrency Circle Academician: 4.4 Ethereum Daily Line Bottoming Out, 4-Hour Volatility, Key Entry Points for Long and Short Positions! Latest Market Analysis and Ideas Reference.
avatar
avatar币圈院士
3 hours ago
Cryptocurrency Expert: The mid-term trend of Bitcoin at 4.4 is downward, with short-term fluctuations and bottoming out, key points in the long-short game! Latest market analysis and thought reference.
avatar
avatar周彦灵
5 hours ago
Zhou Yanling: 4.4 Bitcoin (BTC) Ethereum (ETH) Today's Latest Trend Forecast Analysis and Trading Strategy
avatar
avatar币圈丽盈
5 hours ago
Cryptocurrency Circle: 4.4 Ethereum is closely tied to the lower Bollinger band, hanging by a thread, with 2050 becoming the ultimate battleground for bulls and bears! Latest market analysis and trading suggestions.
avatar
avatar币圈丽盈
5 hours ago
Cryptocurrency Liying: Bitcoin bullish momentum weakens at 4.4, but moving average support remains intact. Is it a trap or an opportunity? Latest market analysis and trading advice.
APP
Windows
Mac

X

Telegram

Facebook

Reddit

CopyLink