Coin Waves: June 9 Bitcoin (BTC) Market Analysis Reference:
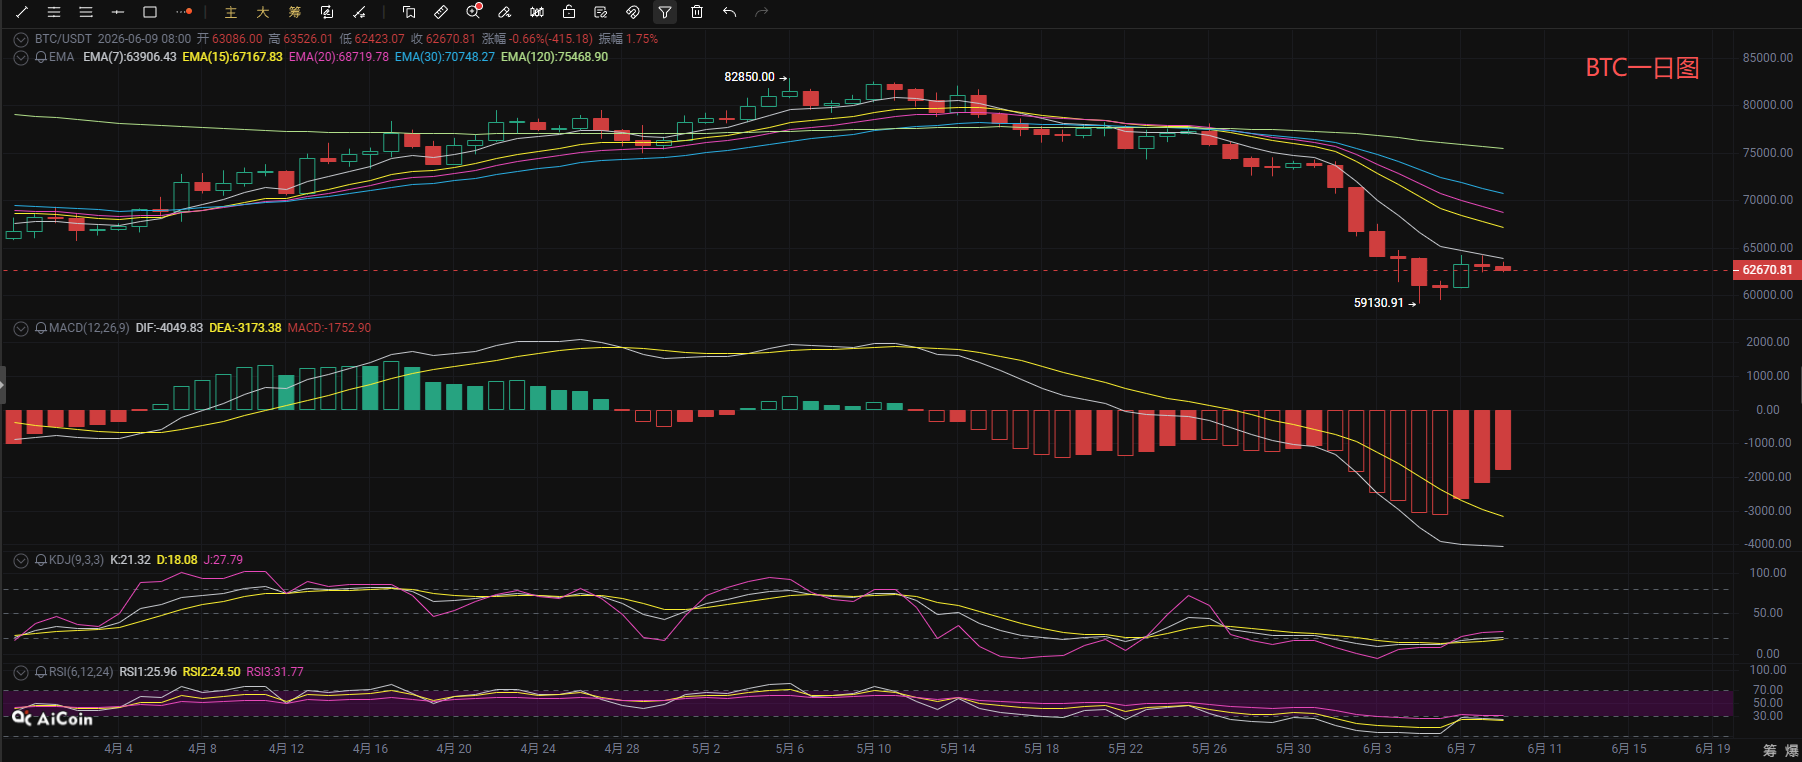
The current price of Bitcoin is 62700, overall in a weak oscillation pattern after a deep decline on the daily chart, with prices significantly retreating from their highs, dipping to a low of 59130. The current price is operating below the middle band of the Bollinger Bands, close to the upper bound of the lower band, while the Bollinger channel is opening downwards, indicating the bearish trend has not been reversed. All moving average systems are arranged in a bearish formation, with the 7/15/20/30/120-day moving averages imposing layers of resistance, creating significant pressure above; the MACD indicator's DIF remains below DEA, although the bars have shrunk, the bearish trend has not dissipated; the KDJ values, although on the verge of overselling, have not turned upwards; all three lines of the RSI are below 40 in a weak area, with no significant bullish recovery signals. In the short term, the daily chart indicates a slight stop-loss and base-building after a major decline, with no reversal foundation. The support must hold at 59130 to allow for a wide oscillation space; once this low point is broken, the downside will open up again.
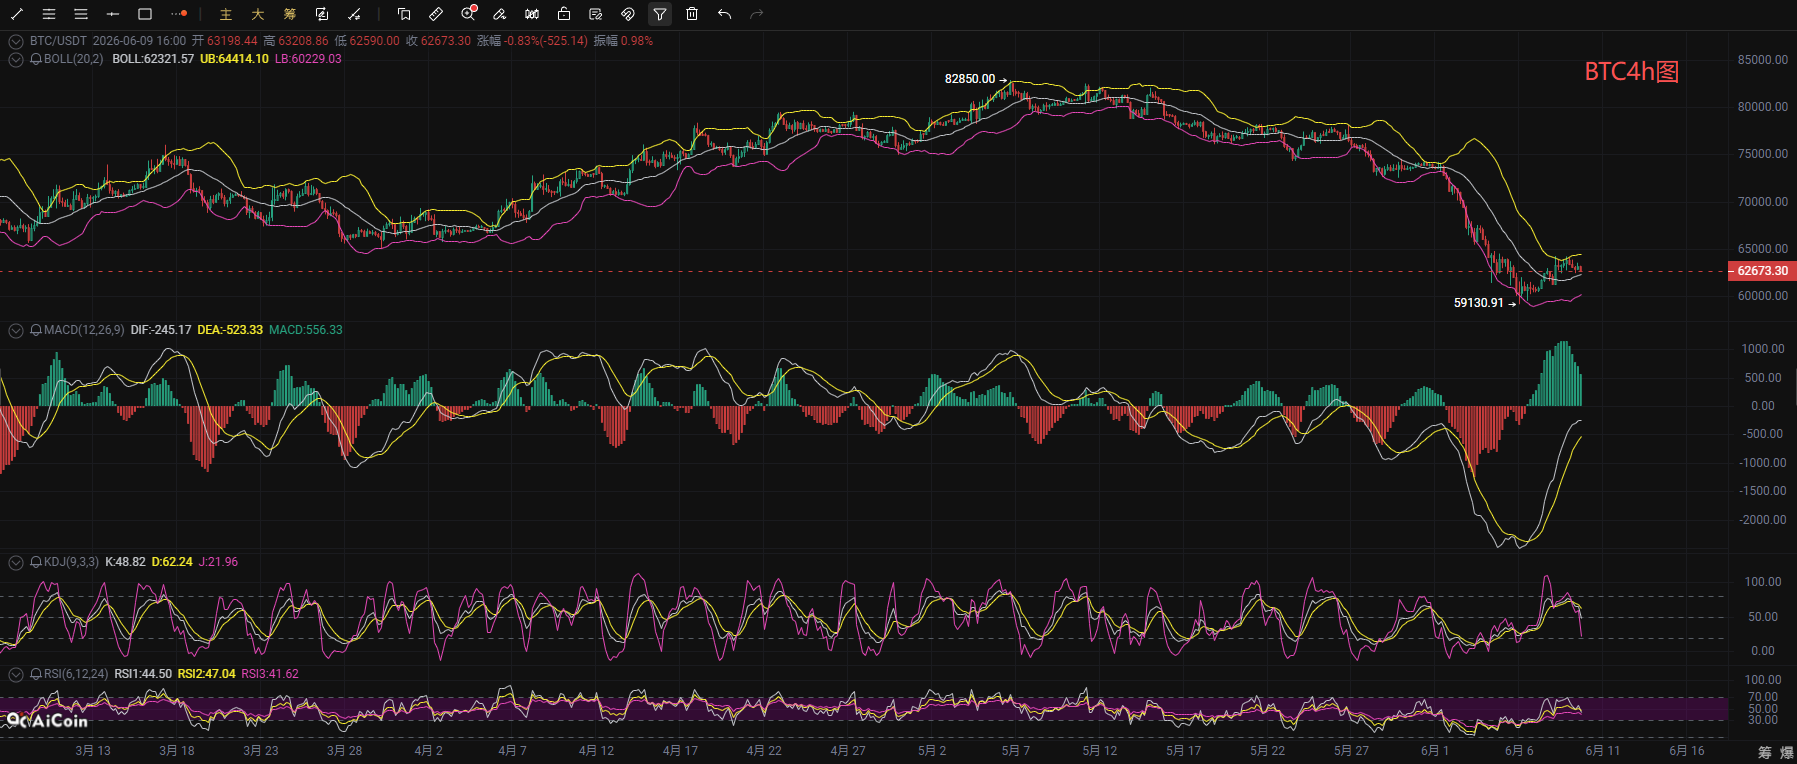
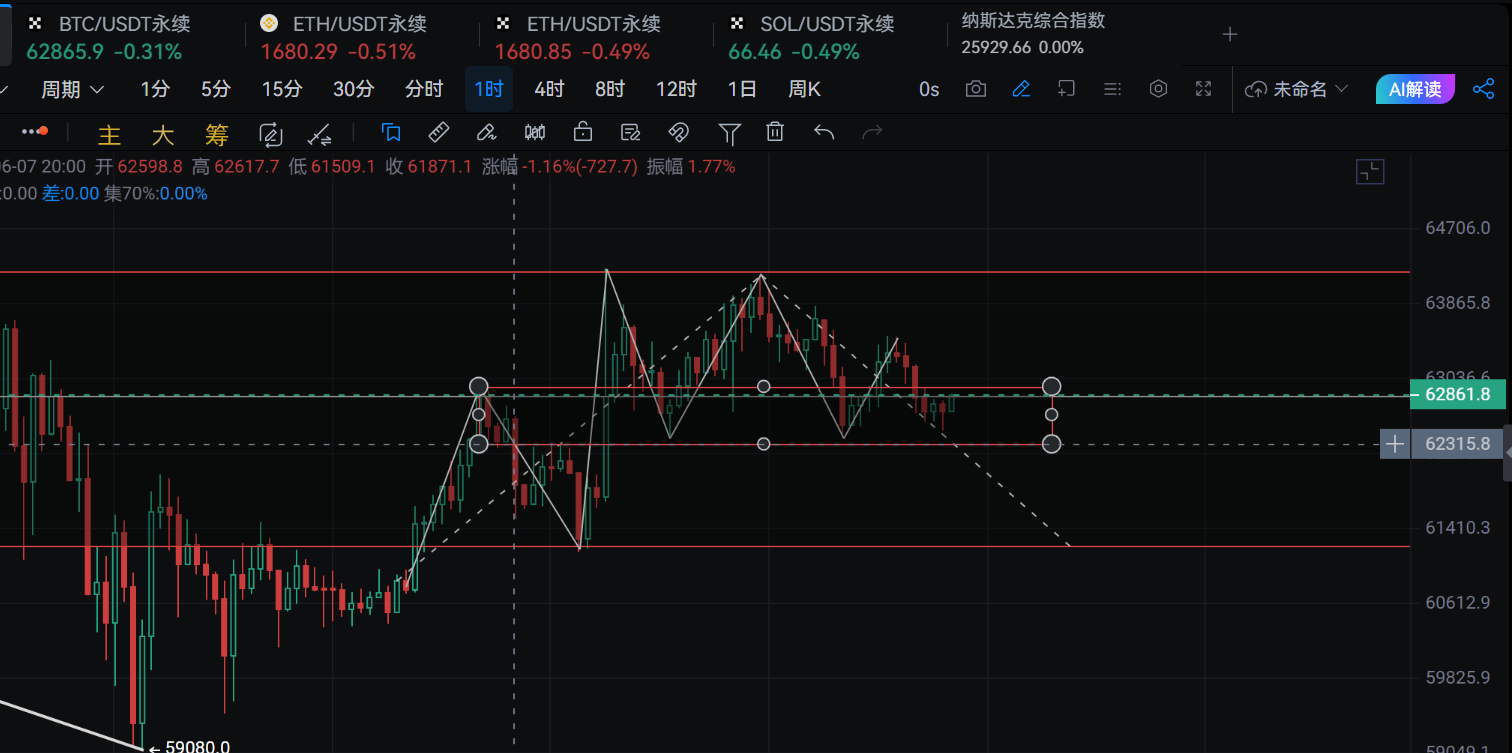
In the short-term 4-hour chart, prices have rebounded from 59130, currently under pressure below the upper Bollinger band. The Bollinger Band channel is no longer sloping downwards, but the price has fallen below the EMA moving average, the bars have begun to gradually shrink, and the DIF shows signs of turning downwards. The J line in the KDJ indicator has rapidly dropped down, and the RSI is also weakening, indicating that the rebound momentum is clearly exhausted. The 1-hour chart shows weaker trends, with prices peaking slightly at 64200 before continuing to oscillate downward, with the market under pressure from all short-term EMA moving averages. After the Bollinger Band has flattened, it begins to show signs of downward inclination; the MACD has turned negative, short-term bearish momentum is re-accumulating, the KDJ has formed a death cross downward, and the RSI is also declining. The small cycle resonance is biased towards weakness, and in the short term, there is a high probability that prices will first retest the support around 62000; if that support fails, they will test the 60000 level again; only if the price stabilizes above 63300 on the 1-hour chart and above the upper Bollinger band at 64415 on the 4-hour chart, can the small cycle rebound continue; otherwise, it will revert to the bearish trend dominated by the daily chart.
Coin Waves: June 9 Bitcoin Short-term Reference:
Long position: 60000-61000 range long, stop loss below 59000, target at 61500-62500-63500,
Short position: 64500-63700 range short, stop loss above 65500, target at 63000-62000-61000,
Coin Waves: June 9 Ethereum Short-term Reference:
Short position: 1730-1700 range short, stop loss 30 points, target at 1670-1620,
Long position: 1600-1630 range long, stop loss 30 points, target at 1660-1710,
[The above analysis and strategies are for reference only, risks are to be borne by oneself. Article review and publishing may have delays, and strategies may not be timely; do not operate blindly.]

This content is original sharing by [Coin Waves], representing personal views only. The article may be delayed in sending, for reference only, do not operate blindly! Want to get more daily real-time signals? Then follow my official account! Here, you can engage in online technical learning, and also understand related knowledge of solving and exiting positions. I have years of research experience in the market, focusing on the major trends in the cryptocurrency space. Mainly responsible for analyzing and guiding investment operations for BTC, ETH, SOL, BCH, and other coins. Welcome to study and research together.
免责声明:本文章仅代表作者个人观点,不代表本平台的立场和观点。本文章仅供信息分享,不构成对任何人的任何投资建议。用户与作者之间的任何争议,与本平台无关。如网页中刊载的文章或图片涉及侵权,请提供相关的权利证明和身份证明发送邮件到support@aicoin.com,本平台相关工作人员将会进行核查。