Core Conclusions
May was a transfer of pricing power occurring twice. First, the risk-free interest rate reclaimed pricing power from the crypto narrative, thoroughly exposing Bitcoin's high β attribute; then, following a dual easing of interest rates and geopolitical tensions at the end of the month, the internal capital outflow within the cryptocurrency market and holders cutting losses took over the price control.
In terms of price, BTC reached a high of $82,850 at the beginning of the month, then faced pressure and continuously retreated, closing at $73,674 at the end of the month, marking a one-way downward trend throughout the month. The most noteworthy moment was the last week — while the external environment significantly turned to easing, the crypto market refused to accommodate. This is a textbook example of "liquidity transmission failure" and a typical case of brutal bear market characteristics.
The internal cryptocurrency market deteriorated simultaneously on three fronts, which is the real root cause of the decline in May:
· First is the dual bloodletting of incremental funds. BTC spot ETFs had a net outflow of $2.425 billion for the entire month, which is the third largest monthly outflow since the inception of BTC ETFs (only behind $3.555 billion in February 2025 and $3.481 billion in November 2025), coinciding with a contraction in stablecoin supply.
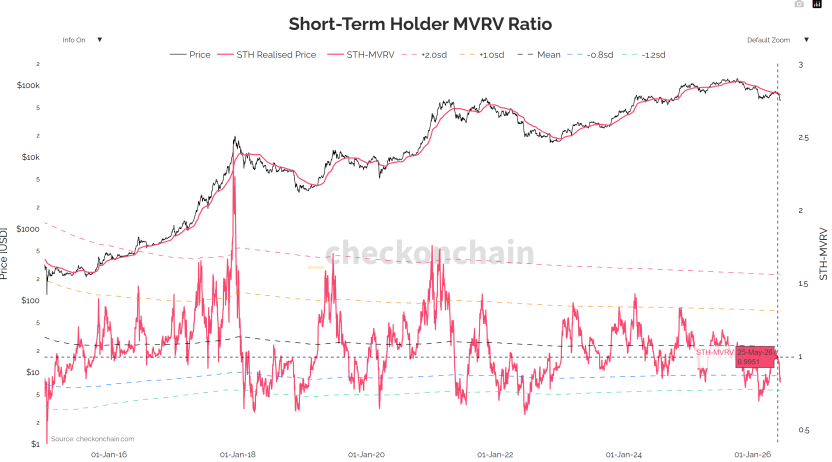
· Second is the surrender and loss-cutting by holders. Short-term holders' MVRV fell below the 1.0 balance line, entering the loss area, presenting a textbook-style surrender pattern on-chain. 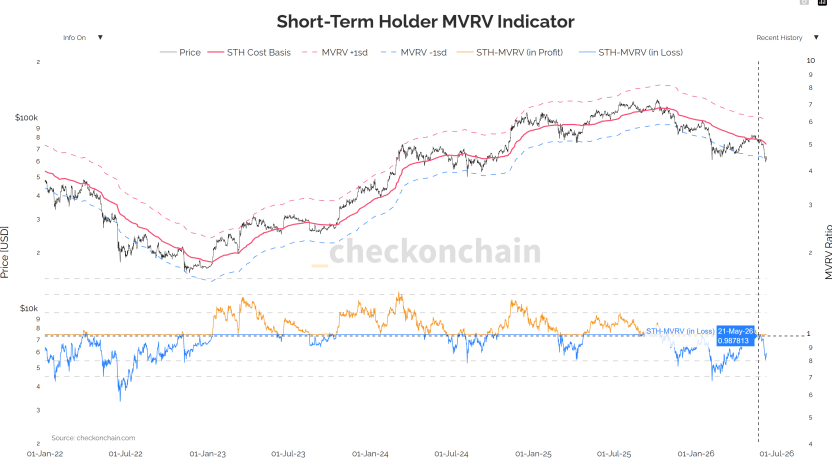
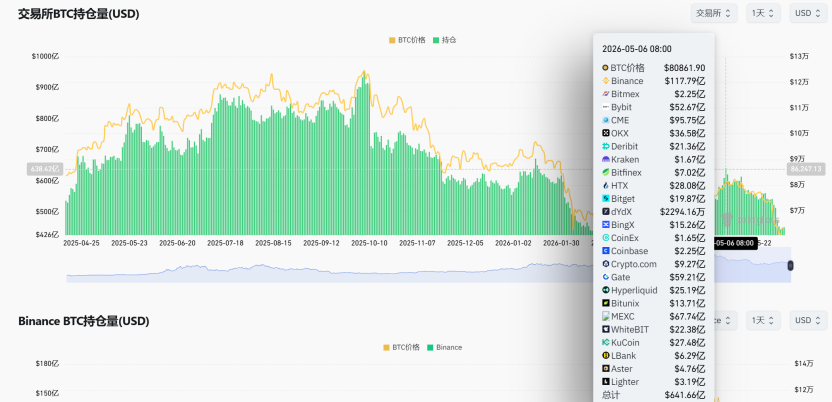
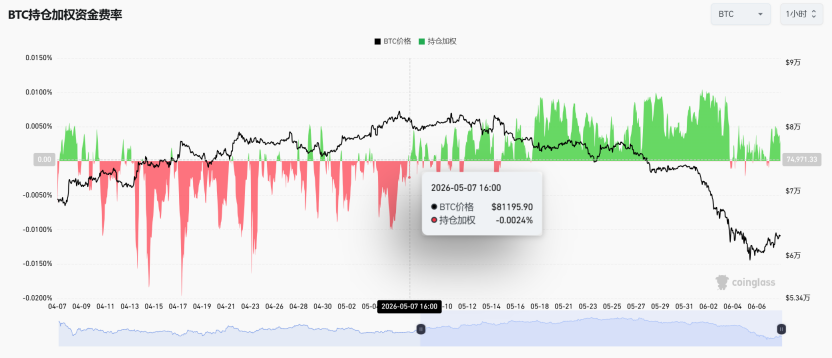
· Third is the derivatives bulls increasing leverage against the trend. Open interest rose against the trend to over $64 billion, and the funding rate turned positive, ultimately resulting in a $307 million long liquidation (with shorts only at $90 million), completing a tragic deleveraging process.
May marked the "start" of a new round of independent decline after the end of the rebound continuation, and is an "acceleration stage" of deep bear market clearance at the cycle level. When it will stop is no longer dependent on macro factors, but on whether off-market funds can stem the bleeding and whether longer-term holders can slow their sell-off.
1. Macro and Geopolitical: Two Transfers of Pricing Power and Broken Transmission in the Last Week
Phase I: Inflation's Second Rebound and Easing Expectations Reversed
The April CPI on May 12 was the first turning point of the month. It appeared mild on the surface, but the structure was deteriorating — core service inflation (the super core) accelerated for the third consecutive month, directly tied to employment and wages, making it the stickiest dimension. The next day, the April PPI surged to 6.0%, a new high since the end of 2022; at the same time, China's PPI turned positive for the first time after 41 months of stagnation, signaling the end of the "China commodity deflation" that had suppressed global inflation for two years.
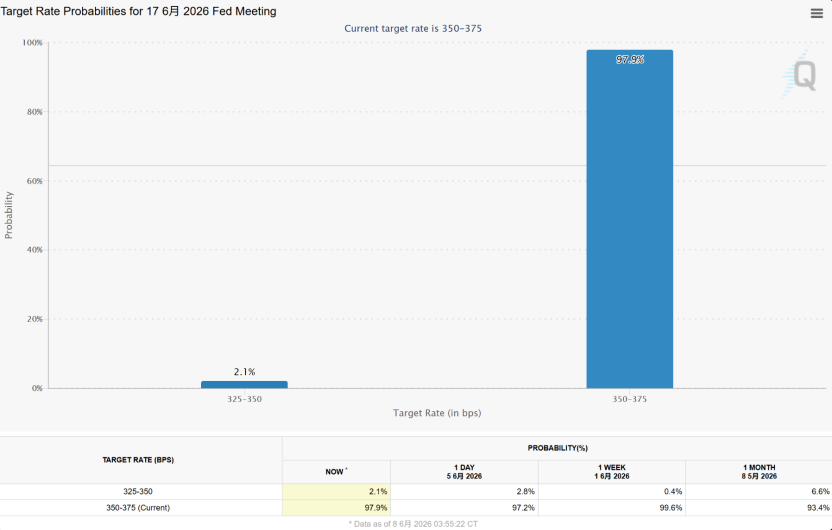
The market's focus shifted paradigmatically: from "when will interest rates be cut" to "how much will rates increase?". It should be clarified that in terms of timing, recent meetings almost have no discussion on rate hikes (CME shows over 99.4% probability of no change in June), but the policy path has been significantly revised upwards at the tail end. The market no longer believes in automatic rate cuts and has shifted to pricing "forced rate hikes". This reversal alone is sufficient to systematically raise the discount rates of all high β assets.
Phase II: Fed Personnel Earthquake and Instability of the Response Function
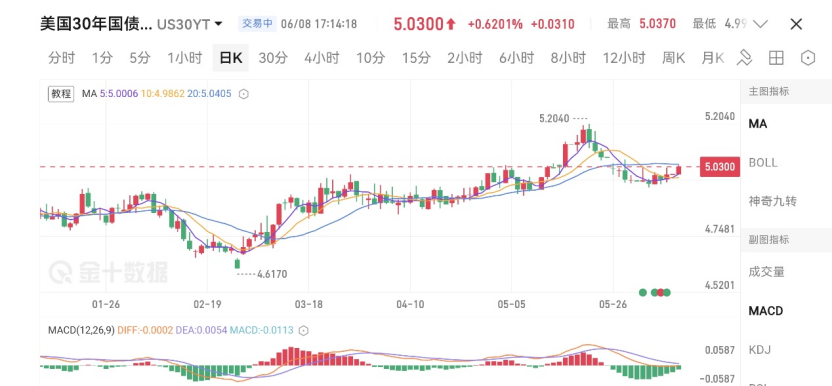
On May 15, reformist Waller officially took charge of the Federal Reserve, promoting a "de-transparency" agenda to abolish the dot plot and cancel press releases. On the same day, the outgoing chair broke a 75-year tradition of the Fed, announcing the retention of a board position until 2028 for internal checks and balances. This marks the deepest internal power split in the Fed since 1951. Its market implication lies not in a struggle over policy routes but in a significant drop in the predictability of the response function. The bond market responded directly: the 30-year U.S. Treasury yield surged to 5.19%, a new high since the subprime crisis; the U.S. dollar index reached a six-week high. For assets valued based on discounted cash flows, this was a direct and unavoidable blow.
Phase III: Geopolitical Thaw but Broken Transmission Chain
Geopolitics was the core disturbance in May's oil prices, and thus the inflation path, going through four phases: "easing — fading — escalation — thawing". At the beginning of the month, easing statements caused WTI to drop more than 7% in a single day, and BTC first broke the $80,000 mark; by mid-month, U.S.-Iran negotiations fell into a deadlock; towards the end of the month, conflicts escalated frequently, with Brent hovering between $107 and $111. The end of the month saw a plot twist — on May 28, the U.S. and Iran reached a memorandum for a 60-day ceasefire, with "unrestricted passage" through Hormuz and Iran clearing underwater mines, leading to a significant reduction in geopolitical premiums, with WTI closing at $88.53.
Entering the last week, the negative feedback loop from mid-month, "geopolitical tension → high oil prices → sticky inflation → rate hike expectations → stronger dollar and U.S. bonds → pressure on risk assets", was sharply interrupted: the yield on 10-year U.S. Treasury bonds fell approximately 11 basis points to 4.45%, and the dollar index dropped to 98.91; the S&P rose 1.43% in a week, and the Nasdaq rose 2.39%, both hitting new closing highs, while the Nikkei surged over 1200 points in a single day. Normally, this combination of "interest rates dropping, oil prices dropping, the dollar dropping, and the stock market rising" should significantly support cryptocurrencies, but the market refused to accommodate. This is a clear sign of crypto turning negative.
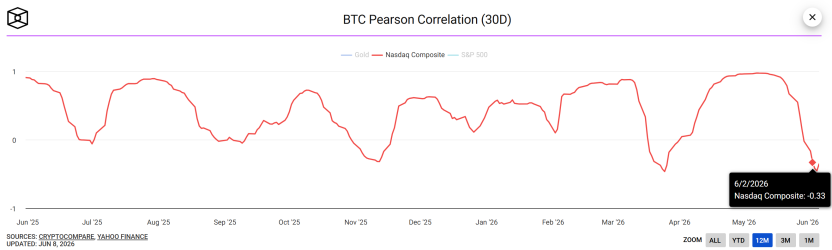
The total reset of correlation reinforced this point. Mid-month, Asia-Pacific risk preference (with Korea's KOSPI falling 5% triggering a trading halt) briefly caused BTC's correlation with the Nasdaq to rise, but entering late month, the 30-day rolling correlation coefficient between BTC and Nasdaq fell sharply and turned deeply negative, reaching a new low not seen in nearly a year. The same macro benefits have diverted towards completely different fates: while the stock market rose collectively, the crypto market dropped independently, evidencing this deep negative correlation.
This decoupling has dual implications. In the short term, it is an objective confirmation of "internal clearance dominance" — the crypto market is no longer synchronized with macro risk preferences, but is driven by its own funding situation and holding structure. In the medium term, it suggests that even if U.S. stocks continue to hit new highs, their influence on crypto will be extremely limited. However, a level of medium-term caution remains: Goldman Sachs warns that global visible oil inventories are down to only 73 days of demand, and geopolitical easing does not equal peak oil prices. The underlying concerns regarding inflation are still present; what will be the impact on risk assets?
2. Funds Flow: Monthly ETF Reversal, Coinbase Premium Deterioration
This is the most directionally significant part of the month, and the most direct evidence of "internal bloodletting".
Monthly ETF Fund Flow, a Complete Reversal from April Net Inflows to Significant Net Outflows in May
Let’s start with BTC spot ETFs. In April, the single month net inflow was $1.966 billion, bringing cumulative net inflow to a historic peak of $58.088 billion, with total net assets breaking the $100 billion mark at $100.532 billion. As May entered, the fund flow completely reversed — the entire month saw a net outflow of $2.425 billion, the third largest monthly net outflow since the product's inception, only behind February 2025 (-$3.555 billion) and November 2025 (-$3.481 billion); cumulative net inflow fell to $55.663 billion, and total net assets shrank to $94.169 billion, evaporating over $6.4 billion in a single month.
The key point is that this was a gradual amplification within the month rather than a one-time shock: by mid-May, cumulative net outflow had reached approximately $1.417 billion, which further expanded to $2.425 billion by the end of the month. Funds not only failed to stabilize but accelerated their outflow towards the end of the month.
ETH spot ETFs confirmed this in parallel: April still saw a net inflow of $356 million, with a total net value of $13.253 billion; however, in May, it turned to a net outflow of $541 million, also ranking as the third-largest monthly outflow in history (only behind $1.424 billion in November 2025 and $617 million in December), with cumulative net inflow declining to $11.37 billion and total net value shrinking to $11.266 billion. Both BTC and ETH saw net inflows in April and significant net outflows in May, both setting new records for third-largest monthly outflows — this reflects a systematic reduction in institutional allocation across the entire cryptocurrency asset class.
The conclusion is clear: the narrative of "ETF marginal buying" that dominated the entire upward cycle since the halving has factually retreated in May. The most important incremental channel has turned from "funding engine" in April to "water pump" in May.
Coinbase Premium, from Positive Premium in April to Severe Negative Premium in May
The Coinbase premium index is the most direct window to identify the buying and selling power of domestic institutions in the U.S. In April, this index primarily showed positive premiums (green), with U.S. institutions net buying on most trading days; this formed the foundation of the spot side of the April rebound. Entering May, the index almost entirely switched to negative premiums (red) with severe degrees — as seen in the chart, the negative premium range continued to expand, deeply approaching -0.22% in extreme territory, marking one of the most sustained and deepest negative premium ranges in the past year.
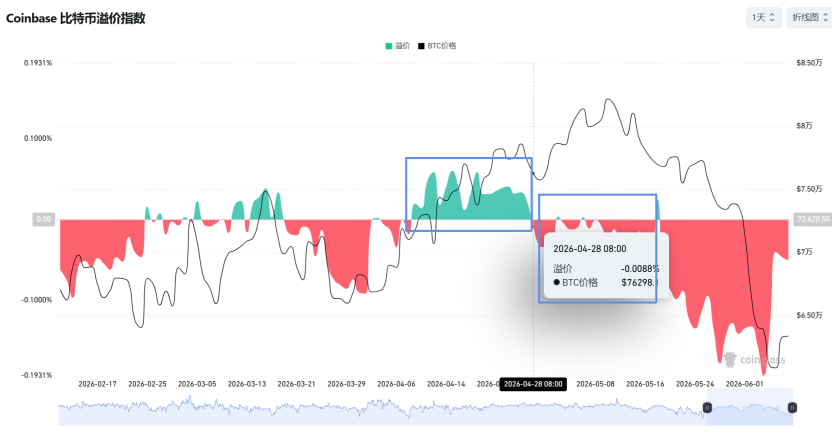
The turning point from positive to negative premiums aligns precisely with the reversal of monthly net outflows from ETFs, with both mutually corroborating each other. The core driver behind this is a reallocation of assets led by relative yield — as the attractiveness of U.S. Treasuries rises, U.S. institutions have been "voting with their feet", replacing BTC positions with U.S. Treasury positions. Interestingly, at the end of the month, despite a decline in U.S. Treasury yields and a clear weakening of arbitrage incentives, the negative premium not only failed to correct but remained firmly sustained — indicating that institutional exits transcended mere "yield comparisons", further confirming expectations of a downward cycle for crypto.
Futures and Spot Basis Differential
As the ETF momentum stalled, CME open interest grew against the trend to over $64 billion. The market switched from being "spot absorption-driven" to "futures positioning-driven" — the so-called "resilience above $80K" is not essentially real increment but a proliferation of leveraged positions. Ultimately, this culminated in a crushing clearing process, with long positions liquidated to $307 million, while short positions only at $90 million.
3. On-chain: Cost Basis Matrix Fully Breached, Surrender Signals Confirmed
On-chain data vividly depicts the "internal clearance".
1. Real Market Average and 200-Day Moving Average, from Never Standing Firm to Confirmed Breach
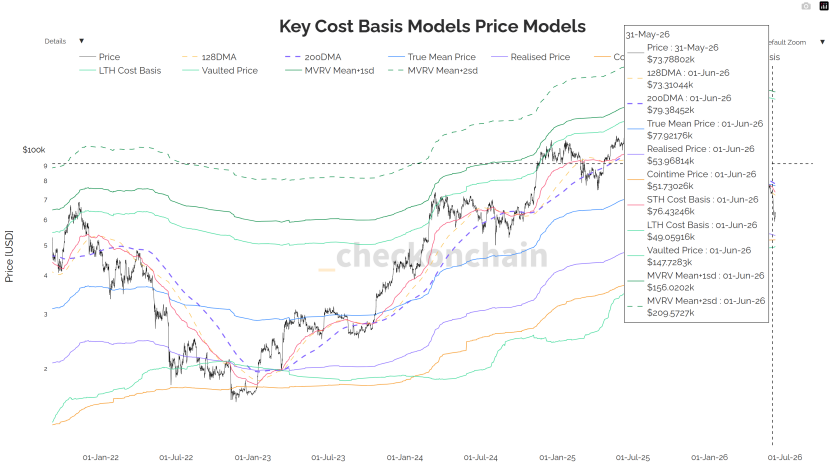
According to the Key Cost Basis Models chart, the real market average along with the 200-day moving average forms a repeatedly validated boundary between bull and bear markets for BTC over the past three cycles, located in the $77K-$79K range in May. The early month's rebound briefly recovered but failed to hold, and a breach below this boundary on May 18 resulted in effectively losing this division. By the end of May, prices were operating below this boundary, supported by lower moving average regions as fact. This critical threshold has shifted from being support below to clouding the head above it, causing all short-term holders to face deep floating losses.
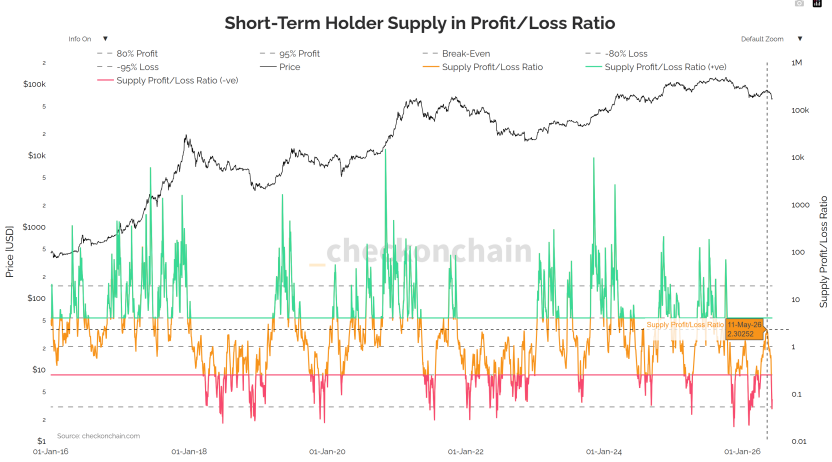
2. Realized Profit and Loss Ratio, Instead of Rising, Declined
This metric with a 30-day average above 1 indicates a profit-taking dominance. The low of 0.4 in February 2026 rose to 1.8 in mid-May — however, to confirm a switch to a bull market, it must continuously remain above 2.0. The fact at the end of May is: not only did it never reach 2.0, but instead fell back to 1.56. Each wave of increases faced selling pressure from early buyers taking profits, hence every rebound was short-lived.
3. MVRV and NUPL, Surrender Signals Confirmed
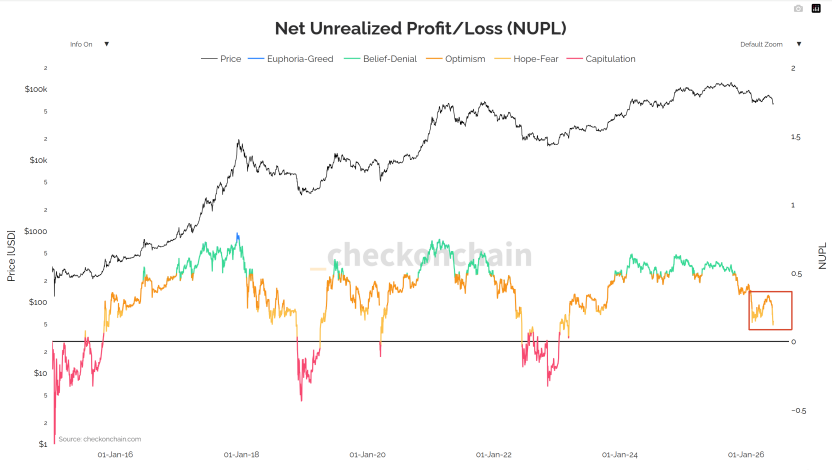
From the STH-MVRV indicator chart, it is clear that this ratio has fallen below the 1.0 balance line, entering the loss area — this is an objective gauge of "overall losses for short-term holders," and one of the most recognizable surrender signals in previous rounds of deep adjustments. The NUPL indicator (net unrealized profit and loss) simultaneously confirms the deterioration of market sentiment: As shown in the chart, the NUPL has significantly declined from the "optimism-belief" range (blue-green) at the start of the year to the edge of the "hope-fear" range (orange), nearing a critical transitional zone before the bottom of the bear market in 2022. This is an objective measure of the ongoing compression of the market's unrealized profit space and the structural retreat in risk preferences.
4. Derivatives and Listed Company Reserves: Leveraging Clearance and the Psychological Line at 75K
1. Market Maker Gamma and Expiration Date Effects
The price stability observed in the early part of the month was due to the long gamma held by market makers. BTC was pinned in a narrow oscillation around the $80K area early in the month, which was not a true supply-demand balance but rather a mechanical "price stabilizer" formed by market makers holding a large amount of long gamma — selling when prices rise and buying when they fall, actively compressing volatility. This is why, even under explosive CPI numbers and geopolitical tensions, BTC's actual volatility continued to decline (30D RV dropped to 27%).
The two consecutive roll-offs for expiration dates directly altered the market structure. On May 15, the monthly expiration saw over $4 billion nominal principal in IBIT alone being settled, and after this giant position rolled off, the stability capabilities of market makers diminished, resulting in BTC breaking below $77.5K on May 18. The second and more critical monthly expiration on May 29 concentrated around $7.5 billion in settlements, with the current price breaking through the 75K major pain point and the largest short gamma area, which exacerbated downward pressure from passive short hedges.
2. The 75K Trap Has Been Triggered
The largest short gamma cluster is locked in the $75K-$76K range (over $8 billion negative gamma). Once it drops into this area, market makers' hedging reverses to sell in the direction, creating a downward gamma squeeze. The reality at the end of the month is this trap has been triggered, breaching the psychological bottom line of the BTC reserves strategy for listed companies. The three layers of resonance defense have only the last one remaining — a deeper cycle-level accumulated cost area.
3. Skew Defense Intentions Continually Elevated
1M Skew expanded from +2.7% at the start of the month to +6.2% at the breach date, while 6M Skew maintained high levels at +10% — institutions are not just hedging against short-term events but building structural downward protection for the entirety of the second half of 2026.
4. Cost Line of Listed Companies' BTC Reserves, from Major Marginal Buying to Potential Selling Pressure
Leading companies with "BTC reserves strategies" have an average cost in the $75,000–$76,000 range. In Q1 financial reports, management first mentioned, "not excluding the possibility of selling some BTC under extreme circumstances" — this is the most rare shift in attitude in the past decade, significantly altering the game structure. Previously, these companies were absolute marginal buyers, expected to increase their holdings under pressure; now, the "possibility of selling" has turned the once largest marginal buying force into pro-cyclical selling pressure. By the end of the month, the price of $73,674 has effectively penetrated this cost line, with many similar companies such as Metaplanet and Semler having costs primarily in the $70K–$80K range — the breach of 75K is not an isolated incident for a single company, but signifies the onset of synchronized deleveraging risks across the entire ecosystem of listed companies' BTC reserves.
5. Future Market Analysis
Current Structural Positioning. We qualitatively assess that at the end of May, "the local top has been confirmed along with the breach of key defenses, with the probability of structural downward extension significantly increasing."
This is the phase where participants are most susceptible to misjudgment — bulls are repeatedly lured into buying the dip with "maybe it's just a healthy adjustment", while bears are repeatedly shaken out with "maybe this is the bottom". However, by the end of the month, harsh facts are laid out: when both macro and geopolitical factors turn positive, the cryptocurrency market does not rise but falls, accompanied by the third-largest monthly outflow from ETFs, a deep turn negative in correlation with the Nasdaq, and short-term on-chain surrender — the pricing power has shifted from "external macro" back to "internal clearance". Before BTC effectively reclaims $77.5K and confirms volume, left-side buying faces high probability penalties for poor performance.
Cycle-level positioning signals worth referencing: The Bitcoin 200-week MA quantile regression's current quantile has dropped to 10.2%, in the historical green "value zone". This is a statistical characteristic that appeared before major bottoms in 2015, late 2018, and late 2022 — it does not constitute a basis for short-term buying, but indicates: from a cyclical perspective, assets have entered a meaningful value range, and the deep clearance of the bear market is being objectively completed. However, it is necessary to clarify that historically, from entering the value zone to actual price stabilization, a time window of 3–6 months is often needed to complete position turnover.
Conclusion
May placed a long-avoided issue in front of everyone in the most counterintuitive way: when external tail risks are removed, and the market still cannot rise, it indicates that the true drag has internalized into the cycle's own clearance momentum. The last week saw geopolitical thawing, interest rate declines, oil price falls, and the stock market rebounding in unison, while BTC fell against the trend, outflows from ETFs reversed from April’s net inflows to May's massive outflow of $2.425 billion, deepened negative correlation with the Nasdaq, and confirmed short-term on-chain surrender — this is a standard example of the "failure of macro transmission to the cryptocurrency market," and encapsulates the brutal characteristics of the four-year cyclic deep bear market. Looking at the 200-week MA quantile's reading of 10.2%, we see that the cyclic level has entered a value zone, but a value zone does not equal a reversal zone; historically, it typically takes 3–6 months from the quantile hitting the bottom to price trends reversing.
For the next real bull market to start, two prerequisites must be met simultaneously: firstly, substantial and sustainable easing of the "inflation-rate-liquidity" triangle, rather than a pulse easing driven by a singular geopolitical event at the end of the month; secondly, a re-ignition of the on-chain demand side (rather than derivative leverage) — blood-stopping flows returning through both ETF and stablecoin channels, Coinbase premiums turning positive from negative, and an end to on-chain surrender.
Before this, conservatism equals value, and discipline equals returns. In the phase where structural clearance has yet to be completed and prices have breached short-term holders' cost bases, this is the most mathematically significant response method. Wealth generation relies on cycles, but survival is always the prerequisite to earn in the next round.
ETF Data: https://sosovalue.com/zh/assets/etf/us-eth-spot
免责声明:本文章仅代表作者个人观点,不代表本平台的立场和观点。本文章仅供信息分享,不构成对任何人的任何投资建议。用户与作者之间的任何争议,与本平台无关。如网页中刊载的文章或图片涉及侵权,请提供相关的权利证明和身份证明发送邮件到support@aicoin.com,本平台相关工作人员将会进行核查。


